
 ?Mathematical formulae have been encoded as MathML and are displayed in this HTML version using MathJax in order to improve their display. Uncheck the box to turn MathJax off. This feature requires Javascript. Click on a formula to zoom.
Abstract
TK1 is an enzyme involved in DNA synthesis and repair. TK1 is usually found elevated in cancer patients’ serum, which makes it a useful tumor proliferation biomarker that strongly correlates with cancer stage, metastatic capabilities, and recurrence risk. In this study, we show that TK1 is upregulated and localizes on the plasma membrane of Burkitt’s lymphoma, acute promyelocytic leukemia, T cell leukemia, and acute lymphoblastic leukemia (ALL). Using flow cytometry, we confirmed that TK1 localizes on the surface of Raji, HL60, and Jurkat cell lines and on ALL clinical samples. Using fluorescent microscopy, we found a strong association of TK1 with the plasma membrane in Raji, HL60, and Jurkat cell lines. These findings were also confirmed by scanning electron microscopy. Our study also shows that this phenomenon does not occur on normal resting or proliferating lymphocytes. In addition, we show that membrane TK1 is found in all oligomeric forms ranging from monomer to tetramer and exhibits enzymatic activity. These findings suggest TK1 as a possible target for immunotherapy with the potential to be utilized in the treatment of hematological cancers.
Introduction
TK1 is a nucleotide salvage pathway enzyme primarily responsible for phosphorylating deoxythymidine to deoxythymidine monophosphate.Citation1 Under normal conditions, TK1 is tightly regulated by the cell cycle. Usually, TK1 levels are low in G1 phase, peak in S phase, and low during the late G2/M phase.Citation2 The low levels of TK1 during the late G2/M phase occur because of degradation, which is believed to be regulated by polyubiquitination that targets degradation via the anaphase-promoting complex/cyclosome (APC/C) pathway.Citation3 The rapid increase in TK1 levels during S phase is believed to be partly mediated by a TK1 regulatory switch, which happens when TK1 switches from a dimer (inactive enzyme) to a tetramer (active enzyme).Citation3–Citation5
In cancer events and upon loss of p53 regulation, TK1’s cell cycle regulation is lost and TK1 levels are upregulated.Citation6 TK1 has been found upregulated in tissue and serum in both solid tumors and hematological malignances, which is why TK1 has been extensively studied as a cancer proliferation biomarker.Citation7,Citation8 The diagnostic and prognostic potential of TK1 has been demonstrated using the traditional TK activity radioassay for hematological malignancies and solid tumors.Citation4,Citation9 Moreover, TK1 levels in serum have been shown to have diagnostic potential in other cancers such as bladder, cervical carcinoma, gastric, non-small cell lung, renal, and colorectal cancers.Citation9–Citation16 Early events in carcinogenesis show an upregulation of TK1 in the serum as well, so TK1 has also been studied as a prognostic marker in many cancer types.Citation7,Citation8,Citation17,Citation18 In summary, high TK1 serum levels correlate with tumor aggressiveness and can be indicative of early events in carcinogenesis.Citation7,Citation9
Burkitt’s lymphoma (BL) and acute lymphoblastic leukemia (ALL) are some of the most highly proliferative hematological malignancies and primarily affect children, with a small incidence in adults too.Citation19,Citation20 BL is an aggressive non-Hodgkin lymphoma that affects B cells. BL is the most common type of pediatric cancer in malaria-endemic regions, such as equatorial Africa, Brazil, and Papua New Guinea, affecting over 40 million children every year.Citation21 While the currently available multi-agent chemotherapy treatment (cyclophosphamide, vincristine, prednisolone, and doxorubicin) has a 5-year event-free survival rate of over 90% in high-income countries, the survival rate is much lower in low-income countries (50% for 1-year event-free survival rate).Citation22,Citation23 ALL is the most common hematological malignancy diagnosed in children in the USA with over 6,000 cases every year.Citation24,Citation25 The highest peak of incidence occurs between the ages of 3–9 years, and it is the number one cause of death from cancer in people under 20 years old.Citation24,Citation25 One of the major complications with ALL in children is the infiltration of leukemic cells in the central nervous system (CNS), which usually occurs in relapse. In the past few decades, there have been major improvements in ALL treatments including an intensive 8-week chemotherapy regimen that has increased ALL 5-year remission rates to up to 85% and overall survival rates from 10% to 90%.Citation26 These new treatments include a combination chemotherapy regimen during the 6–8 months after remission designed to prevent relapse and CNS leukemic infiltration. Unfortunately, 15%–20% of children with ALL will relapse and their survival rates drop to 20%–30%.Citation24 More investigation is needed to understand the unique characteristics of BL and ALL and to find new targets that could help increase the survival.
Due to the proliferative nature of BL and ALL, we hypothesized that TK1 was highly expressed in BL and ALL cells. While investigating this hypothesis, we found TK1 to be overexpressed on the membrane of BL, acute promyelocytic leukemia, acute T cell leukemia, and ALL clinical samples. Of note, TK1 is not readily detectable on the membrane of normal resting or proliferating lymphocytes, and thus TK1 membrane localization appears to be an event exclusive in malignant cells. Moreover, membrane TK1 is found in all oligomeric forms and exhibits enzymatic activity. These findings suggest that TK1 is a tumor-specific antigen on the cell surface and therefore a potential immunotherapy target for BL and ALL.
Materials and methods
Tissue collection, cell lines, and ALL samples
Raji (BL), HL60 (acute promyelocytic leukemia), and Jurkat (acute T cell leukemia) cell lines were purchased from American Type Culture Collection (ATCC, Manassas, VA, USA). All cell lines were authenticated by short tandem repeat (STR) analysis at the University of Arizona Genetics Core Facility prior to our study. All cells were grown in Roswell Park Memorial Institute (RPMI) 1640 supplemented with 10% fetal bovine serum (FBS) and 2 mM l-glutamine and incubated at 37°C with 5% CO2. ALL samples were obtained from patients at diagnosis or relapse after informed consent on a biobank protocol at the Huntsman Cancer Institute (Salt Lake City, UT, USA) and frozen with dimethyl sulfoxide (DMSO) and albumin in aliquots. ALL samples were thawed at 37°C and washed with Dulbecco's phosphate-buffered saline (DPBS) immediately before use.
Mononuclear cell separation
Whole blood was collected from healthy young volunteers aged 18–30 years under institutional review board (IRB) approval from the Office of Research and Creative Activities at Brigham Young University (BYU X090281). All healthy blood volunteers provided written informed consent. Blood was diluted 1:1 with DPBS layered on top of lymphocyte separation medium (LSM) (Cellgro; Corning Incorporated, Corning, NY, USA) and centrifuged at 400× g for 30 minutes without brake or acceleration. The mononuclear cell layer was aspirated and rinsed with DPBS. The cells were treated with red blood cell lysis buffer and resuspended in RPMI 1640 supplemented with 10% FBS and 20% human serum from the original blood donor. After a further incubation for 24 hours at 37°C with 5% CO2, the lymphocytes were aspirated and washed with DPBS and prepared for flow cytometry and scanning electron microscopy (SEM).
B cell magnetic sorting
Lymphocytes (B and T cells) were obtained by mononuclear cell separation from whole blood with LSM. Cells were then washed with magnetic-activated cell sorting (MACS) buffer and stained with anti-CD19 antibody conjugated to biotin. We incubated these cells with streptavidin–gold magnetic MACS beads (Miltenyi Biotech, Bergisch Gladbach, Germany), and CD19+ cells were sorted via magnetic selection. Cells were resuspended in MACS buffer and then washed and resuspended in DPBS for downstream application.
B cell proliferation
B cells obtained through magnetic selection were seeded at 2×10⁵ cells/mL in a six-well plate in RPMI 1640 supplemented with 10% FBS. We used the CellXVivo Human B Cell Expansion Kit (R&D Systems, Inc., Minneapolis, MN, USA) to induce proliferation. We counted the B cells and incubated them following the kit’s instructions for 5 days. After 5 days, we observed the cells under a microscope to assess proliferation and counted them again to quantify division. Cells were washed and resuspended in DPBS and used in flow cytometry.
Antibodies
We used three custom mouse monoclonal antibodies developed in our laboratory against TK1 (CB1, A72, and A74) and a commercially available rabbit monoclonal antibody against TK1 (ab91651; Abcam, Cambridge, UK). CB1 binds to a region in the C-terminal domain of TK1, specifically to the active domain.Citation27–Citation29 A72 and A74 are against an immunodominant region beside the TK1 C-terminal domain.Citation9 The three custom antibodies were conjugated to fluorescein isothiocyanate (FITC) using a conjugation kit (EasyLink, ab102884; Abcam) and stored in the dark at 4°C. The custom antibodies were used for most assays, and the commercially available antibody (ab91651) was used for immunohistochemistry. The ALL samples were stained with CD34-APC-Cy7, HLA-DR-AlexaFluor488, and commercial (ab91651) APC for staining of ALL samples. CD34 and HLA-DR antibodies were purchased from BioLegend (San Diego, CA, USA).
Flow cytometry
Raji, Jurkat, and HL60 cell lines, normal lymphocytes, and B cells were washed 3× in DPBS. All cells were resuspended in DPBS at 5×10⁵ cells/mL and were placed in individual microcentrifuge tubes and incubated with Fc block (Human TruStain FcX; BioLegend) for 10 minutes at room temperature. Cells were then stained with CB1, A72, and A74 conjugated to FITC. Negative controls included unstained cells and cells stained with an isotype antibody. ALL samples were resuspended in Cell Staining Buffer (BioLegend), incubated with Fc Block for 10 minutes at room temperature and then stained with isotype control, CD34 (APC-Cy7), HLA-DR (AlexaFluor488) to confirm ALL phenotype and with commercial (APC) to check for TK1 expression. For lymphocytes treated with TK1, we incubated 5×10⁶ cells/well in a six-well plate and added DPBS or concentrations of yeast recombinant TK1 at 0.25 µM, 0.5 µM, or 0.75 µM. Cells were incubated at 37°C and 5% CO2 for 24 hours; then, the cells were washed 3× in DPBS and incubated in Fc block for 10 minutes, after which cells were stained with anti-TK1 antibody ab91651 and then with an anti-rabbit secondary FITC antibody. Negative controls included unstained sample, anti-NFκB (rabbit), and anti-rabbit secondary FITC antibody. We also performed dead cell discrimination using a propidium iodide (PI) solution (2 mg/mL) immediately before analysis. We collected 10,000 events per sample in a flow cytometer (Attune; Thermo Fisher Scientific, Waltham, MA, USA), and the data were analyzed using the FlowJo software (FlowJo, Inc., Ashland, OR, USA).
Fluorescent microscopy
Raji, HL60, and Jurkat cell lines and normal lymphocytes were stained with FITC-conjugated antibodies, namely isotype control, anti-NaK antibody, or anti-TK1 antibody (CB1) for 30 minutes on ice and in the dark. Cells were washed with cold DPBS and then were resuspended at 5×10⁵ cells/mL. Approximately 20 µL of cell solution was placed on a glass slide, after which a drop of mounting medium containing 4′,6-diamidino-2-phenylindole (DAPI) was added to the sample (Vectashield Antifade Mounting Medium with DAPI; Vectashield, Burlingame, CA, USA), and a coverslip was placed on top. Cells were visualized in a light microscope (Zeiss Imager A.1 Fluorescence Microscope; Carl Zeiss Meditec AG, Jena, Germany) using different channels to detect fluorescence. Blue represents DAPI fluorescence and green represents FITC fluorescence.
SEM
Raji cells and normal lymphocytes were washed 3× in DPBS for 5 minutes to remove medium and cellular debris. The cells were then resuspended in flow cytometry staining buffer (eBioscience; Thermo Fisher Scientific) for 15 minutes and then blocked with 1% bovine serum albumin (BSA) in DPBS (BSA/DPBS) for 5 minutes. We then added anti-TK1 antibody (A72) conjugated to biotin at a concentration of 0.005 µg/µL and incubated the cells for 15 minutes on ice. After incubation with primary antibody, we washed the cells with BSA/DPBS twice. We then stained the cells with anti-biotin conjugated to 2 nm gold nanoparticles (Nanoprobes, Yaphank, NY, USA) at a concentration of 1:500 in BSA/DPBS and incubated for 30 minutes on ice. We then washed the cells with BSA/DPBS for 5 minutes and twice with DPBS to remove any block. After staining, we fixed the cells in 0.2% glutaraldehyde for 15 minutes followed by a wash in 0.02 M glycine for 10 minutes to quench the fixative. We then rinsed the cells 3× in DPBS and used a cytocentrifuge (Cytospin; Thermo Fisher Scientific) to spread the cells onto coverslips. Cells were then rinsed 3× with ddH2O, and gold particles, if present, were enhanced for 3 minutes using the GoldEnhance™ EM Plus kit (Nanoprobes). The cells were then rinsed 3× with ddH2O and dehydrated via sequential washes of 70%, 80%, 90%, and 100% EtOH for 5 minutes each. After the coverslips were dry, we imaged them using an XL-30 ESEM (Philips, Amsterdam, the Netherlands). Pictures provided were taken using a gaseous secondary electron (GSE) detector. Raw images are provided next to enhanced images showing red dots as gold. Energy-dispersive analysis X-ray (EDAX) was performed on all samples to quantify the levels of gold present. EDAX will provide a k-ratio, a Z-value, an A-value, and an F-value. The k-ratio represents the element’s peak height compared to a sample of the pure element collected under the same conditions. The Z-value represents a correction in the atomic number taking backscattered election yield of the pure element and the sample. The A-value represents a compensation for X-rays generated in the sample that cannot emit energy. The F-value represents a correction for the generation of X-rays. We used these EDAX output values to normalize our samples’ gold weight percentages using the following equation:
Plasma membrane and cytoplasmic protein isolation and Western blotting
To separate the plasma membrane and cytoplasmic proteins, we used the Pierce™ Cell Surface Protein Isolation Kit (Thermo Fisher Scientific; catalog number, 89881). For this procedure, we used 4×10⁷ Raji cells or normal lymphocytes per test. Normal lymphocytes were isolated as described in the “Mononuclear cell separation” section. To label the cells with biotin, cells were incubated with 40 mL of biotin solution in a T75 flask. Biotin solution was made by dissolving the contents of one vial of Sulfo-NHS-SS-Biotin (provided in the kit) in 48 mL of ice-cold PBS. The flask was incubated on a rocking platform with gentle agitation for 30 minutes at 4°C. After incubation, 500 µL of quenching solution was added to the flask to quench the reaction. Then, cells were transferred to a conical tube and pelleted at 500× g for 3 minutes, after which the supernatant was discarded. Cells were then washed with 5 mL of tris-buffered saline by pipetting up and down twice with a serological pipette and pelleted at 500× g for 3 minutes. A cocktail of protease inhibitors was added to 500 µL of lysis buffer (provided in the kit) and added to the cell pellet. The cells in lysis buffer were transferred to a microcentrifuge tube and resuspended in the fluid by pipetting up and down. The cells were then disrupted using a cell disruptor (Sonicator 3000; Misonix, Inc., Farmingdale, NY, USA) at low power (1.5 amplitude) on ice using five 1-second bursts. Cells were incubated for 30 minutes on ice, vortexed every 5 minutes for 5 seconds, and sonicated for 1 second at low power (1.5 amplitude) every 10 minutes. The cell lysate was centrifuged at 10,000× g for 2 minutes at 4°C, and the clarified supernatant was transferred to a new microcentrifuge tube. To isolate the biotin-labeled proteins, the clarified supernatant was added to a column that contained 500 µL of NeutrAvidin Agarose that had been previously washed with 500 µL of wash buffer and centrifuged for 1 minute at 1,000× g. The column was capped and incubated for 60 minutes at room temperature with end-over-end mixing using a rotator. Then, the column was centrifuged for 1 minute at 1,000× g, and the flow-through was kept for cytoplasmic protein analysis. The column was washed 3× with 500 µL of wash buffer containing a cocktail of protein inhibitors to remove any other cytoplasmic proteins. To elute the membrane proteins, a 50 mM dithiothreitol (DTT) solution was made by adding 23.7 µL of 1 M DTT to 450 µL sodium dodecyl sulfate polyacrylamide gel electrophoresis (SDS-PAGE) sample buffer. Approximately 450 µL of DTT solution was added to the column and incubated for 60 minutes at room temperature with an end-over-end mixing on a rotator. The column was then centrifuged for 2 minutes at 100× g, and the flow-through was collected and stored at −20°C. For Western blot analysis, samples were thawed on ice after which they were boiled for 5 minutes and then run on a 12% acrylamide SDS gel at 90 V for 2–3 hours. The proteins on the gel were transferred onto a nitrocellulose membrane at 90 V for 50 minutes. The membrane was blocked with 5% nonfat milk in DPBS for 1 hour at 4°C on a rotating platform and then incubated in anti-TK1 commercial antibody (ab91651) in a 1:1,000 dilution in milk overnight at 4°C on a rotating platform. Membrane was washed 3× in DPBS for 3 minutes each in a rotating platform and then incubated with an IRDye 800 donkey anti-rabbit secondary antibody for 1 hour at 4°C on a rotating platform (LI-COR, Lincoln, NE, USA). Finally, the membrane was washed 3× with DPBS and imaged in an Odyssey CLx Imaging System (LI-COR).
Membrane separation and TK1 activity radioisotope assay
Plasma membranes were separated using a sucrose gradient. First, Raji, Jurkat, and HL60 cell lines were grown to an exponential growth phase. A total of 17×107 cells were pelleted at 210× g for 20 minutes, and the pellets were resuspended in 6 mL of a buffer consisting of 20% (v/w) sucrose–Tris buffer (pH 6.8). The cell suspension was freeze-thawed in liquid nitrogen and then at 37°C 3× and centrifuged at 600× g for 10 minutes at 4°C to collect cell membranes. The supernatant was discarded, and the pellet, containing the membranes, was washed with Tris buffer (pH 6.8) and then resuspended in 9 mL of 20% (w/v) sucrose–Tris buffer. A two-step sucrose gradient was prepared in a Beckman open-top tube (Beckman Coulter, Brea, CA, USA; catalog number, 337922) by adding 13 mL of 70% (w/v) sucrose–Tris buffer, followed by 12 mL of 50% (w/v) sucrose–Tris buffer, followed by 9 mL of 20% (w/v) sucrose–Tris buffer containing the membranes. The gradients were centrifuged at 25,000 rpm for 14 hours in a Beckman L8-60M ultracentrifuge (Beckman Coulter). The plasma membranes are found at the 50%–70% (w/v) sucrose–Tris buffer interface. The membranes were collected by the bottom drip method, which consists of using a hot needle to create a hole at the bottom of the tube and collecting each layer separately drop-by-drop. The 50%–70% (w/v) sucrose–Tris buffer interface was diluted to below 20% (w/v) sucrose–Tris buffer using Tris buffer (pH 6.8). The diluted interface was centrifuged at 47,000 rpm for 1 hour, and the pellet was resuspended in 1 mL Tris buffer (pH 6.8). This solution containing the membranes was used in the TK radioisotope assay. The TK radioisotope assay was previously described by O’Neill et al.Citation30 Briefly, reactions were set up with 100 µL of the solution containing the membranes and 100 µL of a solution containing 2 µM [3H]-thymidine, 0.02 M Tris, 20 µM MgCl2, 0.2 M KCl, 0.1 M NH4Cl, 5 mM β-mercaptoethanol or DTT, and 4 mM adenosine triphosphate (ATP) or 4 mM cytidine triphosphate (CTP) for 1 hour at 37°C. After incubation, four 25 µL of each sample were applied to 2.5 cm DE-81 paper disks (Sigma-Aldrich Co., St Louis, MO, USA; catalog number, Whatman Article No, 28419431), and the disks were washed 3× in 20 mM ammonium formate (Sigma-Aldrich Co.; catalog number, 156264), followed by a wash in 95% ethanol and a wash in distilled water. The disks were placed in scintillation vials with 3 mL of CytoScint (MP Biomedicals, Santa Ana, CA, USA; catalog number, 0188245301), and the radioactivity was measured using a wet scintillation counter (Beckman Coulter; model number LS6500).
Statistical analysis
Flow cytometry and TK1 activity data were analyzed using an unpaired t-test comparing the isotype control to each of the samples. Error bars represent the standard error of the mean. EDAX data were analyzed using a Kruskal–Wallis one-way analysis of variance (ANOVA) test. Two-tailed P-values ≤0.05 were determined to be significant.
Results
Flow cytometry shows a significant fluorescent shift in Raji, HL60, and Jurkat cells bound to anti-TK1 antibodies suggesting that TK1 is localized on the plasma membrane of these cells
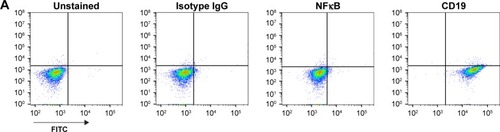
Using standard surface staining and flow cytometry, we discovered that Raji cells have a significant fluorescent shift compared to controls when bound to TK1 antibodies, suggesting that TK1 is found on the outer cell membrane of Raji cells (). We used an anti-NFκB antibody as a control to confirm the integrity of the cell membrane since TK1 is also a cytoplasmic protein. The cells were NFκB negative, which suggests that our anti-TK1 antibodies were indeed bound to the surface of the cell and not internalized (). We also used CD19 as positive surface staining control. This finding that TK1 is on the surface of Raji cells was confirmed using three different monoclonal antibodies against different TK1 epitopes (). Quantification and statistical analysis of the fluorescent shifts show a significant difference in the percentage of Raji cells positive for TK1 compared to isotype control ().
Figure 1 Flow cytometry analysis of Raji cells.
Abbreviation: FITC, fluorescein isothiocyanate.
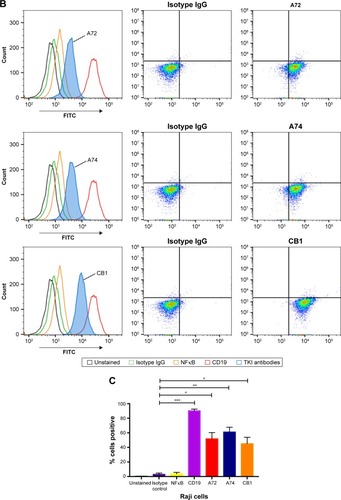
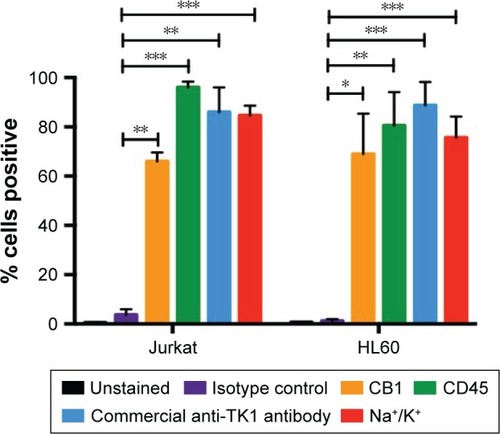
To confirm these findings, we also stained other hematological cancer cell lines such as HL60 (acute promyelocytic leukemia) and Jurkat (acute T cell leukemia) with CB1 conjugated to FITC and a commercially available anti-TK1 antibody conjugated to FITC. We used CD45 and Na+/K+ ATPase as positive controls, as both cells express them highly on their membrane. Both HL60 and Jurkat cells showed a significant fluorescent shift when bound to TK1 antibody ().
Figure 2 Flow cytometry analysis of HL60 and Jurkat cells.
Fluorescent microscopy suggests that TK1 is associated with the plasma membrane
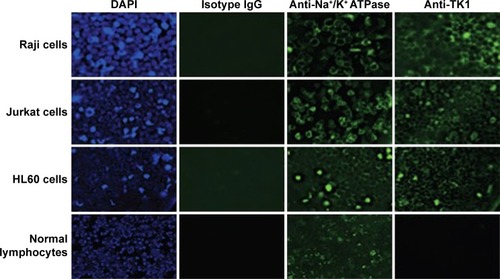
To confirm that TK1 was associated with the membrane, we produced images using a fluorescent microscope to visualize this membrane localization phenomenon. We stained Raji, Jurkat, and HL60 cell lines and normal lymphocytes with CB1 antibody conjugated to FITC (). Our isotype control shows minimal fluorescent background, while the samples treated with antibodies against Na+K+ ATPase and TK1 showed strong FITC signals on the cell membranes, suggesting a strong association of TK1 with the cell membranes. Normal lymphocytes show minimal FITC signal associated with TK1, indicating minimal presence of TK1 on their surface.
Figure 3 Fluorescent microscopy images of viable Raji, Jurkat, and HL60 cells and normal lymphocytes stained with CB1-FITC (anti-TK1 antibody), isotype control, anti-Na+K+ ATPase antibody, and DAPI at 20×.
Abbreviations: DAPI, 4′,6-diamidino-2-phenylindole; FITC, fluorescein isothiocyanate.
TK1 is absent on the plasma membrane of normal lymphocytes
To test whether TK1 membrane localization was exclusive to malignant cells, we stained normal resting lymphocytes from whole blood with our antibodies. We isolated mononuclear cells from whole blood using LSM. We analyzed these cells immediately using flow cytometry. These normal lymphocytes were CD45+ and TK1−. We also tested whether the localization of TK1 on the surface was due to proliferation. We magnetically sorted CD19+ cells from mononuclear lymphocytes isolated from whole blood by using an anti-CD19 antibody conjugated to biotin which we bound to streptavidin magnetic beads. We stimulated these cells to proliferate using the CellXVivo Human B Cell Expansion Kit (R&D Systems, Inc.). We then stained the cells with the same antibodies used with the resting lymphocytes using CD45 as positive control and analyzed the cells through flow cytometry. Flow cytometry analysis confirmed that normal lymphocytes do not significantly upregulate TK1 on their surface even when undergoing cell division (). These results indicate that the localization of TK1 on the outside layer of the plasma membrane may be an event exclusive to malignant cells.
Figure 4 Flow cytometry quantification analysis of normal lymphocytes.
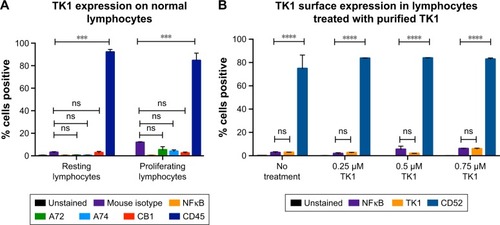
In addition, to test whether extracellular TK1 interacts with membrane, we incubated normal lymphocytes with 0.25 µM, 0.50 µM, 0.75 µM, and 1 µM of purified TK1 for 24 hours and then probed the cells with anti-TK1 antibody. Flow cytometry analysis showed that there is no significant expression of TK1 on the surface of these lymphocytes when exposed to supraphysiological levels of TK1 (). These results suggest that there is no interaction of membrane with extracellular TK1.
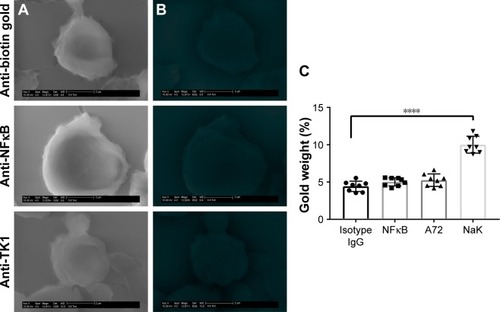
SEM shows further confirmation of TK1 localization on the surface of cancer cells
To further confirm the location of TK1 on the surface of cancer cells, we developed an SEM protocol and used gold nanoparticles to visualize TK1. For this procedure, we used our A72 antibody. TK1 is shown to be expressed on the surface of Raji cells () and is absent in normal resting lymphocytes (). EDAX helped us quantify the amounts of gold present on the cell surface. The Raji cells probed with A72 antibody show significantly higher amounts of gold bound to their membrane than Raji cells probed isotype control. Raji cells probed with A72 antibody show similar amounts of gold to Raji cells probed with Na+/K+ antibody (). In normal lymphocytes, the amounts of gold in Raji cells probed with A72 are similar to those probed with isotype control, suggesting that TK1 is absent on the surface of normal lymphocytes ().
Figure 5 SEM of Raji cells.
Abbreviations: EDAX, energy-dispersive analysis X-ray; GSE, gaseous secondary electron; SEM, scanning electron microscopy.
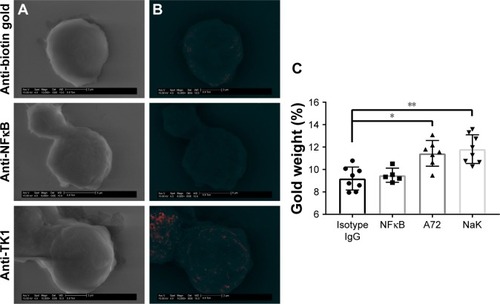
Figure 6 SEM of normal lymphocytes.
Abbreviations: EDAX, energy-dispersive analysis X-ray; GSE, gaseous secondary electron; SEM, scanning electron microscopy.
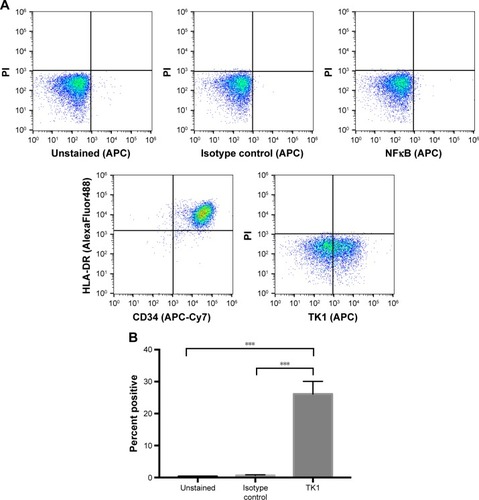
ALL clinical samples also express TK1 on their plasma membrane
To ensure TK1’s relevance in clinical samples, we tested ALL samples (n=9) obtained from the Huntsman Cancer Institute. These samples were CD34+ and HLA-DR+ as expected (). We performed alive/dead cell discrimination to prevent any false positives in these samples. All ALL samples tested were positive for TK1. Cell viability impacted the analysis as we got lower event counts when we discriminated dead cells. However, even in samples with low viable cell count, TK1 was expressed on the cell membrane. Percentage of cells positive for TK1 varied from 8% to 43.5%, averaging 28.01% (). We believe that we see this big range due to disease progression and grade.
Figure 7 Flow cytometry analysis of ALL clinical samples.
Abbreviations: ALL, acute lymphoblastic leukemia; PI, propidium iodide.
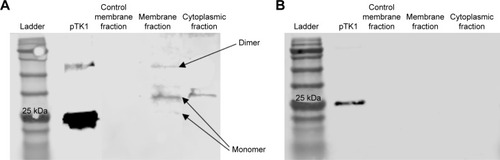
TK1 on the membrane is found in different oligomeric
To further characterize TK1 on the membrane, plasma membrane and cytoplasmic proteins were isolated from Raji cells and normal lymphocytes. Both the membrane and the cytosolic proteins were run on a 12% acrylamide SDS gel and then transferred to a nitrocellulose membrane and probed with anti-TK1 antibody ab91651. Results show that the Raji cell membrane protein fraction contains mostly monomers and dimers of TK1 (). On the other hand, the normal lymphocyte membrane protein fraction contains minimal traces of TK1 ().
Figure 8 Western blot of membrane and cytosolic fractions in Raji cells and normal lymphocytes and probed with anti-TK1 antibody.
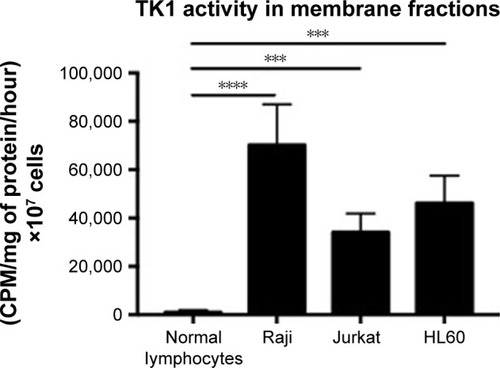
TK1 on the membrane shows activity
Membrane fractions of Raji, Jurkat, and HL60 cell lines and normal lymphocytes were used in a radioassay to measure TK1 activity. TK1 activity was measured by subtracting the enzymatic activity with CTP as the phosphate donor from the total enzymatic activity with ATP as the phosphate donor. The reasoning behind this is that TK2, an isozyme form of TK1 found in mitochondria, favors CTP as the phosphate donor. By subtracting the enzymatic activity with CTP as the phosphate donor, we ensure that the remaining enzymatic activity is purely due to TK1 activity, as described by Lee and Cheng.Citation31 Our data show that the membrane fractions of Raji, Jurkat, and HL60 cell lines show TK1 enzymatic activity (). Moreover, these membrane fractions show higher TK1 activity levels than those in normal lymphocytes. This could be due to minimal presence of TK1 on the surface of normal lymphocytes.
Figure 9 TK1 activity in membrane fractions.
Abbreviation: CMP, counts per minute.
Discussion
BL and ALL are complex diseases that affect millions of children worldwide. They are also two of the fastest proliferating tumors in humans.Citation19,Citation20 Rapid cellular proliferation and resisting apoptosis are two of the hallmarks of cancer that we can clearly see in hematological malignancies, especially in BL and ALL.Citation21,Citation24,Citation25,Citation32,Citation33 Early events in the deregulation of the cell cycle can lead to rapid proliferation and possible cancer. Current treatments for BL and ALL include combination chemotherapy drugs that cause debilitating side effects in children; therefore, there is an immediate need to identify new targets to treat BL and ALL through immunotherapy. This study provides a potential novel target against these malignancies.
Our study shows that upregulation of TK1 can also be found on the membrane of hematological malignancies. This upregulation can be due to increased levels of TK1 in the cell during cellular division, an event that happens very frequently in most cancer, especially in BL and ALL.Citation19,Citation20 In this study, we show the novel finding that multiple hematological cancer cell lines and ALL clinical samples express high levels of TK1 on their surface. Interestingly, this is not seen in resting or proliferating normal lymphocytes. TK1’s expression appears to be similar to that of CD229 in multiple myelomas, where CD229 is upregulated only in malignant cells and remains low/absent in normal lymphocytes.Citation34
In addition, our data suggest that membrane TK1 is found in monomeric and dimer form and has enzymatic activity suggesting that TK1 has a function on the membrane. The actual function of membrane TK1 and the mechanism/pathway by which TK1 reaches the membrane remain unknown. However, our data suggest that the origins of membrane TK1 are endogenous and do not come from serum TK1. We believe that during rapid proliferation events in malignancy, as TK1 protein levels increase, TK1 interacts with one or several membrane proteins in the endoplasmic reticulum (ER). For example, SELZ6 and ODC1 are membrane proteins known to interact with TK1.Citation35–Citation37 Both of these proteins also upregulate during malignancy events and are found in greater quantities on the cellular membrane. Perhaps their interaction results in TK1 being transported to the membrane, remaining there, or perhaps being released into the bloodstream to be later found in the serum.
The findings presented in this study are important as they represent the discovery of a novel antigen on the surface of some cancer cells, which if used in conjunction with current immunotherapeutic treatments, such as chimeric antigen receptor (CAR) T cells, has the potential to improve treatments for different hematological malignancies.
Conclusion
TK1 is localized on the surface of Raji (BL), HL60 (acute promyelocytic leukemia), and Jurkat (acute T cell leukemia) cell lines and ALL clinical samples, and not on the surface of normal resting or proliferating lymphocytes, and may be used as a target to treat hematological malignancies.
Acknowledgments
This study was supported by funding from the Brigham Young University Department of Microbiology and Molecular Biology, the Brigham Young University College of Life Sciences, and the Simmons Center for Cancer Research. We thank Dr Juan Arroyo for his technical assistance in microscopy imaging/processing and Jaden Evans for his assistance with the radioactive assays.
Disclosure
The authors report no conflicts of interest in this work.
References
- ChenY-LErikssonSChangZ-FRegulation and functional contribution of thymidine kinase 1 in repair of DNA damageJ Biol Chem201028535273272733520554529
- SherleyJLKellyTJRegulation of human thymidine kinase during the cell cycleJ Biol Chem198826317835083583372530
- AlegreMelissa MRobisonRichard AO’NeillKim LThe Clinical Significance and Biology of Thymidine Kinase 1Oncology: Theory & Practice978-1-922227-80-5iConcept Press2014
- ZhouJHeESkogSThe proliferation marker thymidine kinase 1 in clinical useMol Clin Oncol201311182824649117
- Munch-PetersenBReversible tetramerization of human TK1 to the high catalytic efficient form is induced by pyrophosphate, in addition to tripolyphosphates, or high enzyme concentrationFEBS J2009276257158019087190
- SchwartzJLTamuraYJordanRGriersonJRKrohnKAEffect of p53 activation on cell growth, thymidine kinase-1 activity, and 3′-deoxy-3′fluorothymidine uptakeNucl Med Biol200431441942315093811
- GronowitzJSHagbergHKällanderCFSimonssonBThe use of serum deoxythymidine kinase as a prognostic marker, and in the monitoring of patients with non-Hodgkin’s lymphomaBr J Cancer19834744874956849793
- O’NeillKLZhangFLiHFujaDGMurrayBKThymidine kinase 1 – a prognostic and diagnostic indicator in ALL and AML patientsLeukemia200721356056317252017
- AlegreMMWeyantMJMJBennetDTSerum detection of thymidine kinase 1 as a means of early detection of lung cancerAnticancer Res20143452145215124778016
- McKennaPGO’NeillKLAbramWPHanniganBMThymidine kinase activities in mononuclear leukocytes and serum from breast cancer patientsBr J Cancer19885766196223408646
- WuB-JLiW-PQianCDingWZhouZ-WJiangHIncreased serum level of thymidine kinase 1 correlates with metastatic site in patients with malignant melanomaTumour Biol201334264364823179401
- O’NeillKLHoperMOdling-SmeeGWCan thymidine kinase levels in breast tumors predict disease recurrence?J Natl Cancer Inst19928423182518281433372
- FujiwakiRHataKMoriyamaMClinical value of thymidine kinase in patients with cervical carcinomaOncology20016114754
- SvobodovaSTopolcanOHolubecLPrognostic importance of thymidine kinase in colorectal and breast cancerAnticancer Res2007274A1907190917649793
- LuoPHeEErikssonSThymidine kinase activity in serum of renal cell carcinoma patients is a useful prognostic markerEur J Cancer Prev200918322022419282758
- ZhangJJiaQZouSThymidine kinase 1: a proliferation marker for determining prognosis and monitoring the surgical outcome of primary bladder carcinoma patientsOncol Rep200615245546116391869
- AlegreMMRobisonRAO’NeillKLThymidine kinase 1 upregulation is an early event in breast tumor formationJ Oncol2012201257564722778736
- AlegreMMRobisonRAO’NeillKLThymidine kinase 1: a universal marker for cancerCancer Clin Oncol201321159
- DunleavyKPittalugaSShovlinMLow-intensity therapy in adults with Burkitt’s lymphomaN Engl J Med2013369201915192524224624
- ThomasDAFaderlSO’BrienSChemoimmunotherapy with hyper-CVAD plus rituximab for the treatment of adult Burkitt and Burkitt-type lymphoma or acute lymphoblastic leukemiaCancer200610671569158016502413
- MolyneuxEMRochfordRGriffinBBurkitt’s lymphomaLancet201237998221234124422333947
- HesselingPBroadheadRMansveltEThe 2000 Burkitt lymphoma trial in MalawiPediatr Blood Cancer200544324525015547922
- GerrardMCairoMSWestonCFAB LMB96 International Study CommitteeExcellent survival following two courses of COPAD chemotherapy in children and adolescents with resected localized B-cell non-Hodgkin’s lymphoma: results of the FAB/LMB 96 international studyBr J Haematol2008141684084718371107
- HungerSPMullighanCGAcute lymphoblastic leukemia in childrenN Engl J Med2015373161541155226465987
- InabaHGreavesMMullighanCGAcute lymphoblastic leukaemiaLancet201338198811943195523523389
- HentrichRibera J-MMarcusBartaStefanKAcute lymphoblastic leukemiaHIV-Associated Hematological MalignanciesChamSpringer International Publishing2016145151
- ZhangFShaoXLiHRobisonJGMurrayBKO’NeillKLA monoclonal antibody specific for human thymidine kinase 1Hybridoma2001201253411289224
- O’NeillKLMonoclonal antibodies to thymidine kinase 1 and uses in diagnostic and therapeutic applications199731921
- O’NeillK webpage on the InternetAnti-cancer activity of an anti-thymidine kinase monoclonal antibodyUS Pat App12/767,489201054 Available from: https://www.google.com/patents/US20100266495Accessed May 30, 2017
- O’NeillKLAbramWPMcKennaPGSerum thymidine kinase levels in cancer patientsIr J Med Sci198615582722743759377
- LeeLSChengY-CHuman deoxythymidine kinase II: substrate specificity and kinetic behavior of the cytoplasmic and mitochondrial isozymes derived from blast cells of acute myelocytic leukemiaBiochemistry19761517368636901066165
- MilnerAEGrandRJWatersCMGregoryCDApoptosis in Burkitt lymphoma cells is driven by c-mycOncogene1993812338533918247541
- HanahanDWeinbergRAHallmarks of cancer: the next generationCell2011144564667421376230
- AtanackovicDPanseJHildebrandtYSurface molecule CD229 represents a target for the treatment of multiple myelomaHaematologica201196101512152021606160
- VinayagamAStelzlUFoulleRA directed protein interaction network for investigating intracellular signal transductionSci Signal20114189rs821900206
- StelzlUWormULalowskiMA human protein-protein interaction network: a resource for annotating the proteomeCell2005122695796816169070
- WangJHuoKMaLToward an understanding of the protein interaction network of the human liverMol Syst Biol20117153621988832