
Abstract
Purpose
NANOG is a master transcription factor that regulates stem cell pluripotency and cellular reprograming. Increased NANOG expression has been associated with poor survival in several human malignancies. However, the clinical significance of NANOG overexpression in lung cancer has been scarcely evaluated. The aim of this study was to investigate whether NANOG levels are associated with clinical outcomes of patients with non–small cell lung cancer (NSCLC) who were treated with platinum-based chemotherapy.
Methods
NANOG levels were evaluated immunohistochemically using the histologic score (H-score) in tumor tissues from patients with advanced NSCLC who received platinum-based doublet treatment. We performed survival analyses according to the NANOG levels and evaluated the association between clinicopathological parameters and levels of NANOG.
Results
Multivariate analyses using 112 tumor specimens showed that high NANOG levels were independently associated with short progression-free survival (hazard ratio [HR] =3.09, 95% confidence interval [CI]: 2.01–4.76) and with short overall survival (HR =3.00, 95% CI: 1.98–4.54). Similar results were shown in the subgroup analyses for patients with adenocarcinoma and squamous cell carcinoma. NANOG expression was not associated with any clinicopathological parameter such as age, gender, smoking status, stage, differentiation, or histological subtypes.
Conclusion
NANOG overexpression was associated with poor response and short overall survival in patients with advanced NSCLC who were treated with platinum-based chemotherapy, suggesting that NANOG could be a potential adverse predictive marker in this setting.
Introduction
Despite intensive efforts to control cancer-associated morbidity and mortality, lung cancer is still the leading cause of cancer-related death globally.Citation1 Approximately 220,000 new cases of lung cancer and 158,000 cases of lung cancer-related deaths occurred in the Unites States in 2015.Citation1 Non–small cell lung cancer (NSCLC) is a major type of lung cancer, which contributes 80% of cases to this fatal disease. Although several tyrosine kinase inhibitors targeting the epidermal growth factor receptor (EGFR) mutation and anaplastic lymphoma kinase rearrangement have contributed to the increased survival of patients with NSCLC, platinum-based combination chemotherapy is the standard of care for advanced diseases, especially in patients who do not harbor these genetic abnormalities. Therefore, it is clinically important to discover biomarkers that allow prediction of treatment response or survival after chemotherapy.
Although several potential predictive biomarkers such as the KRAS mutation and the excision repair of cross-complementation group 1 in the context of platinum-based chemotherapy have been extensively investigated, the clinical utility of those biomarkers was found to be unacceptable.Citation2–Citation4 Recently, numerous biomarkers are under active investigation; for example, cancer stemness markers provide a better understanding of cancer development and are emerging as promising candidates.Citation5,Citation6
NANOG, named after the Celtic word Tír na nÓg, meaning the land of the young, is a homeobox domain transcription factor, which is a key regulator of embryonic development and cellular reprogramming.Citation7 NANOG-induced cellular reprogramming of somatic cells results in unlimited self-renewal and clonogenic growth, and finally, oncogenic transformation through complex interaction with other stem-cell factors such as octamer-binding transcription factor 4, sex determining region Y-box 2, and Kruppel-like factor 4.Citation7 In addition, NANOG is broadly expressed in a variety of human malignancies, including lung cancer.Citation8–Citation10 Interestingly, evidence suggests that elevated levels of NANOG have been frequently associated with poor clinical outcomes in many human solid cancers.Citation11–Citation13 Moreover, NANOG overexpression was associated with poor survival not only in the early stages of NSCLC treated with surgical resection but also in all lung cancer types regardless of their stages.Citation8–Citation10 However, there has been no published data on the predictive value of NANOG in patients with advanced NSCLC who were treated with cytotoxic chemotherapy.
In this study, we investigated whether NANOG levels are associated with clinical outcomes in NSCLC patients treated with platinum-based chemotherapy to determine the suitability of this stem-cell regulator as a potential predictive marker in this setting.
Materials and methods
Study subjects and data collection
We retrospectively recruited patients with advanced NSCLC who received the platinum-based doublet as the first-line chemotherapy at the Korea University Anam Hospital from August 2009 to July 2011. NANOG expression was measured in formalin-fixed, paraffin-embedded tumor specimens acquired by percutaneous needle or bronchoscopic biopsy. Patients who died within 1 month after the diagnosis, had history of other cancers, and had previously received chemo- or radiotherapy were excluded. A total of 148 patients who received the platinum-based doublet for NSCLC were screened. Among them, 16 cases were excluded due to the unsuitability of the specimens for immunohistochemical (IHC) staining, 14 were excluded due to unavailable survival data, and 6 were excluded according to the exclusion criteria mentioned above. Finally, 112 cases were found to be acceptable for evaluation and were analyzed in this study.
Clinical data were reviewed from the electronic medical record system. Clinical staging was determined using chest computed tomography, brain magnetic resonance imaging, and 18F-fluorodeoxyglucose positron emission tomography based on the 7th lung cancer TNM classification and staging system.Citation14 Response to treatment was examined by computed tomography every two cycles and evaluated according to the Response Evaluation Criteria in Solid Tumors (RECIST) 1.1 as complete response (CR), partial response (PR), stable disease (SD), or progressive disease (PD).Citation15 This study was conducted after obtaining written informed consent from patients. The study protocol was approved by the ethics committee of our institution, the Clinical Research Ethics Committee of the Korea University Anam Hospital.
Quantification of NANOG protein expression
IHC staining was used to evaluate NANOG levels in tumor sections. Four-micron-thick sections from each specimen were stained using a BOND-MAX Immunoautostainer (Leica Biosystems, Newcastle Upon Tyne, UK). Slides were heated at 98°C for 20 minutes and cooled for 10 minutes in Epitope Retrieval Solution 2 and EDTA buffer, respectively. The slides were then washed in distilled water, followed by blocking of endogenous peroxidase activity for 10 minutes. Thereafter, the slides were washed and placed in EDTA buffer, followed by incubation for 15 minutes with 1:200 dilution of NANOG rabbit polyclonal antibody (Cell Signaling Technology, Danvers, MA, USA). Subsequently, the slides were treated with the Bond Polymer Refine Detection Kit (Leica Biosystems) for 15 minutes. Sections were developed with 3,3′-diaminobenzidine chromogenic solution for 7 minutes and counterstained with hematoxylin. Human seminoma tissue was used as positive control, and slides stained without the primary antibody were used as negative control.
IHC evaluation was independently performed by two investigators (SH Lee and CH Kim) without the knowledge of the clinical data. The stained cells were interpreted as positive when nuclear or cytoplasmic staining was identified. Staining intensities of individual cells were graded as 0 (no staining), 1 (weak), 2 (distinct), or 3 (strong), and the percentages of cells with these staining intensities were calculated. Finally, histological scores (H-scores) were calculated by multiplying the staining intensities with the percentages of cells in each staining intensity range (0–300). Slides with discordant assessment were re-evaluated and a consensus was reached.
Statistical analyses
Statistical analyses were performed using the SPSS 18.0 software for Windows (SPSS Inc., Chicago, IL, USA). The cutoff H-score for discriminating between low and high NANOG expression was defined as the point with the lowest p-value on the log-rank test for all possible H-scores. Clinical outcomes were assessed using response rate (RR), progression-free survival (PFS), and overall survival (OS). RR was defined as the percentage of patients with CR and PR among the population. PFS was defined as the time from the first day of chemotherapy to disease progression or death from any cause. OS was defined as the time from the first day of chemotherapy to death from any cause. The correlation between NANOG levels and clinicopathological parameters was analyzed using the chi-square test or Fisher’s exact test. Associations between clinicopathological parameters and survival were evaluated by univariate analysis using the log-rank test. Multivariate survival analysis was performed with adjustment for parameters with p-values <0.3 in the univariate analysis using the Cox hazard regression model. Survival probability was estimated by the Kaplan–Meier method. p-value <0.05 was considered statistically significant.
Results
Patient characteristics
shows the clinical characteristics of the study population. All the subjects were Korean and the median age was 68 years (range, 36–82 years). Thirty-four patients (30%) were female, and 71 patients (63%) were over 65 years of age. Thirty-seven patients (33%) were never smokers. Seventy-nine patients (71%) had Eastern Cooperative Oncology Group performance statuses of 0 or 1, and 23 patients (21%) were in stage IIIB. Forty-eight patients (43%) had squamous cell carcinoma and 29 patients (26%) had moderate to poorly differentiated tumors. EGFR mutational status was analyzed in 20 adenocarcinomas; eight patients (40%) were mutated while 12 patients (60%) were wild-type.
Table 1 The clinical characteristics of patients according to low and high NANOG expression
The drugs combined with platinum for first-line chemotherapy are as follows: gemcitabine (n=49, 44%), pemetrexed (n=37, 33%), paclitaxel (n=15, 13%), and docetaxel (n=11, 10%). The median number of cycles of the treatment was 4 (range, 1–9). Among all patients, 64 (57%) received second-line or further treatment during the follow-up period. They were treated with pemetrexed (n=17, 27%), gemcitabine/vinorelbine (n=16, 25%), gefitinib (n=13, 20%), erlotinib (n=10, 16%), or paclitaxel (n=8, 13%) as second-line treatment. Twenty-nine patients received further chemotherapy using gemcitabine/vinorelbine (n=12, 41%), gefitinib (n=8, 28%), pemetrexed (n=6, 21%), or paclitaxel (n=3, 10%).
NANOG expression
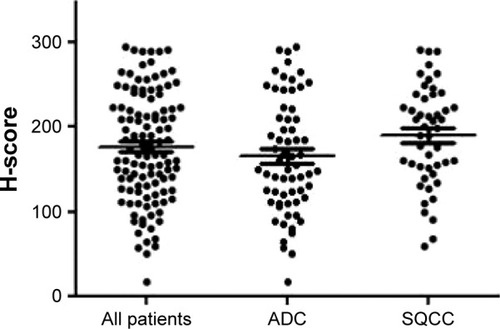
Representative sections with different H-scores are shown in . NANOG was mainly localized in the cytoplasm of cancer cells and a few were detected in the nucleus, which is consistent with previous studies.Citation8–Citation10 The H-scores of all patients were normally distributed with a median of 178.3 (range, 24–298). Median H-scores of the patients with adenocarcinoma and those with squamous cell carcinoma were 167.1 (range, 24–298) and 189.4 (range, 46–292), respectively. Median H-scores was not significantly different among three groups. Distribution of H-scores according to each group is presented in .
Figure 1 Representative immunohistochemical staining sections for NANOG with different histologic scores (H-scores) (×200).
Abbreviations: ADC, adenocarcinoma; SQCC, squamous cell carcinoma.
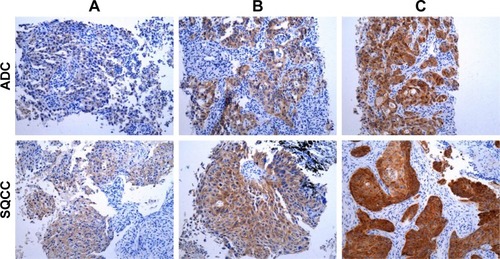
Figure 2 Distribution of H-scores.
Abbreviations: ADC, adenocarcinoma; SQCC, squamous cell carcinoma.
Association between NANOG levels and clinicopathological parameters
To distinguish between low and high NANOG levels, the optimal cutoff H-score was determined as 180. With this cutoff, 68 (60%) and 44 (40%) patients were allocated to the low and high NANOG group, respectively.
To evaluate whether NANOG levels are associated with clinicopathological parameters, we compared the proportion of patients with low and high NANOG levels in different patient groups. However, there was no difference in the proportion of patients with low and high NANOG levels in any patient group (). This indicates that clinicopathological parameters, including age, gender, smoking status, performance status, stage, tumor differentiation, or histological subtype, were not associated with NANOG levels.
Association between NANOG levels and response to treatment
Fifty-one patients (45%) showed PR, 25 (22%) showed SD, and 36 (33%) showed PD. Thus, the overall RR was 45%. Twelve (27%) and 29 (43%) patients showed PR in the high and low NANOG groups, respectively. Thus, the RR in the high NANOG group was significantly lower compared to that in the low NANOG group (p=0.03). Clinicopathological parameters such as young age, never smoking, well-differentiated tumor, and good performance showed a trend toward better response to treatment, but were not statistically significant.
Association between NANOG levels and PFS
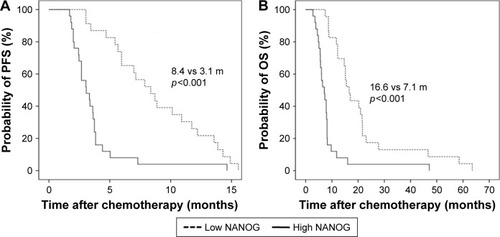
Survival analyses results according to the clinicopathological parameters are summarized in . The median PFS for the overall population was 6.5 months (95% confidence interval [CI]: 2.4–11.4 months). Univariate analysis showed that advanced tumor stage and squamous histology were associated with shorter PFS. In addition, high NANOG levels were significantly associated with shorter PFS (8.1 versus 3.6 months, p<0.001). In the multivariate analysis, advanced stage (hazard ratio [HR] =2.06, 95% CI: 1.23–3.48), squamous histology (HR =2.10, 95% CI: 1.31–3.37), and high NANOG levels (HR =3.09, 95% CI: 2.01–4.76) were significantly associated with shorter PFS. The Kaplan–Meier survival curves also showed that patients with high NANOG were likely to have shorter PFS ().
Figure 3 Kaplan–Meier survival curves for progression-free survival (A) and overall survival (B) in all patients. p-values were determined using the log-rank test.
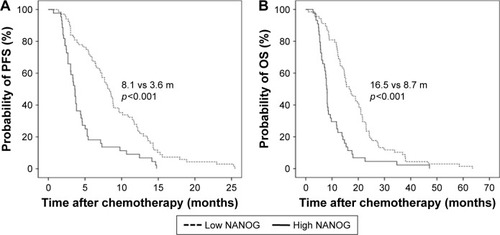
Table 2 Survival analyses results according to clinical parameters in all study subjects
Association between NANOG levels and OS
The median OS for all study subjects was 12.8 months (95% CI: 8.9–15.8 months). Univariate analysis revealed that poor performance status and advanced stage were significantly associated with shorter OS. High NANOG levels were also significantly associated with shorter OS (16.5 versus 8.7 months, p<0.001). Multivariate analysis showed that old age (HR =1.18, 95% CI: 1.06–2.14), poor performance status (HR =2.42, 95% CI: 1.47–3.99), advanced stage (HR =1.84, 95% CI: 1.16–3.10), and high NANOG levels (HR =3.00, 95% CI: 1.98–4.54) were significantly associated with shorter OS. The Kaplan–Meier survival curves also showed that patients with high NANOG levels were likely to have shorter OS ().
Subgroup analyses according to tumor histology
We further performed survival analyses according to histopathological subtypes. In patients with adenocarcinoma, the median PFS was 7.7 months (95% CI: 4.5–11.2 months). Male gender, advanced stage, and high levels of NANOG were significantly associated with shorter PFS in univariate analysis. Multivariate analysis showed that high levels of NANOG were associated with shorter PFS (HR =2.53, 95% CI: 1.35–4.75). In terms of OS, the median survival was 14.6 months (95% CI: 11.5–17.8 months). Old age, poor performance, advanced stage, and high NANOG levels were significantly associated with shorter OS in univariate analysis. In the multivariate analysis, poor performance (HR =2.75, 95% CI: 1.47–5.13), advanced stage (HR =1.78, 95% CI: 1.16–3.79), and high NANOG expression (HR =3.04, 95% CI: 1.56–5.93) were significantly associated with shorter OS.
In patients with squamous cell carcinoma, the median PFS was 5.4 months (95% CI: 2.6–7.0 months). Advanced stage and high levels of NANOG were associated with shorter PFS in univariate analysis. In multivariate analysis, high NANOG levels were significantly associated with shorter PFS (HR =3.76, 95% CI: 2.39–9.48). In terms of OS, the median survival was 9.8 months (95% CI: 6.9–12.5 months). Poor performance and high NANOG levels were associated with shorter OS in univariate analysis. In multivariate analysis, poor performance (HR =1.62, 95% CI: 1.11–2.27) and high NANOG levels (HR =3.64, 95% CI: 2.20–8.14) were significantly associated with shorter OS. The Kaplan–Meier survival curves also showed that patients with high NANOG levels were likely to have shorter PFS and OS in both the histological subtypes ( and ).
Figure 4 Kaplan–Meier survival curves for progression-free survival (A) and overall survival (B) in patients with adenocarcinoma. p-values were determined using the log-rank test.
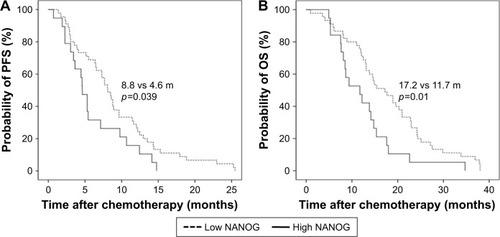
Figure 5 Kaplan–Meier survival curves for progression-free survival (A) and overall survival (B) in patients with squamous cell carcinoma. p-values were determined using the log-rank test.
Discussion
The current data demonstrate that NANOG overexpression is significantly associated with poor PFS and OS in patients with advanced NSCLC who received platinum-based chemotherapy as the first-line treatment. Subgroup analysis shows that the results are similar regardless of the histological subtypes. To the best of our knowledge, this is the first study demonstrating the association between NANOG expression and clinical outcomes of patients with NSCLC who were treated with platinum-based chemotherapy, which implicates its clinical usefulness as a potential predictive marker.
Functional studies have shown that NANOG plays a pivotal role in the steps of cancer development and progression including clonogenic growth, tumorigenicity, and invasiveness.Citation16–Citation18 In addition, overexpression of NANOG is associated with tumor metastasis via enhancement of epithelial mesenchymal transition in lung cancer cells.Citation19 Importantly, studies suggested that NANOG might be associated with chemoresistance in lung cancer. Liu et al showed that platinum treatment induced an increase in the number of lung cancer cells expressing stem cell markers such as NANOG.Citation20 Moreover, Barr et al reported that increased expression of NANOG along with other stem-cell regulators was associated with cisplatin resistance in lung cancer cells.Citation21 Our results support those findings.
NANOG seems to be involved in immunomodulation which is an important mechanism of cancer development and resistance to treatment.Citation22 Noh et al demonstrated that NANOG enhances the stem-like features of tumor cells and protected them from the immune surveillance system.Citation23 In addition, Hasmim et al reported that hypoxia-induced NANOG is involved in the intratumoral infiltration of regulatory T cells and macrophages in part by modulating transforming growth factor-β1 production.Citation24 Those suggest that NANOG might be involved in the immune escape mechanism of tumors and that high NANOG levels could be associated with poor response to treatment using immune checkpoint inhibitors. Taken together, our data and the findings regarding the immunomodulating effect of NANOG may provide a foundation for future studies investigating the clinical usefulness of NANOG as a novel predictive marker in other clinical settings such as immuno-oncology.
In the present study, we found that NANOG levels did not differ between adenocarcinoma and squamous cell carcinoma. In addition, the association between NANOG expression and clinical outcomes was similar regardless of tumor histology. Of note, a previous study reported that lung adenocarcinoma was more associated with certain stem-like signatures compared to squamous cell carcinoma.Citation25 In addition, Park et al investigated the prognostic significance of several stem cell markers in early staged NSCLC and reported that NANOG overexpression was an independent factor associated with a poor prognosis in adenocarcinoma while it had no prognostic value in squamous cell carcinoma.Citation9 While we cannot exactly explain this discrepancy, we cautiously assume that the role or extent of NANOG’s contribution in the treatment resistance of advanced lung cancer may be different from that in tumor progression of early staged disease. Consistent positive association between NANOG and chemoresistance in different tumor cells including breast, pancreatic, ovarian, and head and neck cancer cells may support our hypothesis of universal role of NANOG in the treatment resistance regardless of histologic subtypes.Citation13,Citation26–Citation28 Further experiments are required to understand the differences in the clinical implications of NANOG in different cell types of lung cancer.
There are several limitations in this study. First, this study was performed retrospectively and included a relatively small sample size. Second, for the quantification of NANOG levels, we used IHC staining, which may be less sensitive than other methods. Although previous studies quantified NANOG protein or mRNA levels,Citation8–Citation10 a standard method of quantification for NANOG expression has not been established. Third, EGFR mutation data were available in only a small proportion of the subjects. As a result, information regarding the association between EGFR status and NANOG expression could be limited. Further studies are required to investigate the possible role of NANOG in patients harboring driving mutations.
Conclusion
In conclusion, we have shown that NANOG may be an adverse predictive marker in NSCLC patients who were treated with platinum-based chemotherapy. Further large-scale prospective studies involving patients without driving mutations treated with chemotherapy and using various quantification methods would provide more practical data. In addition, our results prompt the evaluation of this stem-cell regulator as a novel biomarker in different clinical settings, including molecular targeted therapy and immunotherapy, which would contribute a customized approach.
Acknowledgments
This work was supported by a grant from Kyung Hee University in 2016 (KHU-20160540).
Disclosure
The authors report no conflicts of interest in this work.
References
- SiegelRLMillerKDJemalACancer statistics, 2015CA Cancer J Clin201565152925559415
- MillerVARielyGJZakowskiMFMolecular characteristics of bronchioloalveolar carcinoma and adenocarcinoma, bronchioloalveolar carcinoma subtype, predict response to erlotinibJ Clin Oncol20082691472147818349398
- RobertsPJStinchcombeTEKRAS mutation: should we test for it, and does it matter?J Clin Oncol20133181112112123401440
- CoboMIslaDMassutiBCustomizing cisplatin based on quantitative excision repair cross-complementing 1 mRNA expression: a phase III trial in non-small-cell lung cancerJ Clin Oncol200725192747275417602080
- SodjaERijavecMKorenASadikovAKorošecPCuferTThe prognostic value of whole blood SOX2, NANOG and OCT4 mRNA expression in advanced small-cell lung cancerRadiol Oncol201650218819627247551
- SureshRAliSAhmadAPhilipPASarkarFHThe role of cancer stem cells in recurrent and drug-resistant lung cancerAdv Exp Med Biol2016890577426703799
- JeterCRYangTWangJChaoHPTangDGConcise review: NANOG in cancer stem cells and tumor development: an update and outstanding questionsStem Cells20153382381239025821200
- LiXQYangXLZhangGNuclear beta-catenin accumulation is associated with increased expression of Nanog protein and predicts poor prognosis of non-small cell lung cancerJ Transl Med20131111423648139
- ParkEParkSYSunPLPrognostic significance of stem cell-related marker expression and its correlation with histologic subtypes in lung adenocarcinomaOncotarget2016727425024251227285762
- DuYMaCWangZLiuZLiuHWangTNanog, a novel prognostic marker for lung cancerSurg Oncol201322422422924018162
- YinXLiYWZhangBHCoexpression of stemness factors Oct4 and Nanog predict liver resectionAnn Surg Oncol20121992877288722461131
- MengHMZhengPWangXYOver-expression of Nanog predicts tumor progression and poor prognosis in colorectal cancerCancer Biol Ther20109429530220026903
- LuYZhuHShanHKnockdown of Oct4 and Nanog expression inhibits the stemness of pancreatic cancer cellsCancer Lett2013340111312323872274
- GoldstrawPThe 7th edition of TNM in lung cancer: what now?J Thorac Oncol20094667167319461399
- EisenhauerEATherassePBogaertsJNew response evaluation criteria in solid tumours: revised RECIST guideline (version 1.1)Eur J Cancer200945222824719097774
- LiuYClemBZuba-SurmaEKMouse fibroblasts lacking RB1 function form spheres and undergo reprogramming to a cancer stem cell phenotypeCell Stem Cell20094433634719341623
- LinYLHanZBXiongFYMalignant transformation of 293 cells induced by ectopic expression of human NanogMol Cell Biochem20113511–210911621246261
- JiWJiangZEffect of shRNA-mediated inhibition of Nanog gene expression on the behavior of human gastric cancer cellsOncol Lett20136236737424137331
- ChiouSHWangMLChouYTCoexpression of Oct4 and Nanog enhances malignancy in lung adenocarcinoma by inducing cancer stem cell-like properties and epithelial-mesenchymal transdifferentiationCancer Res20107024104331044421159654
- LiuYPYangCJHuangMSCisplatin selects for multidrug-resistant CD133+ cells in lung adenocarcinoma by activating Notch signalingCancer Res201373140641623135908
- BarrMPGraySGHoffmannACGeneration and characterisation of cisplatin-resistant non-small cell lung cancer cell lines displaying a stem-like signaturePLoS One201381e5419323349823
- SmythMJDunnGPSchreiberRDCancer immunosurveillance and immunoediting: the roles of immunity in suppressing tumor development and shaping tumor immunogenicityAdv Immunol20069015016730260
- NohKHLeeYHJeonJHCancer vaccination drives Nanog-dependent evolution of tumor cells toward an immune-resistant and stem-like phenotypeCancer Res20127271717172722337995
- HasmimMNomanMZMessaiYCutting edge: Hypoxia-induced Nanog favors the intratumoral infiltration of regulatory T cells and macrophages via direct regulation of TGF-beta1J Immunol2013191125802580624227785
- HassanKAChenGKalemkerianGPWichaMSBeerDGAn embryonic stem cell-like signature identifies poorly differentiated lung adenocarcinoma but not squamous cell carcinomaClin Cancer Res200915206386639019808871
- FuTYHsiehICChengJTAssociation of OCT4, SOX2, and NANOG expression with oral squamous cell carcinoma progressionJ Oral Pathol Med2016452899526211876
- WiechertASayginCThiagarajanPSCisplatin induces stemness in ovarian cancerOncotarget2016721305113052227105520
- BourguignonLYPeyrollierKXiaWGiladEHyaluronan-CD44 interaction activates stem cell marker Nanog, Stat-3-mediated MDR1 gene expression, and ankyrin-regulated multidrug efflux in breast and ovarian tumor cellsJ Biol Chem200828325176351765118441325