
Abstract
Background
Molecular analysis is a promising source of clinically useful prognostic biomarkers. The aim of this investigation was to identify prognostic biomarkers for patients with acute myeloid leukemia (AML) by using the gene expression profile dataset from public database.
Methods
The gene expression profile dataset and corresponding overall survival (OS) information of three cohorts of AML patients from GSE12417 and The Cancer Genome Atlas AML project (TCGA-LAML) were included in the present study. Prognostic gene screening was performed by using a survival package, whereas time-dependent receiver operating characteristic (ROC) curve analysis was performed using the survivalROC package.
Results
In the three cohorts, 11 genes were identified that were significantly associated with AML OS. A linear prognostic model of the 11 genes was constructed and weighted by regression coefficient (β) from the multivariate Cox regression analyses of GSE12417 HG-U133A cohort to divide patients into high- and low-risk groups. GSE12417 HG-U133 plus 2.0 and TCGA-LAML were validation cohorts. Patients assigned to the high-risk group exhibited poor OS compared to patients in the low-risk group. The 11-gene signature is a prognostic marker of AML and demonstrates good performance for predicting 1-, 3-, and 5-year OS as evaluated by survivalROC in the three cohorts.
Conclusion
Our study has identified an mRNA signature including 11 genes, which may serve as a potential prognostic marker of AML.
Introduction
Acute myeloid leukemia (AML), a heterogeneous clonal disorder of hemopoietic progenitor cells, is the most common myeloid leukemia with a poor prognosis. The 5-year overall survival (OS) of AML is <50%, and for patients older than 60 years, OS is <20%.Citation1,Citation2 Numerous factors that affect the prognosis of AML have been identified, including age, the number of white blood cells in peripheral blood, lactic dehydrogenase levels before chemotherapy, and cytogenetic changes.Citation3,Citation4 The treatment strategy of AML can be individualized according to cytogenetic characteristics, thus prolonging the patient’s remission and survival.Citation2,Citation4 Genetic defects are considered the most important factors in determining the effect of chemotherapy and outcome.Citation2,Citation5 Prognostic factors of AML can be divided into patient- and disease-associated factors. Molecular genetic lesions, a disease-associated factor, have become an active research area for the investigation of prognostic and predictive markers.Citation4 Gene expression profiling in AML has already been proven to be valuable in the diagnosis of different cytogenetic subtypes, discovering novel AML subclasses, and prognostic prediction.Citation6 Molecular analysis is a promising source of clinically useful prognostic biomarkers. The aim of this investigation was to identify prognostic biomarkers for patients with AML by using a gene expression profile dataset from the public database and constructing a gene signature for AML prognostic prediction.
Methods
Data source and preprocessing
The discovery and validation gene mRNA expression profile datasets were obtained from Gene Expression Omnibus (https://www.ncbi.nlm.nih.gov/geo/) and The Cancer Genome Atlas (TCGA; https://tcga-data.nci.nih.gov/), so, this article does not contain any studies with human participants or animals performed by any of the authors of the present study. The inclusion criteria of cohorts were as follows: 1) whole genome mRNA expression profile dataset, 2) sample of tissue was bone marrow, and 3) the patient’s survival information can be available. By searching the public expression profile database, we found that only the AML patients of the GSE12417 (https://www.ncbi.nlm.nih.gov/geo/query/acc.cgi?acc=GSE12417) and TCGA AML project (TCGA-LAML) cohorts were suitable for the requirements of this study.Citation7,Citation8 The bone marrow expression profile dataset of AML patients with complete survival data available was included in the present study. The raw dataset of RNA sequencing was normalized by the DESeq package in the R platform, whereas the expression chip dataset was normalized by the limma package.Citation9,Citation10 For multiple probe sets, the average value corresponding to the same gene was regarded as the gene’s expression value.Citation11 The gene expression level of the TCGA-LAML cohort was log2-transformed for further analysis.
Identification of prognostic gene markers
Survival analyses were conducted on patients with normalized mRNA expression and OS profiles. Patients were divided into low- and high-expression groups according to the gene’s median expression value. Univariate Cox proportional hazards regression analysis was applied to estimate survival in the study sample by using a survival package in the R platform, and the low expression group was set as the reference group. A cutoff P-value of 0.05 was considered statistically significant and used to identify prognostic gene markers.
Construction and validation of the prognostic gene signature
The intersection of the three cohorts’ prognostic gene markers was used to construct the survival predictive model. These prognostic gene markers from the GSE12417 HG-U133A cohort were fitted in a multivariate Cox regression model with OS as a dependent variable to measure the relative contributions for survival prediction. A prognosis risk score was established on the basis of a linear combination of these gene expression levels multiplied by a regression coefficient (β) derived from the multivariate Cox proportional hazards regression model of each gene with the following formula: risk score = expression of gene1 × β1gene1 + expression of gene2 × β2gene2 + … expression of genen × βngenen.Citation11,Citation12 Then, another two independent cohorts of AML patients from GSE12417 HG-U133 plus 2.0 and TCGA-LAML were used for the prognostic signature validation. The AML patients were divided into low- and high-risk groups according to the median value of the prognostic risk score. The time-dependent receiver operating characteristic (ROC) curve analysis was performed using the survivalROC package in the R platform to evaluate the predictive accuracy of the prognostic signature for time-dependent cancer death.Citation13
Statistical analysis
Univariate Cox proportional hazards regression model was used for calculating the clinical outcome between different gene expression groups. Hazard ratio (HR) and 95% confidence interval (CI) were calculated from the univariate Cox proportional hazards regression model. A survival curve was carried out using the Kaplan–Meier method with the log-rank test. A value of P<0.05 was considered statistically significant. All the statistical analyses were conducted with SPSS Version 20.0 (IBM Corporation, Armonk, NY, USA) and R 3.3.0.
Results
Study population
By performed the inclusion criteria, GSE12417 HG-U133A, GSE12417 HG-U133 plus 2.0 chip, and TCGA-LAML cohorts were included into the present study. In order to ensure consistency in the patients enrolled, we excluded two AML patients with peripheral blood expression profile datasets from the GSE12417 HG-U133A cohort and five from the GSE12417 HG-U133 plus 2.0 chip cohort. One myelodysplastic syndrome patient was excluded from the GSE12417 HG-U133A cohort and one was excluded from the GSE12417 HG-U133 plus 2.0 cohort. A total of 160 patients from the GSE12417 HG-U133A cohort and 79 patients from the GSE12417 HG-U133 plus 2.0 cohort were included in the current study. In addition, we excluded 11 patients without clinical data from the TCGA-LAML cohort and, then, a total of 140 AML patients were used for further analysis. All of these three cohorts were whole-genome mRNA expression profile dataset, and the sample of tissue was bone marrow. In addition, the OS time information of AML can be used for survival analysis.
Prognostic gene marker screening
Genome-wide survival analysis was performed by the survival package in the R platform, and low gene expression was set as the reference group. The HR and 95% CI were used to assess the risk of death in the high-expression group relative to the low-expression group and were calculated by the univariate Cox proportional hazards regression model. A total of 1,259 genes were identified as prognostic gene markers in the GSE12417 HG-U133A cohort; of these, there were 562 genes with a HR of <1 and 697 genes with a HR of >1 (Table S1). We also identified 1,234 genes as prognostic gene markers in the GSE12417 HG-U133 plus 2.0 and 5,238 genes in the TCGA-LAML cohort. Among these genes, there were 728 genes with a HR of <1 and 506 genes with a HR of >1 in the GSE12417 HG-U133 plus 2.0 cohort (Table S2), whereas there were 2,886 genes with a HR of <1 and 2,352 genes with a HR of >1 in the TCGA-LAML cohort (Table S3).
Prognostic gene signature construction and validation
The intersection of the three cohorts’ prognostic gene markers included the following 11 genes ( and ): acyl-CoA synthetase family member 2 (ACSF2), C-X-C motif chemokine receptor 6 (CXCR6), family with sequence similarity 124 member B (FAM124B), FRY like transcription coactivator (FRYL), glycophorin A (GYPA), hemoglobin subunit gamma 1 (HBG1), mago homolog, exon junction complex core component (MAGOH), malate dehydrogenase 2 (MDH2), solute carrier family 2 member 5 (SLC2A5), succinate-CoA ligase alpha subunit (SUCLG1), and transmembrane channel like 5 (TMC5). Among these 11 genes, five genes were identified as protective prognostic genes (HR <1; CXCR6, FRYL, GYPA, HBG1, and TMC5; and ), whereas the remaining six genes were identified as risky prognostic genes (HR >1; ACSF2, FAM124B, MAGOH, MDH2, SLC2A5, and SUCLG1; and ). Survival curves for these genes in the three cohorts are shown in , , and . The predictive model was identified in the GSE12417 HG-U133A cohort with the following formula: risk score = expression of ACSF2 × (0.438) + expression of CXCR6 × (−0.077) + expression of FAM124B × (0.295) + expression of FRYL × (−0.391) + expression of GYPA × (−0.289) + expression of HBG1 × (−0.072) + expression of MAGOH × (0.387) + expression of MDH2 × (−0.106) + expression of SLC2A5 × (0.329) + expression of SUCLG1 × (0.221) + expression of TMC5 × (−0.35). The risk score for each patient was calculated according to the aforementioned formula, and then, the median value of the risk score was used as a cutoff to create a high- or low-risk group. The risk score result of the GSE12417 HG-U133A cohort is shown in . Survival analysis demonstrated that patients with a high-risk score had an increased risk of death compared to the low-risk group (log-rank P=0.0004, HR =2.03, 95% CI =1.359–3.032, ). The prognostic signature in the GSE12417 HG-U133A cohort showed a good performance in the prediction of clinical outcome, as the area under the ROC curve (AUC) was 0.729, 0.722, and 0.703 for 1-, 3-, and 5-year survivals (), respectively.
Figure 1 Venn diagram of prognostic gene markers for the three gene expression microarray data cohorts (TCGA-LAML, GSE12417 HG-U133A, and HG-U133 plus 2.0 cohorts).
Abbreviations: HR, hazard ratio; TCGA-LAML, The Cancer Genome Atlas AML project.
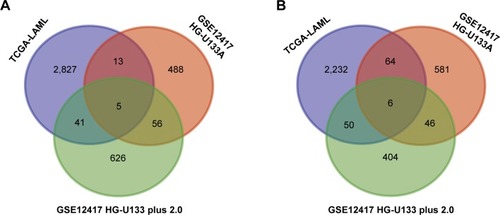
Figure 2 The prognostic value of the 11 genes for AML patients in the GSE12417 HG-U133A cohort.
Abbreviations: ACSF2, acyl-CoA synthetase family member 2; AML, acute myeloid leukemia; CXCR6, C-X-C motif chemokine receptor 6; FAM124B, family with sequence similarity 124 member B; FRYL, FRY-like transcription coactivator; GYPA, glycophorin A; HBG1, hemoglobin subunit gamma 1; MAGOH, mago homolog, exon junction complex core component; MDH2, malate dehydrogenase 2; OS, overall survival; SLC2A5, solute carrier family 2 member 5; SUCLG1, succinate-CoA ligase alpha subunit; TMC5, transmembrane channel like 5.
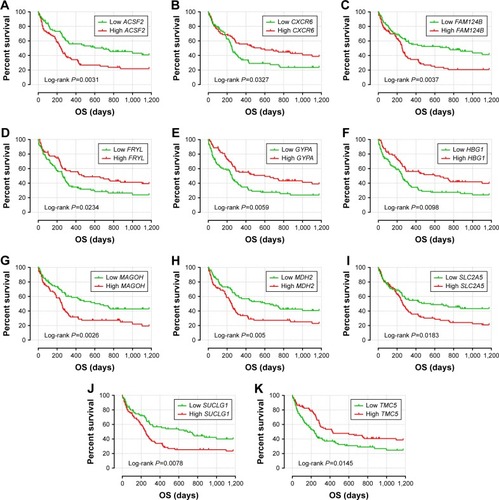
Figure 3 The prognostic value of the 11 genes for AML patients in the GSE12417 HG-U133 plus 2.0 cohort.
Abbreviations: ACSF2, acyl-CoA synthetase family member 2; AML, acute myeloid leukemia; CXCR6, C-X-C motif chemokine receptor 6; FAM124B, family with sequence similarity 124 member B; FRYL, FRY-like transcription coactivator; GYPA, glycophorin A; HBG1, hemoglobin subunit gamma 1; MAGOH, mago homolog, exon junction complex core component; MDH2, malate dehydrogenase 2; OS, overall survival; SLC2A5, solute carrier family 2 member 5; SUCLG1, succinate-CoA ligase alpha subunit; TMC5, transmembrane channel like 5.
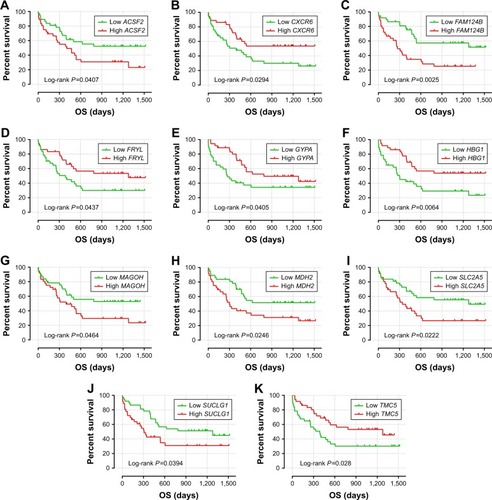
Figure 4 The prognostic value of the 11 genes for AML patients in the TCGA-LAML cohort.
Abbreviations: ACSF2, acyl-CoA synthetase family member 2; AML, acute myeloid leukemia; CXCR6, C-X-C motif chemokine receptor 6; FAM124B, family with sequence similarity 124 member B; FRYL, FRY-like transcription coactivator; GYPA, glycophorin A; HBG1, hemoglobin subunit gamma 1; MAGOH, mago homolog, exon junction complex core component; MDH2, malate dehydrogenase 2; OS, overall survival; SLC2A5, solute carrier family 2 member 5; SUCLG1, succinate-CoA ligase alpha subunit; TMC5, transmembrane channel like 5; TCGA-LAML, The Cancer Genome Atlas AML project.
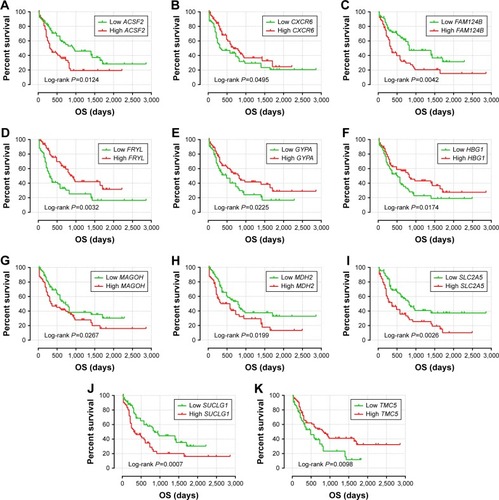
Figure 5 Prognostic gene signature of the 11 genes in AML patients of the GSE12417 HG-U133A cohort.
Abbreviations: AML, acute myeloid leukemia; AUC, area under the ROC curve; CI, confidence interval; OS, overall survival; ROC, receiver operating characteristic.
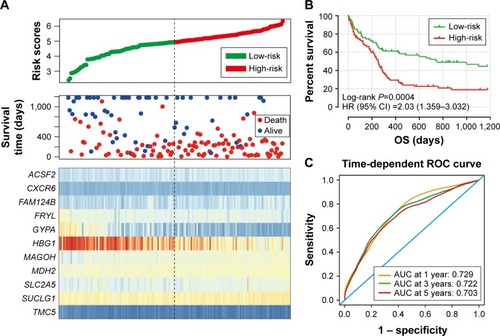
Table 1 Prognostic value of the 11 genes in AML patients of the three cohorts
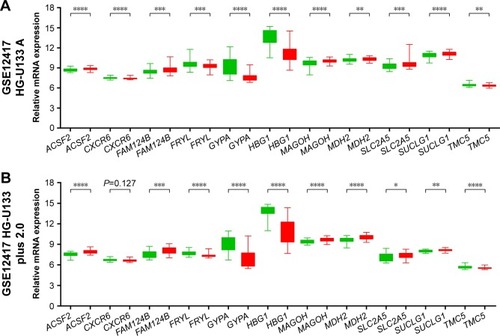
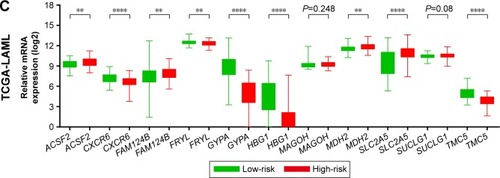
To evaluate the power of the prognostic risk score model for patients’ survival prediction, the prognostic signature and cutoff point derived from the GSE12417 HG-U133A cohort were applied to the AML patients in the GSE12417 HG-U133 plus 2.0 and TCGA-LAML cohorts as an independent validation. The results of these two cohorts are shown in and , respectively. The prognostic signature in the GSE12417 HG-U133 plus 2.0 cohort (log-rank P=0.0019, HR =2.59, 95% CI =1.389–4.828, ) and TCGA-LAML cohort (log-rank P<0.0001, HR =2.448, 95% CI =1.579–3.795, ) also shows a good performance in survival prediction; the result of the Kaplan–Meier analysis showed a significant difference in patients’ OS between the high-risk and low-risk groups. The predictive accuracy of this prognostic model in the GSE12417 HG-U133 plus 2.0 cohort reported that the AUC of the ROC curve was 0.782, 0.697, and 0.662 for 1-, 3-, and 5-year survivals (), respectively. The AUC of the ROC curve for the TCGA-LAML cohort was 0.666, 0.713, and 0.707 for 1-, 3-, and 5-year survivals (), respectively. The expression level distribution of the 11 genes in the low- and high-risk groups of the three cohorts is presented in .
Figure 6 Prognostic gene signature of the 11 genes in AML patients of GSE12417 HG-U133 plus 2.0 cohort.
Abbreviations: AUC, area under the ROC curve; AML, acute myeloid leukemia; CI, confidence interval; OS, overall survival; ROC, receiver operating characteristic.
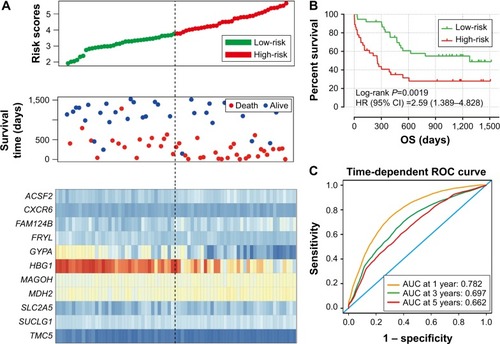
Figure 7 Prognostic gene signature of the 11 genes in AML patients of the TCGA-LAML cohort.
Abbreviations: AML, acute myeloid leukemia; AUC, area under the ROC curve; CI, confidence interval; OS, overall survival; ROC, receiver operating characteristic; TCGA-LAML, The Cancer Genome Atlas AML project.
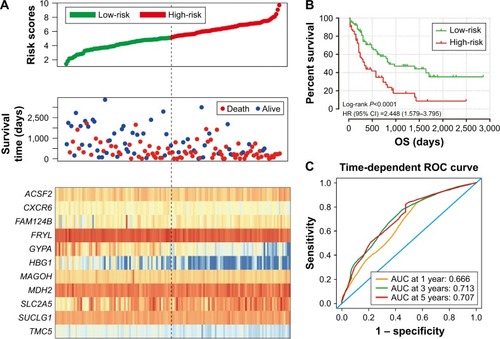
Figure 8 The expression level distribution of the 11 genes in the low- and high-risk groups.
Abbreviation: TCGA-LAML, The Cancer Genome Atlas AML project.
Discussion
Whole genome molecular analysis is a promising source of clinically useful prognostic biomarkers in AML. The prognosis of AML is partly driven by genetic factors, and a combination of multiple genes contributes to the improvement of prognostic predictive accuracy. In the present study, we extract the AML gene expression profile dataset and corresponding survival information from GSE12417 and TCGA for whole genome survival analysis. We identified 11 genes associated with AML prognosis and constructed and validated a prognostic signature composed of the 11 genes. An assessment by time-dependent ROC curve analysis demonstrated that the prognostic signature of the 11 genes showed a good performance for predicting 1-, 3-, and 5-year OS of AML patients in the three cohorts.
The prognostic value of the five protective genes (CXCR6, FRYL, GYPA, HBG1, and TMC5) expressed in AML has not been identified in previous studies. CXCR6, one of the protective prognostic genes, is involved in signaling by a G-protein-coupled receptor and peptide ligand-binding receptor pathways, and GO annotations related to this gene include G-protein-coupled receptor activity and C-X-C chemokine receptor activity. The blockade of CXCR6 expression represses cell proliferation and invasion of hepatocellular carcinoma (HCC) cells,Citation14,Citation15 gastric cancer cells,Citation16 and prostate cancer.Citation17 CXCR6 is overexpressed in many cancer cells and significantly increased in HCC tumor tissue,Citation14 prostate cancer,Citation17–Citation19 gastric cancer,Citation20 epithelial ovarian carcinoma,Citation21 and non-small-cell lung cancerCitation22 compared to nontumor tissues. Previous studies also demonstrate that CXCR6 expression is involved in the metastasis of various types of cancer,Citation18,Citation21 and high CXCR6 expression significantly increased the risk of death in patients with prostate cancer,Citation19 gastric cancer,Citation20 and Ewing’s sarcoma.Citation23 In contrast with these results, in the current study, high CXCR6 expression shows a decreased risk of death in patients with AML. Therefore, our results still need to be validated in future studies.
A study by Hayette et alCitation24 indicated that FRYL fragment fused to mixed lineage leukemia (MLL) may contribute to the oncogenic activation of MLL, whereas Robinson et alCitation25 reported that MLL-FRYL increases cell proliferation without an obvious effect on differentiation. A case report also showed that t(4;11)(p12;q23) with MLL and FRYL involvement represents a new recurring 11q23 translocation in therapy-related AML.Citation26 Another protective prognostic gene, GYPA, is the most abundant erythrocyte surface sialoglycoprotein and bears the antigenic determinant for the MNS blood group and has high expression in normal human bone marrow (GenAtlas: http://www.genatlas.org/).Citation27 The CC genotype of GYPA-rs2202507 confers a protective effect in lung cancer genetic susceptibility.Citation28 However, any function of HBG1 and TMC5, the remaining two protective genes, involved in cancer or leukemia has seldom been reported. HBG1 is normally expressed in bone marrow and is involved in fetal hemoglobin constitution, as well as being related to thalassemia.Citation29,Citation30 A study by Kurima et alCitation31 through the genomic sequence analysis of TMC genes demonstrated that TMC5 may play a role in hearing loss and autosomal dominant medullary cystic kidney disease 2. Our study is the first to report the expression of these genes in AML prognosis. Further studies are necessary to validate our findings.
The prognostic value of the six risk-related prognostic genes (ACSF2, FAM124B, MAGOH, MDH2, SLC2A5, and SUCLG1) also has not been identified in patients with AML. Work by Zhao et alCitation32 through an RWCFusion method demonstrated that MED1–ACSF2 could be a potential driver gene fusion of breast cancer. A co-immunoprecipitation study by Batsukh et alCitation33 identified that FAM124B may serve as a potential interaction partner of CHD7 and CHD8 and may be involved in the pathogenesis of CHARGE syndrome and neurodevelopmental disorders. Studies by Zhao et alCitation34,Citation35 observed that rapidly proliferating cells show a higher MAGOH mRNA expression level than these in normal tissues and concluded that mRNA expression of MAGOH correlated with cell cycle progression, cell proliferation, and germ plasm assembly in a NIH3T3 cell line. MDH2 encodes a Krebs cycle enzyme, mitochondrial malate dehydrogenase (MDH), which is important in the conversion of malate to oxaloacetate and to keep the proper functioning of the Krebs cycle. Disruption of the Krebs cycle is a hallmark of cancer. Recently, a whole-exome sequencing study on multiple malignant paragangliomas tumor tissue identified that MDH2 was associated with paraganglioma development and susceptibility.Citation36 Previous studies also indicated that MDH2 was involved in prostate and uterine cancer chemotherapy resistance.Citation37,Citation38 There was a marked upregulation of MDH2 expression in prostate tumor tissue, and knockdown of MDH2 in prostate cancer cell lines significantly inhibited cell proliferation and increased the sensitivity of docetaxel.Citation37 A study by Liu et alCitation37 also observed that overexpression of MDH2 significantly increased the risk of prostate cancer recurrence after receiving neoadjuvant chemotherapy. Similarly, our data also observed that high expression of MDH2 significantly increased the risk of death in AML patients.
The protein encoded by SLC2A5 is a transporter of fructose uptake in the small intestine and is a key gene in the fatty acid synthase pathway. Research by Medina et alCitation39 has investigated the role of SLC2A5 in renal cell carcinomas (RCC) and observed that the expression of SLC2A5 was significantly higher in tumor tissue and correlated with an advanced stage. Their findings suggest that either increased usage of fructose or the presence of high SLC2A5 expression may lead to malignant RCC progression.Citation39 Different from in RCC, expression of SLC2A5 can be detected by immunocytochemistry in benign prostate tissue and high-grade intraepithelial neoplasia but not in prostate cancer tissue. In addition, the intensity of SLC2A5 immunostaining was negatively correlated with the malignant transformation of prostate cancer.Citation40
SUCLG1 encodes the alpha subunit of the heterodimeric enzyme succinate coenzyme A ligase, and its mutation is associated with methylmalonic aciduria, as well as leading to the poor survival of these patients.Citation41–Citation43 The prognostic value of SUCLG1 in cancer or leukemia has not been reported in previous studies.
There were some limitations to our study that need to be recognized. The major limitation involves the lack of available information regarding chemotherapy and other prognostic factors of AML, so, the prognostic genes of AML were based on an univariate survival analysis instead of the multivariate analysis. Such information is required to further study the interaction between this mRNA signature and other AML prognosis risk factors. Second, the information of complete remission and relapse-free survival time was not available in the public database, so, we only analysed the association between gene expression level and AML OS. Third, due to the small sample size of GSE12417 HG-U133 plus 2.0 cohort, many genes that were significant in the TCGA-LAML and GSE12417 HG-U133A cohort did not reach statistical significance in the GSE12417 HG-U133 plus 2.0 cohort, which may have resulted in filtering out some potential prognostic genes.
Despite these limitations, our findings provide insight into these genes in AML clinical outcomes and may have clinical utility for prognosis prediction and target treatment strategies.
Conclusion
By analyzing the genome-wide mRNA expression profiles in a large cohort from GSE12417 and TCGA-LAML, we succeeded in identifying and validating an 11-gene signature for prognosis prediction in patients with AML, which may serve as a potential prognostic biomarker. This prognostic model demonstrated a good performance in predicting 1-, 3-, and 5-year survivals. Due to the limitations in the current study, our findings require further confirmation with independent larger cohorts in future studies.
Acknowledgments
This work was supported in part by the National Natural Science Foundation of China (No. 81160075), Natural Science Foundation of Guangxi (No. 0728124), and Self-raised Scientific Research Fund of the Ministry of Health of Guangxi Province (Z2014035). The authors thank the contributors of The Cancer Genome Atlas and GSE12417 for their contribution to share their dataset on open access. In addition, we would like to acknowledge the helpful comments on this article received from our reviewers.
Disclosure
The authors report no conflicts of interest in this work.
References
- MeyerSCLevineRLTranslational implications of somatic genomics in acute myeloid leukaemiaLancet Oncol2014159e382e39425079101
- EsteyEDohnerHAcute myeloid leukaemiaLancet200636895501894190717126723
- PapaemmanuilEGerstungMBullingerLGenomic classification and prognosis in acute myeloid leukemiaN Engl J Med2016374232209222127276561
- DohnerHWeisdorfDJBloomfieldCDAcute myeloid leukemiaN Engl J Med2015373121136115226376137
- FerraraFSchifferCAAcute myeloid leukaemia in adultsLancet2013381986548449523399072
- BullingerLValkPJGene expression profiling in acute myeloid leukemiaJ Clin Oncol200523266296630516155012
- MetzelerKHHummelMBloomfieldCDAn 86-probe-set gene-expression signature predicts survival in cytogenetically normal acute myeloid leukemiaBlood2008112104193420118716133
- Cancer Genome Atlas Research NetworkLeyTJMillerCGenomic and epigenomic landscapes of adult de novo acute myeloid leukemiaN Engl J Med2013368222059207423634996
- AndersSHuberWDifferential expression analysis for sequence count dataGenome Biol20101110R10620979621
- RitchieMEPhipsonBWuDLimma powers differential expression analyses for RNA-sequencing and microarray studiesNucleic Acids Res2015437e4725605792
- ZhouMZhaoHWangZIdentification and validation of potential prognostic lncRNA biomarkers for predicting survival in patients with multiple myelomaJ Exp Clin Cancer Res20153410226362431
- ZhouXHuangZXuLA panel of 13-miRNA signature as a potential biomarker for predicting survival in pancreatic cancerOncotarget2016743696166962427626307
- HeagertyPJZhengYSurvival model predictive accuracy and ROC curvesBiometrics20056119210515737082
- XuJMWengMZSongFBBlockade of the CXCR6 signaling inhibits growth and invasion of hepatocellular carcinoma cells through inhibition of the VEGF expressionInt J Immunopathol Pharmacol201427455356125572735
- SunJJChenGYXieZTMicroRNA-361-5p inhibits cancer cell growth by targeting CXCR6 in hepatocellular carcinomaCell Physiol Biochem201638277778526872014
- TakiguchiGNishitaMKuritaKKakejiYMinamiYWnt5a-Ror2 signaling in mesenchymal stem cells promotes proliferation of gastric cancer cells by activating CXCL16-CXCR6 axisCancer Sci2016107329029726708384
- WangJLuYWangJKochAEZhangJTaichmanRSCXCR6 induces prostate cancer progression by the AKT/mammalian target of rapamycin signaling pathwayCancer Res20086824103671037619074906
- HaHKLeeWParkHJLeeSDLeeJZChungMKClinical significance of CXCL16/CXCR6 expression in patients with prostate cancerMol Med Rep20114341942421468586
- RichardsenENessNMelbo-JorgensenCThe prognostic significance of CXCL16 and its receptor C-X-C chemokine receptor 6 in prostate cancerAm J Pathol2015185102722273026272362
- LiYFuLXZhuWLShiHChenLJYeBBlockade of CXCR6 reduces invasive potential of gastric cancer cells through inhibition of AKT signalingInt J Immunopathol Pharmacol201528219420025921630
- GuoLCuiZMZhangJHuangYChemokine axes CXCL12/CXCR4 and CXCL16/CXCR6 correlate with lymph node metastasis in epithelial ovarian carcinomaChin J Cancer201130533634321527066
- MirHSinghRKloeckerGHLillardJWJrSinghSCXCR6 expression in non-small cell lung carcinoma supports metastatic process via modulating metalloproteinasesOncotarget20156129985999825888629
- NaKYKimHSJungWWCXCL16 and CXCR6 in Ewing sarcoma family tumorHum Pathol201445475376024507753
- HayetteSCornillet-LefebvrePTigaudIAF4p12, a human homologue to the furry gene of Drosophila, as a novel MLL fusion partnerCancer Res200565156521652516061630
- RobinsonBWCheungNKKolarisCPProspective tracing of MLL-FRYL clone with low MEIS1 expression from emergence during neuroblastoma treatment to diagnosis of myelodysplastic syndromeBlood200811173802381218195096
- SaitSNClaydonMAConroyJMNowakNJBarcosMBaerMRTranslocation (4;11)(p12;q23) with rearrangement of FRYL and MLL in therapy-related acute myeloid leukemiaCancer Genet Cytogenet2007177214314617854671
- FurthmayrHGlycophorins A, B, and C: a family of sialoglycoproteins. Isolation and preliminary characterization of trypsin derived peptidesJ Supramol Struct1978917995732312
- YoungRPWhittingtonCFHopkinsRJChromosome 4q31 locus in COPD is also associated with lung cancerEur Respir J20103661375138221119205
- KutlarFAmeriAPatelNHTwo new gamma chain variants: Hb F-Augusta GA [(G)gamma59(E3)Lys–> Arg; HBG2: c.179A > G] and Hb F-Port Royal-II [(A)gamma125(H3)Glu–> Ala; HBG1: c.377A > C]Hemoglobin201438537638025271994
- ShooterCRooksHTheinSLClarkBNext generation sequencing identifies a novel rearrangement in the HBB cluster permitting to-the-base characterizationHum Mutat201536114215025331561
- KurimaKYangYSorberKGriffithAJCharacterization of the transmembrane channel-like (TMC) gene family: functional clues from hearing loss and epidermodysplasia verruciformisGenomics200382330030812906855
- ZhaoJLiXYaoQRWCFusion: identifying phenotype-specific cancer driver gene fusions based on fusion pair random walk scoring methodOncotarget2016738610546106827506935
- BatsukhTSchulzYWolfSIdentification and characterization of FAM124B as a novel component of a CHD7 and CHD8 containing complexPLoS One2012712e5264023285124
- ZhaoXFColaizzo-AnasTNowakNJShowsTBElliottRWAplanPDThe mammalian homologue of mago nashi encodes a serum-inducible proteinGenomics19984723193229479507
- ZhaoXFNowakNJShowsTBAplanPDMAGOH interacts with a novel RNA-binding proteinGenomics200063114514810662555
- CasconAComino-MendezICurras-FreixesMWhole-exome sequencing identifies MDH2 as a new familial paraganglioma geneJ Natl Cancer Inst20151075djv05325766404
- LiuQHarveyCTGengHMalate dehydrogenase 2 confers docetaxel resistance via regulations of JNK signaling and oxidative metabolismProstate201373101028103723389923
- LoYWLinSTChangSJMitochondrial proteomics with siRNA knockdown to reveal ACAT1 and MDH2 in the development of doxorubicin-resistant uterine cancerJ Cell Mol Med201519474475925639359
- Medina VillaamilVAparicio GallegoGValbuena RubiraLFructose transporter GLUT5 expression in clear renal cell carcinomaOncol Rep201125231532321165569
- ReinickeKSotomayorPCisternaPDelgadoCNualartFGodoyACellular distribution of Glut-1 and Glut-5 in benign and malignant human prostate tissueJ Cell Biochem2012113255356221938742
- CarrozzoRVerrigniDRasmussenMSuccinate-CoA ligase deficiency due to mutations in SUCLA2 and SUCLG1: phenotype and genotype correlations in 71 patientsJ Inherit Metab Dis201639224325226475597
- LiuYLiXWangQDingYSongJYangYFive novel SUCLG1 mutations in three Chinese patients with succinate-CoA ligase deficiency noticed by mild methylmalonic aciduriaBrain Dev2016381616726028457
- OstergaardESchwartzMBatbayliMA novel missense mutation in SUCLG1 associated with mitochondrial DNA depletion, encephalomyopathic form, with methylmalonic aciduriaEur J Pediatr2010169220120519526370