
Abstract
Recurrence is one of the major causes of high mortality in ovarian cancer. However, the mechanism of ovarian cancer recurrence after chemotherapy has not been fully understood. In the present study, we investigated the effect of chemotherapy-induced tumor microenvironment on the proliferation of SKOV3 cells. We have shown that SKOV3 cells repopulated faster in the culture medium from apoptotic SKOV3 ovarian cancer cells after 24 h of etoposide phosphate (VP-16) treatment. We found that during apoptosis, cleaved caspase 3 could activate cytosolic calcium-independent phospholipase A2, which stimulated the release of arachidonic acid (AA) and triggered the production of prostaglandin E2 (PGE2). An increased level of phosphorylated focal adhesion kinase (FAK) subsequently facilitated the reproliferation of SKOV3 cells, and VP-16-induced repopulation effects were partially reversed by the FAK inhibitor PF562271. Furthermore, the plasma AA-to-PGE2 ratio and tumoral FAK expression of ovarian cancer patients after chemotherapy were significantly lower than those before chemotherapy. Taken together, our results indicate that chemotherapy-induced apoptotic cancer cells can produce PGE2-enriched microenvironment through caspase 3-mediated AA metabolic pathway, which could lead to the abnormal activation of FAK and eventually accelerate the repopulation of SKOV3 cells. Our study provides novel insight into a mechanism that may be utilized to prevent ovarian cancer recurrence in response to chemotherapy.
Introduction
Ovarian cancer is the fourth most common gynecological malignancy, the sixth leading cause of cancer deaths among women, and the second leading cause of gynecological malignancy-related deaths worldwide.Citation1 According to the National Comprehensive Cancer Network (NCCN) guidelines of 2016, the treatment of women who have advanced or poor-prognosis early-stage ovarian cancer mainly consists of surgery followed by chemotherapy.Citation2 Although overall tumor response rates associated with paclitaxel and platinum range from 70% to 80%,Citation3 50%–75% of individuals relapse within 18 months after completing first-line therapy and require further systemic therapy.Citation4 Patients who relapse are rarely curable and often have only a short-term progression-free survival. Since apoptosis is a major mechanism of cytotoxin-based chemotherapy, there may be a link between the apoptosis-induced death of tumor cells and the repopulation of surviving cells in ovarian cancer; however, investigations of a specific mechanism for this link are scarce. Thus, we focused on the mechanism of the repopulation of ovarian cancer cells after chemotherapy aiming to provide a novel strategy for solving the problem of the high rate of ovarian cancer recrudescence and to improve the treatment and prevention of ovarian cancer.
Several studies have recently focused on the adverse effects of chemotherapy.Citation5–Citation7 These findings have demonstrated that induction chemotherapy results in an accelerated repopulation and measurable regrowth of non-small-cell lung cancer tumors within weeks, which is much faster than the reported rates in preclinical models or untreated tumors. The cellular response to chemotherapy is presumed to induce the phenomenon of accelerated repopulation, which is one of the major causes of cancer recurrence.Citation7 Therefore, chemotherapy itself may be one of the reasons for cancer relapse, and the source of the repopulating cells constitutes those that survived after the first period of chemotherapy administration. In cancer treatment, apoptosis is a well-recognized cell death mechanism through which cytotoxic agents kill tumor cells. Caspase 3 is a protease that is activated during the execution phase of apoptosis, which contributes to cell death. Cleaved caspase 3 can activate cytosolic calcium-independent phospholipase A2 (iPLA2),Citation8 and a consequence of membrane phospholipase A2 (PLA2) activation is the release of arachidonic acid (AA) from membrane phospholipids, which ultimately triggers production of the growth signal prostaglandin E2 (PGE2).Citation7 Both AA and PGE2 stimulate cell proliferation and tumor growth.Citation9 Thus, caspase 3 activation may also ultimately lead to cancer recrudescence through the AA metabolic pathway. This mechanism has been observed in several different human cancers, but whether and why the activation of the AA metabolic pathway is linked with tumor recrudescence in ovarian cancer is unknown.
Focal adhesion kinase (FAK), a 125-kDa non-receptor cytoplasmic protein tyrosine kinase, is a key regulator of signals from the extracellular matrix mediated by integrins and growth factor receptors.Citation10,Citation11 In addition, elevated expression of FAK has been correlated with poor survival rates. FAK has been implicated in the regulation of a variety of cellular signaling pathways that control cell proliferation, cell-cycle progression, migration, apoptosis, and cell survival.Citation11,Citation12 In addition, the effects of PGE2 are associated with FAK. PGE2 treatment increases the phosphorylation of FAK in hepatocellular carcinoma (HCC) cells.Citation13 However, whether the chemotherapy-induced repopulation of ovarian cancer cells is through the activation of FAK remains unclear. Thus, we hypothesize that FAK may be downstream of the caspase-activated iPLA2-AA-PGE2 axis in the chemotherapy-induced repopulation of ovarian cancer cells.
Herein, we first studied the levels of PGE2 and AA and the expression of FAK and phosphorylated FAK (p-FAK) in clinical samples. Next, we established a Transwell system for the co-culture of SKOV3 cells with the chemotherapy drug etoposide phosphate (VP-16) to mimic the microenvironmental changes in the dying cells and to stimulate the growth of a small number of surviving ovarian cancer cells. Our results test the hypotheses that the VP-16 treatment triggers apoptosis, caspase 3 cleavage, and activation of iPLA2, stimulating the release of AA and the production of PGE2, resulting in the activation of FAK. The present study indicates a novel mechanism by which chemotherapy promotes ovarian cancer cells repopulation and provides an attractive target for prevention of recurrence.
Materials and methods
Chemicals and reagents
VP-16 was purchased from Qilu Pharmaceutical Co., LTD (Jinan, China). A human PGE2 enzyme-linked immunosorbent assay (ELISA) kit and human AA ELISA kit were purchased from R&D Systems. PF562271 was purchased from Selleckchem. RPMI 1640 medium, fetal bovine serum (FBS), penicillin, streptomycin, and bicinchoninic acid (BCA) protein assay kits were purchased from Beyotime Institute of Biotechnology (Haimen, China). The primary antibodies, including anti-FAK (Cat. # ab40794; Abcam), anti-p-FAK (phosphor Tyr397, Cat. # ab39967; Abcam), anti-iPLA2 (Cat. # sc-25504; Santa Cruz Biotechnology), anti-caspase 3 (Cat. # 836; Cell Signaling), and anti-β-actin (Cat. # 1854; Epitomics), were diluted at 1:800 or 1:1,000 before use. All chemical compounds were analytically pure reagents.
Clinical samples
The tissue samples and plasma samples from ovarian cancer patients were collected during routine therapeutic surgery before and after chemotherapy in our hospital. Tissue and plasma samples of patients (stages I and II, n=14) who underwent surgery without chemotherapy were presented as the control group, whereas tissue and plasma samples collected from patients (stages III and IV, n=12) who received two to four short-course regimens of chemotherapy (2–4 months) were presented as the chemotherapy group. All tissues and plasma samples were immediately frozen in liquid nitrogen after explantation. This work was approved by the Ethics Committee of Jilin Cancer Hospital. All patients gave written informed consent before participating in this study.
Immunohistochemistry
Immunohistochemical staining for FAK and p-FAK in the aforementioned patient tissue samples was performed. Briefly, after deparaffinization and blocking, the sections were incubated overnight at 4°C with the anti-FAK or anti-p-FAK antibody. The sections were counterstained with Meyer’s hematoxylin. FAK- and p-FAK-positive cells were defined as those with brown staining in the nucleus and cytoplasm, respectively. Signals in tumor tissue of each group were visually quantified using the same scoring system (0–9), multiplied intensity of signal, and percentage of positive cells (signal: 0= no signal, 1= weak signal, 2= intermediate signal, and 3= strong signal; percentage: 0=0%, 1=25%, 2=25%–50%, and 3=50%).Citation14
Co-culture system and cell proliferation assays
The human epithelial ovarian cancer cell line SKOV3 was purchased from ATCC and cultured in RPMI 1640 supplemented with 10% FBS, penicillin (100 units/mL), and streptomycin (100 mg/mL). Cells were incubated at 37°C under 5% CO2. Six-well Transwell chambers (Corning, Corning, NY, USA) with 4.0 μm pore size semipermeable membranes were used to prepare the Transwell-based co-culture system.Citation14,Citation15 In the bottom chamber, SKOV3 cells (105 cells per well) as the feeder cells were treated with VP-16, and in the upper chamber, fewer numbers of SKOV3 cells (1,000 cells per well) were designed as the receptor cells exposed to culture medium from the feeder cells. In the model group, the feeder cells were rinsed with PBS twice after a 24 h treatment with 5 μM VP-16, fresh culture medium was added, and the SKOV3 receptor cells were inserted into the upper chamber. Meanwhile, a group of feeder cells without VP-16 treatment were designated as the control group (con). The FAK inhibitor PF562271 was added to the culture medium of the feeder cells with or without VP-16 treatment, and the receptor cells were collected after a 10-day culture. Receptor cells located in the semipermeable filter insert were fixed with methanol and then stained with 0.1% crystal violet for 30 min at room temperature. After washing the wells with PBS, the cells on the upper surface of the membranes were imaged under a microscope. Finally, the cells were solubilized with 1 mL of 33% acetic acid and quantified by their absorbance at 570 nm. We set the average OD570 of cells from control group to 100%, and then determined the percentage of stimulated cells that were viable (attached) by comparing the average OD570 values of stimulated cells with the OD570 values of the nonstimulated cells.
Western blot analysis
Feeder cells from the third day of incubation were collected to analyze the protein level of caspase 3. Feeder cells from the sixth day of incubation were collected to analyze the protein expression of iPLA2. Receptor cells from the sixth day of incubation were collected for protein extraction for Western blot analysis of FAK and p-FAK. The collected SKOV3 cells (either receptor cells or feeder cells) grown in the co-culture system were collected by centrifugation after washing twice with cold PBS. The cell pellets were suspended in 100 μL of radioimmunoprecipitation assay lysis buffer for 15 min at 4°C and then centrifuged at 13,000 rpm for 15 min. The supernatants containing the total protein extracts were collected. The concentrations of the proteins were determined using the BCA protein assay kit. Immunoblotting analysis was performed with 20 μg of protein from each sample on a 12% sodium dodecyl sulfate (SDS) gel via polyacrylamide gel electrophoresis (PAGE). The electrophoresis was carried out initially at 80 V for 20 min followed by 160 V for 60–90 min. The proteins separated using SDS-PAGE were transferred onto PVDF membranes. The membranes were incubated for 2 h in blocking buffer (10 mM Tris–HCl, 150 mM NaCl, and 0.1% Tween-20) containing 5% bovine serum albumin and then incubated with a primary antibody (1:800 or 1:1,000) overnight. The membranes were then washed and incubated with a secondary antibody (1:2,000) at room temperature for 1 h. Bands were visualized using an enhanced chemiluminescence Western blotting detection system (Tanon 4200).
Measurement of AA and PGE2 levels
The supernatants (50 μL) were collected from the control and model groups in the Transwell system daily during the incubation period. Plasma samples from patients who underwent surgery alone and who underwent surgery and chemotherapy were presented as the control and chemotherapy groups, respectively. In vitro supernatants or patient plasma samples were thawed, and PGE2 and AA levels were analyzed using the human PGE2 ELISA kit and the human AA ELISA kit, respectively, according to the manufacturer’s instructions. The absorbances were measured at a wavelength of 450 nm.
Statistical analysis
All experiments were completed at least three times unless otherwise indicated. All the data were expressed as the mean ± standard deviation. Statistical significance among groups was analyzed by one-way analysis of variance followed by Dunnett’s multiple comparison test. A value of P<0.05 was considered statistically significant.
Results
Levels of AA and PGE2 and the expression of FAK differ in the clinical samples before and after chemotherapy
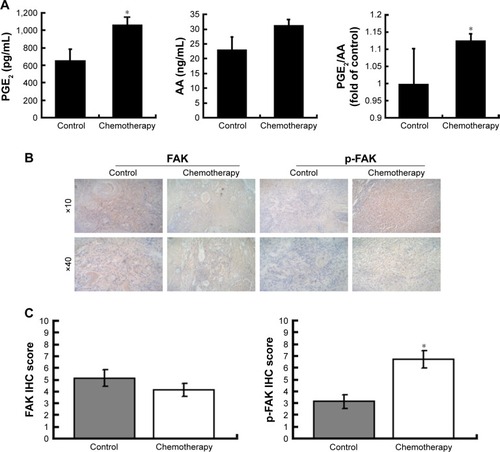
We first determined the levels of AA and PGE2 in patient plasma samples before and after chemotherapy. The level of PGE2 in patients who underwent chemotherapy was significantly higher than that in the control group, while the level of AA did not differ between the chemotherapy group and the control group. Also, the PGE2-to-AA ratio in plasma samples after chemotherapy was significantly higher than the ratio before chemotherapy (). This result suggested that chemotherapy might significantly influence the release of AA and PGE2. To understand whether the expression of FAK was altered after chemotherapy, we compared the expression levels of FAK and p-FAK in patient ovarian cancer tissues before and after chemotherapy (). The phosphorylation of FAK in the chemotherapy group was significantly higher than that in the control group (), indicating that the phosphorylation of FAK is associated with chemotherapy.
Figure 1 The PGE2 and AA level and the expression of FAK in the clinical samples before and after chemotherapy.
Abbreviations: PGE2, prostaglandin E2; AA, arachidonic acid; FAK, focal adhesion kinase; ELISA, enzyme-linked immunosorbent assay; SD, standard deviation; p-FAK, phosphorylated FAK; IHC, immunohistochemical.
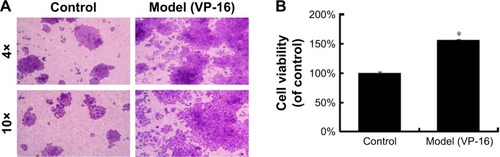
VP-16-induced apoptosis accelerates the repopulation of the SKOV3 cell line
Accelerated repopulation causes cancer treatment failure. Researchers have observed that apoptotic tumor cells can stimulate the repopulation of tumors from a small number of surviving cells. In our study, we established a Transwell system for co-cultures of SKOV3 cells with the chemotherapy drug VP-16 or without the drug to examine whether VP-16 treatment can stimulate the growth of surviving ovarian cancer cells.
VP-16 treatment led to apoptosis of the feeder cells, and the result of the crystal violet staining assay of the receptor cells showed that compared with cells in the control group, receptor cells in the model (VP-16-treated) group showed significantly more proliferation under the microscope (). In addition, the cell viability was approximately 1.6-fold that of the control group (). This result confirmed that the VP-16-induced apoptosis can accelerate the repopulation of a small number of surviving SKOV3 cells.
Figure 2 The influence of VP-16-induced apoptosis on the repopulation of SKOV3 cells.
Abbreviations: VP-16, etoposide phosphate; SD, standard deviation.
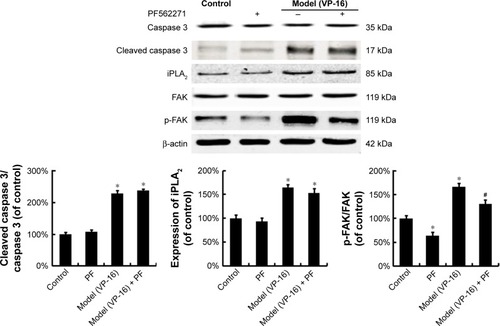
Caspase 3-activated iPLA2-AA-PGE2 pathway is involved in the apoptosis-induced repopulation of SKOV3 cells
Activated caspase 3, a key executioner in apoptosis, may be involved in growth stimulation of cells that survive chemotherapy. shows the activation of caspase 3 in feeder cells. The results showed that the VP-16-induced apoptosis can induce the expression of cleaved caspase 3. We then attempted to identify the downstream factors of caspase 3 involved in generating growth-promoting factors in the dying cells, and focused on iPLA2. iPLA2, an enzyme of the AA metabolic network, is activated by caspase 3 cleavage. Caspase 3-mediated iPLA2 activation leads to increased production of AA, whose downstream eicosanoid derivatives (such as PGE2) have been implicated in stimulating tumor growth and stem cell proliferation.
Figure 3 The protein expression of caspase 3, cleaved caspase 3, iPLA2, FAK, and p-FAK in the model of the VP-16-treatment-induced repopulation of SKOV3 cells.
Abbreviations: iPLA2, cytosolic calcium-independent phospholipase A2; FAK, focal adhesion kinase; p-FAK, phosphorylated FAK; VP-16, etoposide phosphate; SD, standard deviation.
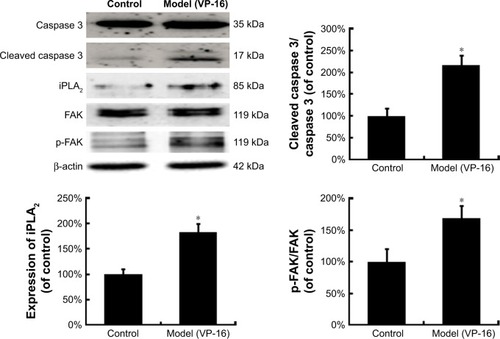
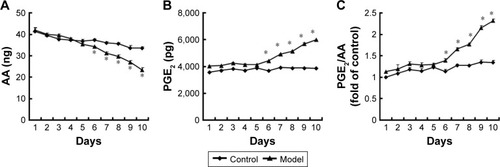
To evaluate the potential involvement of the caspase-activated iPLA2-AA-PGE2 pathway in the apoptosis-induced tumor cell proliferation, we examined the expression of iPLA2 within the Transwell system. iPLA2 levels in feeder cells treated with VP-16 were higher than those in the control group (). In addition, we analyzed the AA and PGE2 levels of the supernatants collected daily from the Transwell system during the 10-day incubation. Over time, the amount of AA () decreased, while the level of PGE2 () increased. Significant differences between the model group and the control group appeared beginning at day 6. We then calculated the content PGE2-to-AA ratio in the model group, and found that it increased in a time-dependent manner with significant differences from the control group appearing beginning at day 6. The PGE2-to-AA ratio was 2.32 at day 10 (). These results confirmed our hypothesis that chemotherapy drug-induced apoptosis may lead to tumor cell repopulation and that the caspase 3-iPLA2-AA-PGE2 pathway may be involved in this process.
Figure 4 The AA and PGE2 levels within the Transwell system.
Abbreviations: AA, arachidonic acid; PGE2, prostaglandin E2; ELISA, enzyme-linked immunosorbent assay; SD, standard deviation.
PEG2 accelerates the repopulation of the SKOV3 cell line through the activation of FAK
To identify the downstream factors of PGE2, we focused on FAK, which is a key enzyme involved in the process of proliferation. Phosphorylation of FAK at tyrosine 397 (Tyr397) has been used as a marker of FAK activity.Citation16 In addition, PGE2 treatment can increase FAK phosphorylation.Citation13 To investigate the role of FAK in the pathways involved in the VP-16-induced repopulation, we measured the expression of FAK and p-FAK within the Transwell model on the 6th day of the incubation. The phosphorylation of FAK was significantly higher in the model group than in the control group, but the level of FAK remained unchanged (). Meanwhile, PF562271, an ATP competitor that inhibits the autophosphorylation of FAK, was added to the system.Citation17 As shown in , the addition of the FAK inhibitor partially reversed the VP-16-induced repopulation of SKOV3 cells. The expression of p-FAK was downregu-lated by PF562271 but did not significantly influence the expression of caspase 3 or iPLA2 (), suggesting that the phosphorylation of FAK may occur downstream of the caspase 3-iPLA2-AA-PGE2 pathway and may influence the repopulation of SKOV3 cells.
Figure 5 The influence of the FAK inhibitor PF562271 (PF) on the VP-16-induced repopulation of SKOV3 cells.
Abbreviations: FAK, focal adhesion kinase; VP-16, etoposide phosphate; SD, standard deviation.
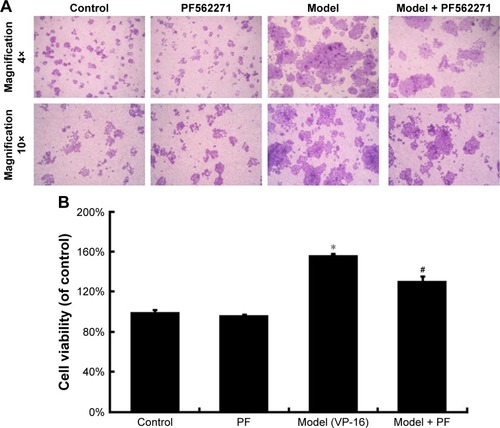
Figure 6 The influence of the FAK inhibitor PF562271 on the expression of FAK, p-FAK, caspase 3, and iPLA2.
Abbreviations: FAK, focal adhesion kinase; p-FAK, phosphorylated FAK; iPLA2, cytosolic calcium-independent phospholipase A2; SD, standard deviation; VP-16, etoposide phosphate.
Discussion
Treatment of ovarian cancer is based on the integration of surgery and chemotherapy. Chemotherapy plays a major role both in adjuvant treatment and in the care of patients with advanced disease.Citation18 The standard of care in advanced epithelial ovarian cancer encompasses surgical staging and resection followed by administration of paclitaxel–platinum-based chemotherapy.Citation19–Citation21 Despite the high rates of overall tumor response associated with chemotherapeutics, many responders relapse within a short period after completing first-line therapy and require further systemic therapy. Recurrence is especially common in ovarian cancer. Patients who have recurrent ovarian cancer are rarely curable and often have only a short-term progression-free survival.Citation3,Citation4 Researchers have investigated the mechanism of cancer recurrence from various aspects, including apoptosis-related genes, chromosome aberration, angiogenesis, the cancer microenvironment, the immune systemancer stem cells.Citation22 Cytotoxin chemotherapy is a common type of chemotherapy and is widely used in systemic therapy for cancer treatment.Citation23 Previous studies have reported that radiotherapy or chemotherapy can lead to the measurable regrowth of tumor cells.Citation7,Citation8 In addition, PGE2 promotes the proliferation of cancer cells and stem cells in different types of cancer. In our study, PGE2 levels also increased in clinical samples. Thus, we propose that chemotherapy and the recurrence of ovarian cancer may be linked to cytotoxin chemotherapy drugs that induce PGE2 production, and despite the traditional role that chemotherapy has played in killing tumor cells, chemotherapy may have become a selective pressure that has led to the repopulation of ovarian cancer cells. In our study, chemotherapy was mechanistically determined to have two sides. On the one hand, chemotherapy killed cancer cells by inducing apoptosis, whereas it also caused the accelerated repopulation of a small number of surviving ovarian cancer cells through the caspase 3-activated iPLA2-AA-PGE2 pathway followed by FAK phosphorylation. Thus, the application of an inhibitor that blocks this pathway after a chemotherapy course may become a solution to the high death rate in ovarian cancer patients.
The AA metabolic pathway has long been recognized to be correlated with the occurrence and development of various types of cancer. PLA2 and cyclooxygenase (COX) are rate-limiting enzymes in the AA metabolic pathway; these enzymes are important in the development and progression of a number of types of cancer.Citation10,Citation24 PLA2 comprises a set of extracellular and intracellular enzymes.Citation25 The various groups of PLA2 can be mainly divided into three categories: secretory PLA2, cytosolic PLA2 (cPLA2) and iPLA2.Citation26,Citation27 iPLA2 plays a functional role in cellular signaling and AA release.Citation28 Besides iPLA2, which we studied, a major contribution of cPLA2 enzyme activity is also to mediate AA release.Citation29 Downregulation of COX-2 expression leads to increased abundance of its principal metabolic product, PGE2, the pleiotropic effects of which appear to affect most, if not all, of the hallmarks of cancer.Citation5,Citation30 PGE2 is a potent promoter of cell proliferation, motility, invasion, and angiogenesis.Citation24 Similar results were obtained in our previous studies: celecoxib, a potent nonsteroidal anti-inflammatory drug, downregulates COX-2 protein expression in Lewis lung carcinoma cells. In addition, celecoxib increases the amount of AA and decreases the amount of PGE2 in the culture supernatant. AA plays an important role in PGE2 production, and in our study, the PGE2 -to-AA ratio increased in a dose-dependent manner.Citation31 In breast cancer cells, chemotherapy-induced apoptotic tumor cells use apoptosis to generate PGE2-stimulating signals to promote the repopulation of tumors. In this process, the few surviving cells that escape death after exposure to radiotherapy or chemotherapy can rapidly repopulate the badly damaged tumor by proliferating at a markedly accelerated pace via the caspase 3-PLA2-AA-PGE2 pathwayCitation5,Citation6,Citation8. In our study, we found that VP-16 treatment increased the amount of PEG2 and decreased the amount of AA in the culture supernatant. In addition, the PGE2-to-AA ratio which increased in a time-dependent manner suggested that caspase 3 cleavage-activated iPLA2 stimulated the release of AA. This stimulation ultimately triggered the production of PGE2 and confirmed the crucial role of the AA metabolic pathway (iPLA2-AA-PGE2 pathway) in the process of chemotherapy-induced cancer cell repopulation. It is worth to note that although showed increased manner of AA level in the patients after chemotherapy, there was no statistical significance between the two groups. The significantly increased PEG2-to-AA ratio was also consistent with our in vitro data.
As a key regulator of cellular signaling pathways that control cell proliferation and a protein downstream of PGE2, FAK is associated with proteins of the AA metabolic pathway.Citation11,Citation14,Citation32–Citation34 For example, exogenous PGE2 can increase FAK phosphorylation at Tyr397 in a concentration-dependent manner in HCC cells. At the same time, the selective COX-2 inhibitor celecoxib decreases FAK expression. These results implied that FAK phosphorylation may be regulated by the level of PGE2.Citation5,Citation13 However, whether the chemotherapy-induced repopulation of ovarian cancer cells occurs through the activation of FAK remains unclear. In our study, FAK phosphorylation was found to increase in both the Tran-swell system that we established and in the patient tissue samples after chemotherapy. Addition of the FAK inhibitor PF562271 partially reversed the VP-16-induced repopulation of SKOV3 cells. The expression of p-FAK was downregulated by PF562271, while the inhibitor did not significantly influence the expression of caspase 3 or iPLA2, suggesting that FAK phosphorylation might be downstream of the caspase 3-iPLA2-AA-PGE2 pathway and may contribute to the repopulation of SKOV3 cells after chemotherapy. In addition, this confirmed our hypothesis: as chemotherapy leads to consistent changes in the microenvironment of ovarian cancer cells, the chemotherapy-induced dysregulation of the AA metabolic pathway may lead to abnormal activation of FAK and thus accelerate the repopulation of SKOV3 cells.
Conclusion
In summary, we determined that VP-16 treatment triggered the process of apoptosis, caspase 3 cleavage, and the activation of iPLA2, which stimulated the release of AA and ultimately triggered the production of PGE2. Activation of the AA metabolic pathway in a large number of dying cells stimulated the growth of a small number of surviving cells by the activation of FAK. In patient tissue and plasma samples, the level of PGE2 increased after chemotherapy, and the PGE2-to-AA ratio after chemotherapy was significantly lower than that before chemotherapy. These results suggest that although chemotherapy induces cancer cell apoptosis, chemotherapy may also trigger the signals that ultimately lead to ovarian cancer recurrence.
Acknowledgments
Prof Jing Li, Fengying Guan, and Ming Zhang are acknowledged for their help in preparing the paper. This work was sponsored by the National Natural Science Foundation of China (81201804 and 81371681), the Science and Technology Department of Jilin Province (20160101215JC), the Opening Project of State Key Laboratory of Supramolecule Structure and Materials of Jilin University (SKLSSM 201605), and the Undergraduate Innovative Program of Jilin University (2015741091). Most of the experiments were carried out at the Nanomedicine Engineering Laboratory of Jilin Province and the Preclinical Pharmacology R&D Center of Jilin Province.
Disclosure
The authors report no conflicts of interest in this work.
References
- FerlayJSoerjomataramIDikshitRCancer incidence and mortality worldwide: sources, methods and major patterns in GLOBOCAN 2012Int J Cancer20151365E359E38625220842
- BristowREChangJZiogasACamposBChavezLRAnton-CulverHImpact of national cancer institute comprehensive cancer centers on ovarian cancer treatment and survivalJ Am Coll Surgeons20152205940950
- ZhangHGeTCuiXPrediction of advanced ovarian cancer recurrence by plasma metabolic profilingMol Biosyst201511251652125424060
- SalaniRBackesFJFungMFPosttreatment surveillance and diagnosis of recurrence in women with gynecologic malignancies: Society of Gynecologic Oncologists recommendationsAm J Obstet Gynecol2011204646647821752752
- WuLTannockIFRepopulation in murine breast tumors during and after sequential treatmentsCancer Res20036392134213812727830
- LiFHuangQChenJApoptotic cells activate the “phoenix rising” pathway to promote wound healing and tissue regenerationSci Signal20103110ra1320179271
- YomSSAccelerated repopulation as a cause of radiation treatment failure in non-small cell lung cancer: review of current data and future clinical strategiesSemin Radiat Oncol2015252939925771413
- HuangQLiFLiuXCaspase 3-mediated stimulation of tumor cell repopulation during cancer radiotherapyNat Med201117786086621725296
- YangPCartwrightCALiJArachidonic acid metabolism in human prostate cancerInt J Oncol2012411495150322895552
- McLeanGWCarragherNOAvizienyteEEvansJBruntonVGFrameMCThe role of focal-adhesion kinase in cancer – a new therapeutic opportunityNat Rev Cancer20055750551516069815
- YoonHDehartJPMurphyJMLimSTUnderstanding the roles of FAK in cancer: inhibitors, genetic models, and new insightsJ Histochem Cytochem201563211412825380750
- StokesJBAdairSJSlack-DavisJKInhibition of focal adhesion kinase by PF-562,271 inhibits the growth and metastasis of pancreatic cancer concomitant with altering the tumor microenvironmentMol Cancer Ther201110112135214521903606
- BaiXZhangWLiuNFocal adhesion kinase: important to prostaglandin E2-mediated adhesion, migration and invasion in hepatocellular carcinoma cellsOncol Rep200921112913619082453
- SunBZLiJShaoDAdipose tissue-secreted miR-27a promotes liver cancer by targeting FOXO1 in obese individualsOnco Targets Ther20058735744
- MaoPSmithLXieWFWangMDDying endothelial cells stimulate proliferation of malignant glioma cells via a caspase 3-mediated pathwayOncol Lett201351615162023760767
- FongYCLiuSCHuangCYOsteopontin increases lung cancer cells migration via activation of the alphavbeta3 integrin/FAK/Akt and NF-kappaB-dependent pathwayLung Cancer200964326327018996613
- YoonHChoiYLSongJYTargeted inhibition of FAK, PYK2 and BCL-XL synergistically enhances apoptosis in ovarian clear cell carcinoma cell linesPLoS One201492e8858724523919
- PignataSCannellaLLeopardoDPisanoCBruniGSFacchiniGChemotherapy in epithelial ovarian cancerCancer Lett2011303738321353386
- KampanNCMadondoMTMcNallyOMQuinnMPlebanskiMPaclitaxel and its evolving role in the management of ovarian cancerBiomed Res Int2015201541307626137480
- NaganoHTachibanaYKawakamiMPatients with advanced ovarian cancer administered oral etoposide following taxane as maintenance chemotherapyCase Rep Oncol20169119520427099605
- ZhangSHHuangQEtoposide induces apoptosis via the mitochondrial-and caspase-dependent pathways and in non-cancer stem cells in Panc-1 pancreatic cancer cellsOncol Rep20133062765277024100999
- BarkerHEPagetJTKhanAAHarringtonKJThe tumour microenvironment after radiotherapy: mechanisms of resistance and recurrenceNat Rev Cancer201515740942526105538
- SonpavdeGWangCGGalskyMDOhWKArmstrongAJCytotoxic chemotherapy in the contemporary management of metastatic castration-resistant prostate cancer (mCRPC)BJU Int20151161172925046451
- LiJLiOKanMBerberine induces apoptosis by suppressing the arachidonic acid metabolic pathway in hepatocellular carcinomaMol Med Rep20151234572457726081696
- ZhaoXWangDZhaoZCaspase-3-dependent activation of calcium-independent phospholipase A2 enhances cell migration in non-apoptotic ovarian cancer cellsJ Biol Chem200628139293572936816882668
- LeeCParkDWLeeJSecretory phospholipase A2 induces apoptosis through TNF-alpha and cytochrome c-mediated caspase cascade in murine macrophage RAW 264.7 cellsEur J Pharmacol20065361–2475316564042
- CastelloneMDTeramotoHWilliamsBODrueyKMGutkindJSProstaglandin E2 promotes colon cancer cell growth through a Gs-axin-beta-catenin signaling axisScience200531057531504151016293724
- SongKZhangXZhaoCAngNTMaZAInhibition of Ca2+-independent phospholipase A2 results in insufficient insulin secretion and impaired glucose toleranceMol Endocrinol200519250451515471944
- DanPRosenblatGYedgarSPhospholipase A2 activities in skin physiology and pathologyEur J Pharmacol20126911–31822819703
- GreenhoughASmarttHJMooreAEThe COX-2/PGE2 pathway: key roles in the hallmarks of cancer and adaptation to the tumour microenvironmentCarcinogenesis200930337738619136477
- ZhangMXuZGShiZInhibitory effect of celecoxib in lung carcinoma by regulation of cyclooxygenase-2/cytosolic phospholipase A(2) and peroxisome proliferator-activated receptor gammaMol Cell Biochem20113551–223324021559762
- KajimotoMIchiyamaTUenoYShiraishiMHasegawaMFurukawaSEnhancement of activated β1-integrin expression by prostaglandin E2 via EP receptors in isolated human coronary arterial endothelial cells: implication for the treatment of Kawasaki diseaseInflamm Res200958422422819169646
- GervaisFGThornberryNARuffoloSCCaspases cleave focal adhesion kinase during apoptosis to generate a FRNK-like polypeptideJ Biol Chem19982732717102171089642276
- WangSKeYLuGVasculogenic mimicry is a prognostic factor for postoperative survival in patients with glioblastomaJ Neurooncol2013112333934523417321