
 ?Mathematical formulae have been encoded as MathML and are displayed in this HTML version using MathJax in order to improve their display. Uncheck the box to turn MathJax off. This feature requires Javascript. Click on a formula to zoom.
Abstract
Background
Novel diagnostic predictors and drug targets are needed for LUAD (lung adenocarcinoma). We aimed to build a specific SVM (support vector machine) classifier for diagnosis of LUAD and identify molecular markers with prognostic value for LUAD.
Methods
The expression differences of miRNAs, lncRNAs and mRNAs between LUAD and normal samples were compared using data from TCGA (The Cancer Genome Atlas) database. A LUAD related miRNA-lncRNA-mRNA network was constructed, based on which feature genes were selected for the construction of LUAD specific SVM classifier. The robustness and transferability of SVM classifier were validated using gene expression profile datasets GSE43458 and GSE10072. Prognostic markers were identified from the network. A set of LUAD-related differentially expressed miRNAs, lncRNAs and miRNAs were identified and a LUAD related miRNA-lncRNA-mRNA network was obtained. The LUAD specific SVM classifier constructed on the basis of the network was robust and efficient for classification of samples from TCGA dataset and two independent validation datasets.
Results
Eight RNAs with prognostic value were identified, including hsa-miR-96, hsa-miR-204, PGM5P2 (phosphoglucomutase 5 pseudogene 2), SFTA1P (surfactant associated 1), RGS20 (regulator of G protein signaling 20), RGS9BP (RGS9-binding protein), FGB (fibrinogen beta chain) and INA (alpha-internexin). Among them, RGS20 and INA were regulated by hsa-miR-96. RGS20 was also regulated by hsa-miR-204, which was a potential target of SFTA1P.
Conclusion
The LUAD specific SVM classifier may serve as a novel diagnostic predictor. hsa-miR-96, hsa-miR-204, PGM5P2, SFTA1P, RGS20, RGS9BP, FGB and INA may serve as prognostic markers in clinical practice.
Introduction
LUAD (lung adenocarcinoma) is the most common subtype of non-small cell lung cancer, accounting for about 40% of lung cancer worldwide.Citation1,Citation2 Molecularly targeted therapies using TKIs (tyrosine kinase inhibitors) are standard treatments for LUAD patients with mutations in EGFR (epidermal growth factor receptor) and fusions of ALK (anaplastic lymphoma kinase), ROS1 (ROS proto-oncogene 1), and RET (rearranged during transfection).Citation3,Citation4 Acquired resistance, however, often occurs approximately 1–2 years after TKI treatment.Citation4 Moreover, few effective therapies have been developed to target alterations in other genes, such as TP53 (tumor protein p53),Citation5 KEAP1 (kelch-like ECH associated protein 1)Citation6 and STK11 (serine/threonine kinase 11).Citation7 Therefore, it is still urgent for developing new drug targets for the diagnosis and treatment of LUAD.
Increasing evidence has highlighted the involvement of ncRNAs (non-coding RNAs) in tumorigenesis.Citation8 Two typical subtypes of ncRNAs are miRNAs (microRNAs) and lncRNAs (long non-coding RNAs).Citation9–Citation11 miRNAs are small ncRNAs with about 22 nucleotides, which can interact with target mRNAs to degrade mRNAs or inhibit the translation of mRNA.Citation9,Citation10 In comparison to miRNAs, lncRNAs are much longer ncRNAs with more than 200 nucleotides and function through more diverse mechanisms.Citation9,Citation11 In addition to directly targeting mRNAs, it has also been shown to function as ceRNAs (competing endogenous RNAs), interacting with miRNAs to indirectly regulate mRNAs.Citation11,Citation12 It is thus believed that interplays between lncRNAs and miRNAs may play an important role in tumorigenesis.Citation12 Recently, investigations about the lncRNA-miRNA-mRNA ceRNA networks provide a better understanding of the roles lncRNA-miRNA interactions in mRNAs regulation and LUAD development.Citation13,Citation14 Important regulatory pathways, as well as therapeutic targets, could be revealed based on lncRNA-miRNA-mRNA networks. For example, MEG3 (maternally expressed 3), MIAT (myocardial infarction associated transcript) and LINC00115 may serve as prognostic lncRNAs and may be involved in regulatory pathways in LUAD.Citation14 According to the lncRNA-miRNA-mRNA network, MEG3 and MIAT regulate MAPK9 (mitogen-activated protein kinase 9) by interacting with miR-106, whereas LINC00115 regulate FGF2 (fibroblast growth factor 2) by interacting with miR-7.Citation14
Two gene expression profile datasets GSE43458Citation15 and GSE10072Citation16 have been used to reveal genes related to LUAD. It has been shown that ETS2 (V-ets erythroblastosis virus E26 oncogene homolog 2) is downregulated in LUAD, using GSE43458 dataset.Citation15 ETS2 may inhibit cancer cell invasion, migration and growth by suppressing MET activation.Citation15 Cigarette smoking related signature genes in LUAD patients have been identified using GSE10072 dataset.Citation16 It is remarkable that most of the signatures are involved in cell cycle, such as NEK2, TTK, and PRC1.Citation16 Though advances have been made to identify LUAD related signatures, efficient diagnostic predictors and potential drug targets of LUAD are still in need.
In order to identify novel diagnostic predictors and molecular markers, we first constructed a LUAD specific lncRNA-miRNA-mRNA ceRNA network in our study, using data from TCGA (The Cancer Genome Atlas). A LUAD specific SVM (support vector machine) classifier was built and prognosis related nodes were identified based on the ceRNA network. GSE43458 and GSE10072 datasets were further used to validate the efficiency and robustness of the SVM classifier in predicting LUAD. The SVM classifier and the prognosis related nodes may contribute to the diagnosis and treatment of LUAD in clinical practice.
Materials and methods
Data source and data preprocessing
The mRNA and miRNA expression data of LUAD-related samples was downloaded from TCGA (https://gdc-portal.nci.nih.gov/). After checking the barcode information of samples, a total of 464 LUAD samples with both mRNA and miRNA data were obtained for subsequent analysis, including 445 LUAD and 19 normal samples. All the clinical information related to these samples was also obtained.
Two independent validation datasets GSE10072 (contributed by Landi et al)Citation16 and GSE43458 (contributed by Kabbout et al)Citation15 were downloaded from GEO (Gene Expression Omnibus) database (https://www.ncbi.nlm.nih.gov/geo/). In total, 107 lung samples (58 LUAD versus 49 normal samples, GPL96 [HG-U133A] platform) were included in the GES10072 dataset, and 110 lung samples (80 LUAD versus 30 normal samples, GPL6244 [HuGene-1_0-st] platform) were included in the GES43458 dataset. The package oligoCitation17 under R was used for background adjustment of expression values and normalization preprocessing of expression profile data, including conversion of the original data format, imputation of missing values and data standardization.
Identification of LUAD related lncRNAs, miRNAs and mRNAs
According to annotation information from HGNC (HUGO Gene Nomenclature Committee, http://www.genenames.org/), the lncRNA data of LUAD-related samples downloaded from TCGA were obtained based on the gene ID. Expression differences of mRNAs and miRNA-seq data between LUAD and normal samples were analyzed using edgeR packageCitation18 under R3.0.1 and FDR (false discovery rate) was calculated using multtest package.Citation19 LncRNAs, miRNAs and mRNAs with FDR <0.05 and FC (fold change) >1.5 or <0.67 (|logFC|>0.585) were considered to be significantly differentially expressed between LUAD and normal samples.
Identification of lncRNAs, miRNAs and mRNAs related to clinical features
LUAD samples downloaded from TCGA were binary classified according to clinical information. Classifications included age (≥60 versus <60), gender (female versus male), pathologic M (M1 versus M0), pathologic N (N3 + N2 versus N0 + N1), pathologic T (T3 + T4 versus T1 + T2), pathologic stage (I + II versus III + IV), cancer status (with versus without), smoking history (yes versus no) and vital status (living versus deceased). The mRNAs, miRNAs and lncRNAs related to clinical features were then screened from differentially expressed RNAs between LUAD and normal samples, using edgeR package and multtest package. lncRNAs, miRNAs and mRNAs with FDR <0.05 and |logFC|>0.585 were considered to be related to clinical features.
Construction of LUAD-related lncRNA-miRNA-mRNA ceRNA network
The miRNAs targeted by differentially expressed lncRNAs were predicted using miRcode (version 11, http://www.mircode.org/)Citation20 and starBase (version 2.0)Citation21 databases. Results from these two databases were combined and intersected with differentially expressed miRNAs. The intersection contained differentially expressed miRNAs targeted by differentially expressed lncRNAs. A LUAD-related lncRNA-miRNA regulation network was thus obtained.
Similarly, differentially expressed mRNAs targeted by differentially expressed miRNAs were obtained based on the information of miRTarBase (version 6.0, http://mirtarbase.mbc.nctu.edu.tw).Citation22,Citation23 Then the common PPIs (protein–protein interactions) existed in three databases, including BioGRID (http://thebiogrid.org/),Citation24 HPRD (Human Protein Reference Database, http://www.hprd.org/)Citation25 and DIP (Database of Interacting Proteins, http://dip.doe-mbi.ucla.edu/),Citation26 were identified. PPIs corresponding to differentially expressed mRNAs targeted by differentially expressed miRNAs were extracted and then integrated with differentially expressed miRNA-mRNA regulatory relationships, generating a LUAD-related miRNA-mRNA regulation network.
The lncRNA-miRNA and miRNA-mRNA regulatory networks were combined to obtain a comprehensive lncRNA-miRNA-mRNA ceRNA regulatory network.
Functional and pathway annotation of mRNAs in the ceRNA network
In order to reveal LUAD-related biological functions and pathways, GO (gene ontology) biological processCitation27 analysis and KEGG (Kyoto Encyclopedia of Genes and Genomes) pathway analysisCitation28 were performed for mRNAs in the ceRNA regulatory network. Fisher’s exact test was used during the enrichment process. Fisher’s score could be calculated according to and the following equation:
Table 1 The parameters for calculating Fisher’s score
Construction of SVM classification model
The optimal subset of feature genes used for SVM classification model was selected from differentially expressed mRNAs in the LUAD specific ceRNA network, using recursive feature elimination (RFE),Citation29 an algorithm of machine learning. Specifically, the optimal subset was selected through a leave-one-out cross-validation approach. Expression values of selected feature genes in the combination were used as eigenvalues to estimate the possibility that a sample belonged to certain classification. Based on the possibility, a sample was classified to be LUAD or a normal sample. The optimal subset was the combination giving the best SVM classification accuracy for TCGA samples. The LUAD specific SVM classifier was built based on the optimal subset of feature genes.
GSE10072 and GSE43458 datasets were used to validate the robustness and transferability of the SVM classifier. This SVM classifier was trained with a fivefold cross validation strategy and its performance was assessed by establishing receiver operation characteristic (ROC) curve, followed by detection of prediction accuracy, sensitivity, specificity, positive prediction value, negative prediction value and AUC (area under ROC curve).
Identification of prognosis related mRNAs, miRNAs and lncRNAs
The expression value of each differentially expressed mRNA, miRNA and lncRNA and the survival information of each sample were extracted from TCGA dataset. Prognosis-associated lncRNAs, miRNAs and mRNAs were identified by univariate Cox regression using the survfit function of the survival package (version 2.40-1, https://cran.r-project. org/package=survival)Citation30 under R. Cancerous samples were divided into two groups based on the cutoff (median expression value), followed Kaplan–Meier curve analysis.
Results
Differentially expressed lncRNAs, miRNAs and mRNAs in LUAD samples
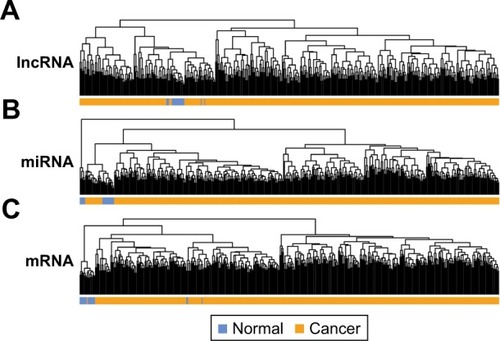
A total of 811 lncRNAs, 1,047 miRNAs and 18,013 mRNAs were obtained from mRNA-seq data. RNAs with low expression level (expression value less than 1.0) were removed, with 396 lncRNAs, 517 miRNAs and 14,012 mRNAs remained. Significant differentially expressed lncRNAs, miRNAs and mRNAs were obtained by comparing LUAD and normal samples. In total, 21, 53 and 925 differentially expressed lncRNAs, miRNAs and mRNAs were obtained in LUAD samples. Sample hierarchical cluster analysis was then performed based on the expression value of these differentially expressed RNAs. The results of heatmap () showed that LUAD samples were clustered together and discriminated from normal samples.
Figure 1 Hierarchical clustering analysis of TCGA samples using differentially expressed lncRNA (A), miRNA (B) and mRNA (C).
Key lncRNAs, miRNAs and mRNAs related to clinical features
In order to screen lncRNAs, miRNAs and mRNAs related to clinical features, LUAD samples were binary classified according to age (≥60 versus <60), gender (female versus male), pathologic M (M1 versus M0), pathologic N (N3 + N2 versus N0 + N1), pathologic T (T3 + T4 versus T1 + T2), pathologic stage (I + II versus III + IV), cancer status (with versus without), smoking history (yes versus no) and vital status (living versus deceased). The differentially expressed lncRNAs, miRNAs and mRNAs were further compared and identified between each two groups according to different clinical features, which were summarized in .
Table 2 Clinical features related differentially expressed lncRNAs, miRNAs and mRNAs
The miRNA-lncRNA and miRNA-mRNA regulatory relationships
Elucidation of the physiological roles of lncRNAs is challenging as complex and diverse mechanisms are involved.Citation11 We used bioinformatics methods to predict the roles of lncRNAs in regulating miRNAs in LUAD. The regulatory relationships between significant differentially expressed miRNAs and differentially expressed lncRNAs were predicted using miRecodeCitation20 and starBaseCitation21 database. We first acquired 264 lncRNA-miRNA regulation pairs from miRecode and 217 regulation pairs from starBase, of which lncRNAs were differentially expressed between LUAD and normal samples. Combining these two sets, a total of 291 lncRNA-miRNA pairs were obtained, 41 of which were LUAD related differentially expressed miRNAs. The 41 lncRNA-miRNA pairs were integrated to build a miRNA-lncRNA regulatory network consisting of 31 nodes, including 6 lncRNAs (3 upregulated versus 3 downregulated) and 25 miRNAs (6 upregulated versus 19 downregulated) ().
Figure 2 LUAD specific lncRNA-miRNA-mRNA ceRNA network. LUAD specific lncRNA-miRNA regulatory network (A), miRNA-mRNA regulatory network (B) and ceRNA network (C). The ceRNA network is acquired by integrating lncRNA-miRNA and miRNA-mRNA regulatory network. Squares, triangles and circles indicate lncRNAs, miRNAs and mRNAs, respectively. Upregulated lncRNAs, miRNAs and mRNAs in LUAD are shown as red and downregulated ones shown as green. Red lines and blue lines indicate lncRNA-miRNA and miRNA-mRNA regulatory relationships, whereas gray lines indicate protein–protein interactions of corresponding mRNAs.
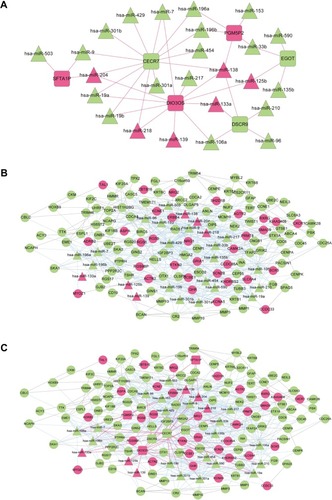
The regulatory relationships between significant differentially expressed miRNAs and significant differentially expressed mRNAs were obtained using miRTarBase database, a database providing the latest and broadest experimental validated miRNA-mRNA interactions.Citation22,Citation23 Most miRNAs in were predicted to have targeted differentially expressed mRNAs, except hsa-miR-139 and hsa-miR-590. A total of 126 differentially expressed mRNAs were found to be targets of these miRNAs. Based on the information of BioGRID, HPRD and DIP databases, PPIs corresponding to these target mRNAs were predicted. A miRNA-mRNA network was constructed by integrating miRNA-mRNA regulatory relationships and PPIs of target mRNAs. As shown in , the miRNA-mRNA regulatory network contained 25 miRNAs (including hsa-miR-139 and hsa-miR-590) and 126 mRNAs, which formed a total of 549 edges, 115 of which were mRNA-mRNA interactions and 434 were miRNA-mRNA regulation relationships.
Construction of lncRNA-miRNA-mRNA ceRNA network
To provide an insight about how lncRNAs and miRNAs cooperate to regulate mRNAs in LUAD, a ceRNA network () was constructed, through the integration of lncRNA-miRNA network and miRNA-mRNA network. All nodes in the ceRNA network were LUAD related differentially expressed lncRNAs, miRNAs or mRNAs. A total of 157 nodes were included in the ceRNA network, including 6 lncRNAs, 25 miRNAs (including hsa-miR-139 and hsa-miR-590) and 126 mRNAs. In total, 588 edges were formed, including 39 lncRNA-miRNA regulation relationships, 434 miRNA-mRNA regulation relationships and 115 PPIs of corresponding mRNAs.
In order to reveal the functional processes involved in LUAD development and progression, mRNAs in the ceRNA network () were subjected to Fisher’s exact test-based GO biological process analysis. We acquired 18 significantly related GO biological processes, most of which were associated with cell cycle (). We also performed KEGG pathway analysis for mRNAs in the ceRNA network, and 5 significant KEGG pathways were identified, including ErbB signaling pathway, cell cycle, homologous recombination, neuroactive ligand-receptor interaction and pathways in cancer ().
Table 3 Functional annotation of mRNAs in the ceRNA network
SVM classification model of cancerous samples
In order to provide an efficient and reliable molecular tool for LUAD diagnosis, we build a LUAD specific SVM classifier based on the feature genes associated with LUAD. Optimal subset of feature genes was selected from differentially expressed mRNAs in the ceRNA network () using RFE.Citation29 The accuracy reached the best (95.3%) when the number of selected feature genes in the optimal subset was 44 (). The 44 selected feature genes were summarized in and used for the construction of LUAD specific SVM classifier. Scatter plot of TCGA samples based on the SVM classifier was shown as .
Table 4 Selected feature genes from the ceRNA network
Figure 3 Construction and validation of the LUAD specific SVM classifier. (A) Feature gene selection based on recursive feature elimination. The prediction accuracy versus the number of selected feature genes is plotted as blue line. The red dashed line labels the best prediction accuracy (95.3%, 442 out of 464 TCGA samples), with the corresponding number of selected feature genes being 44. (B) Scatter plot of TCGA samples based on the LUAD specific SVM classifier. (C) ROC curves of TCGA (black), GSE10072 (blue) and GSE43458 (orange) datasets generated using the LUAD specific SVM classifier. AUCs are calculated to be 0.996, 0.963 and 0.985 for each data.
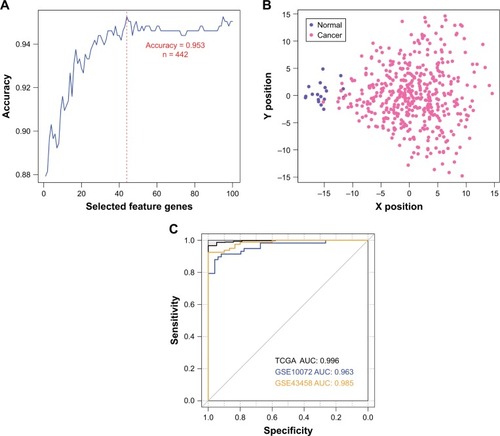
To validate the robustness and transferability of the SVM classifier, two independent datasets under accession number of GSE10072Citation16 and GSE43458Citation15 were downloaded from GEO. After normalization, samples in the validation datasets were classified using the SVM classifier. As a result, samples in the GSE10072 dataset could be correctly classified with an accuracy of 90.7% (97 out of 107 samples), and samples in the GSE43458 dataset could be classified with a precision of 97.3% (107 out of 110 samples) (). Besides prediction accuracy, the performance of our SVM classification model were also assessed using sensitivity, specificity, positive prediction value, negative prediction value and AUC (area under ROC curve) (, ).
Table 5 Performance of support vector machine classifier in training and validation datasets
The lncRNAs, miRNAs and mRNAs related to prognosis
Prognosis-related RNAs for LUAD were identified from differentially expressed lncRNAs, miRNAs and mRNAs using univariate cox analysis. In total, 5 lncRNAs, 6 miRNAs and 44 mRNAs were identified to be prognosis related (). Among them, PGM5P2 (phosphoglucomutase 5 pseudogene 2) and SFTA1P (surfactant associated 1) were lncRNAs and hsa-miR-96 and hsa-miR-204 were miRNAs in the ceRNA network. RGS20 (regulator of G protein signaling 20), RGS9BP (RGS9-binding protein), FGB (fibrinogen beta chain) and INA (alpha-internexin) were mRNAs in the feature subset of the SVM classifier. According to the ceRNA network (), two miRNA-mRNA pairs and an lncRNA-miRNA-mRNA triplet were formed among these prognosis related RNAs, specifically hsa-miR-96-INA, hsa-miR-96-RGS20 and SFTA1P-hsa-miR-204-RGS20.
Table 6 Prognosis related lncRNAs, miRNAs and mRNAs
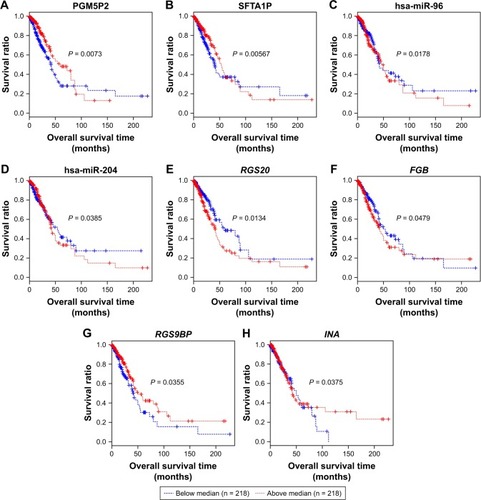
We further performed Kaplan–Meier curve analyses for these prognosis-related RNAs (). Our results showed that LUAD patients with higher expression level of PGM5P2, SFTA1P, RGS9BP and INA had a better prognosis, and patients with higher expression level of hsa-miR-96, hsa-miR-204, RGS20 and FGB had a worse prognosis (). Meanwhile, the expression level of PGM5P2, SFTA1P, hsa-miR-204 and RGS9BP were downregulated in LUAD samples whereas hsa-miR-96, RGS20, FGB and INA were upregulated.
Figure 4 Kaplan–Meier analysis of prognosis related lncRNAs, miRNAs and mRNAs. (A, B) Kaplan–Meier curves of two lncRNAs PGM5P2 and SFTA1P. (C, D) Kaplan–Meier curves of two miRNAs hsa-miR-96 and hsa-miR-204. (E–H) Kaplan–Meier curves of four mRNAs RGS20, RGS9BP, FGB and INA. Red and blue lines indicate patient groups with expression level above and below median value, respectively. P-value indicates the significance of difference.
Discussion
In the present study, we constructed a ceRNA network delineating interplays among differentially expressed lncRNAs, miRNAs and mRNAs between LUAD and normal samples. An optimal subset of 44 selected feature genes was identified in the network and the SVM classifier SVM constructed with these 44 feature genes could accurately classify samples in both TCGA training data and GSE10072 and GSE43458 validation data. Remarkably, we also identified key prognosis-related RNAs in the ceRNA network, including 2 miRNAs (hsa-miR-96, hsa-miR-204), 2 lncRNAs (PGM5P2, SFTA1P) and 4 selected feature mRNAs (RGS20, RGS9BP, FGB, INA). Among the 8 prognostic RNAs, higher expression level of PGM5P2, SFTA1P, RGS9BP and INA were shown to correlate with better prognosis, indicating tumor-suppressive roles of these RNAs. Meanwhile, higher expression levels of hsa-miR-96, hsa-miR-204, RGS20 and FGB were found to correlate with worse prognosis, indicating tumor-promoting roles of these RNAs.
Most of these RNAs have been previously shown to be involved in certain types of cancers. INA is a neuronal intermediate filament protein,Citation31 correlated with better prognosis of glioblastoma.Citation32,Citation33 RGS20 is a negative regulator of heterotrimeric G proteins and may promote cancer cell metastasis by upregulating vimentin and downregulating E-cadherin.Citation34,Citation35 FGB is one component of fibrinogen, which is a critical for tumor cell proliferation, angiogenesis and cancer metastasis.Citation36,Citation37 Elevated plasma level of fibrinogen is a strong indicator of poor prognosis of various tumors, such as breast tumor,Citation38 prostate cancer,Citation39 and lung cancer.Citation40 SFTA1P is a lncRNA tumor suppressor functioning through inhibiting LUAD cell migration, invasion and metastasis.Citation41–Citation43 RGS9BP is an anchor protein of RGS9, was also identified as being involved in bladder cancer,Citation44 though the role it played remained elusive. The function of PGM5P2 is also unclear, however, it is implicated that PGM5P2 may be involved in pro-apoptosis and antiangiogenesis process,Citation45 which is essential for the development and progression of cancer. Considering their roles in different cancer types, it is reasonable that these genes may play a role in the development and progression of LUAD. However, further studies are still needed to gain an insight into the roles of these molecules in LUAD.
The remaining two RNAs, however, was found to play controversial roles in different cancer types. hsa-miR-96 is involved in various cancers, however, divergent roles are reported with respect to different cancer types.Citation46,Citation47 It is shown that hsa-miR-96 can suppress tumor invasion in renal cell carcinomaCitation47 and colorectal cancer,Citation48 but it can promote cancer cell proliferation and invasion in breast cancer,Citation49,Citation50 bladder cancerCitation46 and lung cancer.Citation51 hsa-miR-204 has been reported to be a tumor suppressor in clear cell renal cell carcinoma, induced by VHL and functioning through inhibiting macroautophage by targeting LC3B.Citation52 Besides, its variant hsa-miR-204-5p is also involved in endometrial carcinoma, and is shown to suppress the clonogenic growth, migration and invasion of endometrial carcinoma cells.Citation53 However, we found that it played a tumor-promoting role in LUAD. Therefore, we speculate that hsa-miR-96 and hsa-miR-204 may also play divergent roles in different cancer types, which should be addressed in future experimental research.
Further, two miRNA-mRNA regulation pairs and an lncRNA-miRNA-mRNA regulation triplet were formed among these prognosis related RNAs according to the ceRNA network. Specifically, hsa-miR-96 formed two miRNA-mRNA regulation pairs with INA and RGS20, whereas hsa-miR-204 formed an lncRNA-miRNA-mRNA regulation triplet with SFTA1P and RGS20. We speculate that hsa-miR-96 may target INA and RGS20 in LUAD, whereas hsa-miR-204 may target RGS20 and regulated by SFTA1P. However, further experimental and functional studies are needed to disclose and confirm the pathways these RNAs involved.
However, the limitation of SVM classification model on evaluating the selected feature genes is lack of experiment validation. Further experiments, such as quantitative reverse-transcription PCR and/or western blot methods are still required to confirm our results. Moreover, the Kaplan–Meier curve analysis for these 8 prognosis-related RNAs was performed individually. If the prognostic value of these RNAs is validated by various combination analyses, more valuable results will be obtained for predicting the prognosis of LUAD.
In summary, we constructed a LUAD-specific SVM classification model based on the LUAD-related ceRNA network. The SVM classifier may serve as a novel diagnostic predictor of LUAD. Moreover, we also identified 8 key molecular markers with prognostic value from the ceRNA network, including PGM5P2, SFTA1P, hsa-miR-204, hsa-miR-96, RGS20, RGS9BP, FGB and INA. These molecular markers may be promising prognostic markers and drug targets in future clinical practice.
Acknowledgments
This work was supported by Chinese Medicine Science and Technology Development Project Fund of Shandong Province (project no 2017-200), Postdoctoral Applications Research Project Fund of Qingdao (project no 2016055) and The Affiliated Hospital of Qingdao University Youth Research Fund (2016).
Disclosure
All authors declared that they have no conflicts of interest in this work.
References
- ImielinskiMBergerAHHammermanPSMapping the hallmarks of lung adenocarcinoma with massively parallel sequencingCell201215061107112022980975
- StewartBWWildCWorld cancer report 2014Lyon FranceInternational Agency for Research on Cancer, World Health Organization
- SaitoMSuzukiHKonoKTakenoshitaSKohnoTTreatment of lung adenocarcinoma by molecular-targeted therapy and immunotherapySurg Today20184811828280984
- CamidgeDRPaoWSequistLVAcquired resistance to TKIs in solid tumours: Learning from lung cancerNat Rev Clin Oncol201411847348124981256
- TakahashiTNauMMChibaIp53: A frequent target for genetic abnormalities in lung cancerScience198924649294914942554494
- SinghAMisraVThimmulappaRKDysfunctional KEAP1-NRF2 interaction in non-small-cell lung cancerPLoS Medicine2006310e42017020408
- Sanchez-CespedesMParrellaPEstellerMInactivation of LKB1/STK11 is a common event in adenocarcinomas of the lungCancer Res200262133659366212097271
- MorrisKVMattickJSThe rise of regulatory RNANat Rev Genet201415642343724776770
- LizJEstellerMlncRNAs and microRNAs with a role in cancer developmentBiochim Biophys Acta20161859116917626149773
- GarzonRCalinGACroceCMMicroRNAs in CancerAnnu Rev Med20096016717919630570
- HuarteMThe emerging role of lncRNAs in cancerNat Med201521111253126126540387
- TayYRinnJPandolfiPPThe multilayered complexity of ceRNA crosstalk and competitionNature2014505748334435224429633
- SuiJLiYHZhangYQIntegrated analysis of long non-coding RNA-associated ceRNA network reveals potential lncRNA biomarkers in human lung adenocarcinomaInt J Oncol20164952023203627826625
- LiDSAiniwaerJLSheyhidingIZhangZZhangLWIdentification of key long non-coding RNAs as competing endogenous RNAs for miRNA-mRNA in lung adenocarcinomaEur Review Med Pharmacol Sci2016201122852295
- KabboutMGarciaMMFujimotoJETS2 mediated tumor suppressive function and MET oncogene inhibition in human non-small cell lung cancerClin Cancer Res201319133383339523659968
- LandiMTDrachevaTRotunnoMGene expression signature of cigarette smoking and its role in lung adenocarcinoma development and survivalPLoS One200832e165118297132
- CarvalhoBBengtssonHSpeedTPIrizarryRAExploration, normalization, and genotype calls of high-density oligonucleotide SNP array dataBiostatistics20078248549917189563
- RobinsonMDMcCarthyDJSmythGKedgeR: A bioconductor package for differential expression analysis of digital gene expression dataBioinformatics201026113914019910308
- GeYDudoitSSpeedTPResampling-based multiple testing for microarray data analysisTest2003121177
- JeggariAMarksDSLarssonEmiRcode: A map of putative microRNA target sites in the long non-coding transcriptomeBioinformatics201228152062206322718787
- LiJ-HLiuSZhouHQuL-HYangJ-HstarBase v2. 0: decoding miRNA-ceRNA, miRNA-ncRNA and protein–RNA interaction networks from large-scale CLIP-Seq dataNucleic Acids Res201442D1D92D9724297251
- HsuS-DLinF-MWuW-YmiRTarBase: A database curates experimentally validated microRNA–target interactionsNucleic Acids Res201139Suppl 1D163D16921071411
- ChouC-HChangN-WShresthaSmiRTarBase 2016: Updates to the experimentally validated miRNA-target interactions databaseNucleic Acids Res201644D1D239D24726590260
- Chatr-AryamontriABreitkreutzBJOughtredRThe BioGRID interaction database: 2015 updateNucleic Acids Res201543Database issueD470D47825428363
- Keshava PrasadTSGoelRKandasamyKHuman protein reference database – 2009 updateNucleic Acids Res200937Database issueD767D77218988627
- SalwinskiLMillerCSSmithAJPettitFKBowieJUEisenbergDThe Database of interacting proteins: 2004 updateNucleic Acids Res200432Database issueD449D45114681454
- AshburnerMBallCABlakeJAGene ontology: Tool for the unification of biology. The Gene Ontology ConsortiumNat Genet2000251252910802651
- KanehisaMGotoSKEGG: Kyoto encyclopedia of genes and genomesNucleic Acids Res2000281273010592173
- BaurBBozdagSA feature selection algorithm to compute gene centric methylation from probe level methylation dataPLoS One2016112e014897726872146
- SinghRMukhopadhyayKSurvival analysis in clinical trials: Basics and must know areasPerspect Clin Res20112414514822145125
- LariviereRCJulienJPFunctions of intermediate filaments in neuronal development and diseaseJ Neurobiol200458113114814598376
- SuhJHParkCKParkSHAlpha internexin expression related with molecular characteristics in adult glioblastoma and oligodendrogliomaJ Korean Med Sci201328459360123579442
- MokhtariKDucrayFKrosJMAlpha-internexin expression predicts outcome in anaplastic oligodendroglial tumors and may positively impact the efficacy of chemotherapy: European Organization for Research and Treatment of Cancer trial 26951Cancer2011117133014302621246521
- LiQJinWCaiYRegulator of G protein signaling 20 correlates with clinicopathological features and prognosis in triple-negative breast cancerBiochemi Biophys Res Commun20174853693697
- YangLLeeMMLeungMMWongYHRegulator of G protein signaling 20 enhances cancer cell aggregation, migration, invasion and adhesionCell Signal201628111663167227495875
- PerisanidisCPsyrriACohenEEPrognostic role of pretreatment plasma fibrinogen in patients with solid tumors: A systematic review and meta-analysisCancer Treat Rev2015411096097026604093
- PalumboJSDegenJLMechanisms coupling the hemostatic system to colitis-associated cancerThromb Res2010125Suppl. 2S39S4320434003
- Krenn-PilkoSLangsenlehnerUStojakovicTPichlerMGergerAKappKSLangsenlehnerTAn elevated preoperative plasma fibrinogen level is associated with poor disease-specific and overall survival in breast cancer patientsBreast201524566767226346586
- ThurnerEMKrenn-PilkoSLangsenlehnerUThe association of an elevated plasma fibrinogen level with cancer-specific and overall survival in prostate cancer patientsWorld J Urol201533101467147325475065
- PalumboJSKombrinckKWDrewAFGrimesTSKiserJHDegenJLBuggeTHFibrinogen is an important determinant of the metastatic potential of circulating tumor cellsBlood200096103302330911071621
- ZhaoWLuoJJiaoSComprehensive characterization of cancer subtype associated long non-coding RNAs and their clinical implicationsSci Rep20144659125307233
- ZhangHXiongYXiaRWeiCShiXNieFThe pseudogene-derived long noncoding RNA SFTA1P is down-regulated and suppresses cell migration and invasion in lung adenocarcinomaTumour Biol2017392101042831769141828231733
- HuangGQKeZPHuHBGuBCo-expression network analysis of long noncoding RNAs (IncRNAs) and cancer genes reveals SFTA1P and CASC2 abnormalities in lung squamous cell carcinomaCancer Biol Ther201718211512228118064
- YangZLiCFanZSingle-cell sequencing reveals variants in ARID1A, GPRC5A and MLL2 driving self-renewal of human bladder cancer stem cellsEur Urol201771181227387124
- MiaoYCuiLChenZZhangLGene expression profiling of DMU-212-induced apoptosis and anti-angiogenesis in vascular endothelial cellsPharm Biol201654466066626428916
- WuZLiuKWangYXuZMengJGuSUpregulation of microRNA-96 and its oncogenic functions by targeting CDKN1A in bladder cancerCancer Cell Int20151510726582573
- YuNFuSLiuYmiR-96 suppresses renal cell carcinoma invasion via downregulation of Ezrin expressionJ Exp Clin Cancer Res20153410726419932
- RessALStiegelbauerVWinterEMiR-96-5p influences cellular growth and is associated with poor survival in colorectal cancer patientsMol Carcinog201554111442145025256312
- LinHDaiTXiongHUnregulated miR-96 induces cell proliferation in human breast cancer by downregulating transcriptional factor FOXO3aPLoS One2010512e1579721203424
- GuttillaIKWhiteBACoordinate regulation of FOXO1 by miR-27a, miR-96, and miR-182 in breast cancer cellsJ Biol Chem200928435232042321619574223
- GuoHLiQLiWZhengTZhaoSLiuZMiR-96 downregulates RECK to promote growth and motility of non-small cell lung cancer cellsMol Cell Biochem20143901–215516024469470
- MikhaylovaOStrattonYHallDVHL-regulated MiR-204 suppresses tumor growth through inhibition of LC3B-mediated autophagy in renal clear cell carcinomaCancer Cell201221453254622516261
- BaoWWangHHTianFJA TrkB-STAT3-miR-204-5p regulatory circuitry controls proliferation and invasion of endometrial carcinoma cellsMol Cancer20131215524321270