
Abstract
Introduction
Lung adenocarcinoma (LAC) accounts for more than a half of non-small cell lung cancer with high morbidity and mortality. Progression of treatment has not accelerated the improvement of its prognosis. Hence, it is an urgent need to develop novel biomarkers for its early diagnosis and treatment.
Materials and methods
In this study, we proposed to identify LAC survival-related genes through comprehensive analysis of large-scale gene expression profiles. LAC gene expression data sets were obtained from The Cancer Genome Atlas (TCGA). Identification of differentially expressed genes (DEGs) in LAC compared with adjacent normal lung tissues was first performed followed by univariate Cox regression analysis to obtain genes that are significantly associated with LAC survival (SurGenes). Then, we conducted sure independence screening (SIS) for SurGenes to identify more reliable genes and the prognostic signature for LAC survival prediction. Another two lung cancer data sets from TCGA and Gene Expression Omnibus (GEO) were used for the validation of prognostic signature.
Results
A total of 20 genes were obtained, which were significantly associated with the overall survival (OS) of LAC patients. The prognostic signature, a weighted linear combination of the 20 genes, could successfully separate LAC samples with high OS from those with low OS and had robust predictive performance for survival (training set: p-value <2.2×10⁻¹⁶; testing set: p-value =2.04×10⁻⁵, area under the curve (AUC) =0.615). Combined with GEO data set, we obtained four genes, that is, FUT4, SLC25A42, IGFBP1, and KLHDC8B that are found in both the prognostic signature and DEGs of LAC in GEO data set.
Discussion
The prognostic signature combined with multi-gene expression profiles provides a moderate OS prediction for LAC and should be helpful for appropriate treatment method selection.
Keywords:
Introduction
Lung cancer is both the most common cancer and the leading cause of cancer-related mortality worldwide.Citation1,Citation2 The 5-year survival rate after diagnosis of lung cancer is 15.6%, which is lower than the survival rate for colon, breast, or prostate cancer.Citation3 Non-small cell lung cancer (NSCLC) accounts for 85% of all lung cancers, and lung adenocarcinoma (LAC) is the most diagnosed histological subtype of NSCLC.Citation4,Citation5 The lung cancer is most commonly diagnosed at a late stage, which results in a poor patient survival rate. Although advanced progression had been made in treatment, including surgical, medical, and radiotherapeutic interventions, the long-term survival rate of patients diagnosed with primary LAC has not improved.Citation6,Citation7 Previous studies have reported that LAC tends to grow and spread faster than other types of lung cancer and accounted for almost half of all lung cancer.Citation8 To date, the survival of LAC patients remains dismal and 5-year survival rate is onlŷ10%.Citation9 The molecular mechanisms of LAC carcinogenesis and progression remain unclear.
The prognosis of lung cancer mainly depends on the probability of recurrence and metastasis. Recently, many efforts were made to identify the potential molecules that are the prognosis markers of lung cancer patients. Cui et alCitation10 reported a significant association between the prognosis of LAC patients and the expression of fibulin-1, a member of fibulin gene family, and showed that overexpression of fibulin-1 in patients was positively associated with the overall survival (OS) of LAC patients. This result suggested that fibulin-1 may possess a novel role in LAC prognosis and act as a potential molecular target for the detection and treatment of LAC.Citation10 HoxB9 is a member of Hox family and plays an important role in cancer progression. Zhan et al found that enhanced expression of HoxB9 correlates with T classification and more lymph node metastasis, leading to a poor prognosis of LAC patients.Citation11 A strata analysis of CCND1 gene was performed in the LAC patients, the results of which showed that overexpression of CCND1 was significantly associated with poor prognosis and low OS of LAC, suggesting that CCND1 may act as a potential predictive marker or molecular target for the treatment and prognosis of LAC patients.Citation12 Although some molecular targets were identified and regarded as potential markers for the prognosis of LAC patients at present, the predicting accuracy of those molecules was insufficient. Identification of novel biomarkers would be one of the promising approaches for developing new diagnostic, therapeutic, and prognostic strategies of LAC.
Biomarkers possess some special features, such as measurable, dependable, inexpensive, and high sensitivity and specificity. These features confer the biomarkers as a potential tool in screening and recurrence detection of cancer.Citation13 Diverse techniques including biological information indexing and database provision have been developed for identifying novel biomarkers in many diseases, which are helpful for us to better understand the biological reactions including invasion, metastasis, proliferation, and prognosis. Bioinformatics is recently growing in the field of cancer biology, and several public databases, such as The Cancer Genome Atlas (TCGA), Gene Expression Omnibus (GEO), Embase, Surveillance, and Epidemiology and End Results, are open access for researchers.Citation14 In this study, the transcriptomes of more than 500 LAC samples obtained from TCGA were analyzed. Through the combination of univariate survival analysis and sure independence screening (SIS)-based dimensionality reduction, 20 genes were identified as the potential prognosis markers. Besides, we validated the predictive accuracy of the 20 genes in another data set from TCGA which contains more than 200 LAC samples. Our study should provide important clues for the LAC survival prediction and therapeutic strategy selection for different patients.
Materials and methods
Study population
The training set was downloaded from TCGA including 521 LAC samples diagnosed at 33–88 years of age and 488 (~93.67%) of them were classified as stage I ~ stage III. Seventeen samples were removed because of the lack of survival information. The clinicopathological features of patients are provided in . One hundred LAC patients had both tumor and adjacent normal tissues, which were used for the differential expression analysis. Another LAC data set consisting of 230 LAC samples from TCGA was used as validation set with 28 samples removed due to missing survival information. We downloaded an LAC gene expression data set from GEO with the accession number GSE85841 consisting of eight LAC and eight adjacent normal tissues for the confirmation of differential expression analysis in the training set.
Gene expression data analysis
Raw read counts of transcriptomic data from TCGA were normalized by quartile normalization method and logarithmic transformed to a normal distribution. DESeq2Citation15 bioconductor package was used for the identification of differentially expressed genes (DEGs) in LAC samples compared with adjacent normal tissues with the criteria of adjusted p-value <0.01 and absolute log2-based fold change >1. For gene expression data from GEO, we used GEO2R online tool to conduct differential expression analysis with the thresholds of adjusted p-value <0.01 and absolute log2-based fold change >1 as significantly differential expression.
Screening of LAC survival-related genes
We conducted a two-step method for the screening of LAC survival-related genes. First, univariate Cox regression analysis between expression values of DEGs and survival of samples in training set was performed, and the significant genes were abbreviated as SurvGenes. The relatively high number of SurvGenes in contrast to the small sample number might lead to overfitting. Second, we used SIS based on LASSO Cox penalized regression model to identify more important variables and construct a multi-gene-based prognostic signature for OS prediction. The two-step screening method should be more robust and was performed via SIS R package.
Statistical analysis
We used the multi-gene-based prognostic signature to calculate risk score (RS) for every sample and divided the samples into two groups according to the median RS. Kaplan–Meier survival curves were drawn and compared between the subgroups via log-rank tests. Receiver operating characteristic (ROC) curves were drawn for the predicted 3-year OS based on the nearest neighbor method, and area under the curve (AUC) was calculated. AUC p-values were obtained through bootstrap resampling.
All statistical analyses were performed through R 3.4.1. Two-sided p-value <0.05 was considered as statistically significant.
Results
Candidate genes
After preprocessing, we first conducted clustering analysis for samples in the training set based on their stages via the top two principal components. As a result, LAC samples of stage I ~ stage IV could not be separated from each other (). Hence, it is important to identify other diagnosis biomarkers for the assistance of personalized treatment.
Figure 1 Principal component analysis of raw read count and correlation analysis between selected genes expression values and sample survival in training set. (A) Principal component analysis of raw read count of samples in different clinicopathological stages in training set. Red, blue, green, and purple dots represent stage I, stage II, stage III, and stage IV, respectively. (B–D) Spearman correlation between expression value of C3ORF18, CERS4, and FUT4 and survival times of samples in training set. X-axis and Y-axis represent gene expression value and sample survival time, respectively.
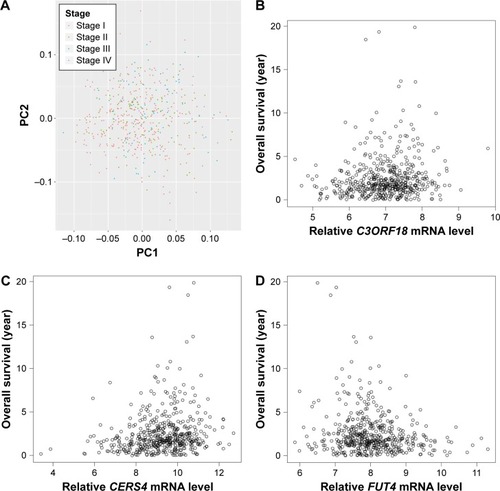
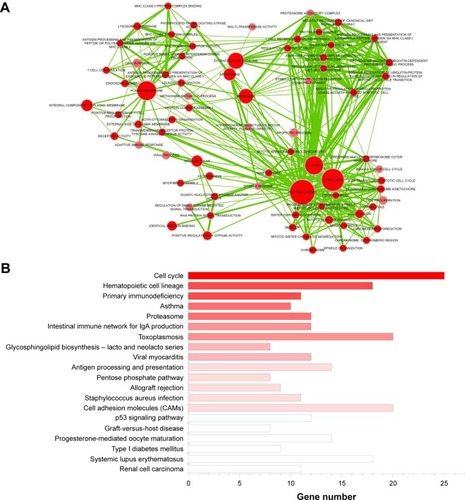
Differential expression analysis was conducted based on the 100 LAC patients with both tumor and adjacent normal tissues in the training set. A total of 2,011 genes with adjusted p-value <0.01 and absolute log2-based fold change >1 were identified. We then used univariate Cox regression analysis to evaluate associations between DEGs and OS in the training set and identified 1,425 SurvGenes with p-value <0.05. illustrates the Spearman correlation between the expression values of three of the 1425 genes, that is, C3ORF18 (cor =0.177, p-value =6.30×10⁻⁵), CERS4 (cor =0.125, p-value =4.85×10⁻³), and FUT4 (cor =−0.178, p-value =6.063×10⁻⁵), and OS in years. Through functional enrichment analysis in the Database for Annotation, Visualization and Integrated Discovery,Citation16 1,425 SurvGenes were found to be significantly enriched in biological processes/pathways related to cell cycle, immune response ().
Figure 2 Functional enrichment analysis of SurvGenes via DAVID. (A) Clustering analysis of significantly enriched biological process (BP) terms. Nodes and edges are BP terms and their interactions, respectively. Larger node size indicates more contained genes and darker color indicates more significant, that is, smaller p-value. Thicker line indicates more overlaps between the two BP terms. (B) Significantly enriched pathways. X-axis is gene number contained in pathways. Darker color indicates more significant, that is, smaller p-value.
SIS analysis was used to further identify robust gene combination. Twenty of the 1,425 candidate SurvGenes were obtained, including CERS4, FUT4, C3ORF18, CYP17A1, ASPM, HJURP, LOC645166, DENND1C, SLC25A42, CCNA2, LDHA, IGFBP1, SLC2A1, DAAM2, RGS20, MFI2, LDLRAD3, KLHDC8B, CREG2, and SPATA6. shows their regression coefficients and forward selection Akaike information criterion.
Table 1 The 20-gene signatures screened by forward selection and their regression coefficients
Differential expression analysis of LAC data sets from GEO obtained a total of 1,282 DEGs in LAC compared with adjacent normal tissues. Intersecting those DEGs and the 20 candidate genes, we identified four overlaps, including FUT4, SLC25A42, IGFBP1, and KLHDC8B. In the following analysis, we used both the prognostic signature of 20 candidate gene combination and the prognostic signature of four overlap combination for OS prediction. The prognostic score for each sample based on individualized values of the 20 genes: prognostic score20 =0.1375 × CERS4 − 0.5066 × FUT4 + 0.08425 × C3ORF18 + 0.291 × CYP17A1 − 0.436 × ASPM + 0.3888 × HJURP − 0.154 × LOC645166 + 0.3972 × DENND1C − 0.2404 × SLC25A42 + 0.1753 × CCNA2 − 0.06559 × LDHA − 0.09503 × IGFBP1 + 0.2518 × SLC2A1 + 0.02896 × DAAM2 − 0.03843 × RGS20 − 0.08505 × MFI2 − 0.2181 × LDLRAD3 + 0.1977 × KLHDC8B + 0.05795 × CREG2 + 0.10865 × SPATA6; prognostic score based on the four genes: prognostic score4 =−0.4321 × FUT4 + 0.07663 × SLC25A42 − 0.05506 × IGFBP1 + 0.2943 × KLHDC8B.
Prognostic signature for LAC patients
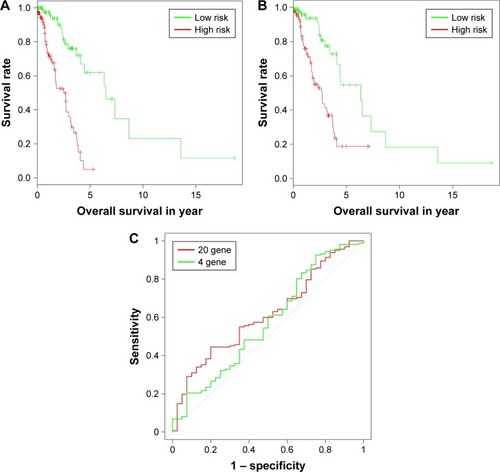
We divided the patients in testing sets into two subgroups based on the expression values of the 20 candidate genes () and four overlaps () through hierarchical clustering. Log-rank test was used for the testing of differences of OS between subgroups. As a result, both the 20 candidate genes and the four overlaps could significantly separate LAC patients with high OS from those with low OS as shown in (p-value =5.35×10⁻¹⁰) and (p-value =4.44×10⁻⁴), respectively. Furthermore, we also divided the patients in testing set into two subgroups according to their prognostic score20 and prognostic score4 based on their median values and tested the significance of differences of OS between subgroups through log-rank test. As shown in , both prognostic score20 (p-value =3.66×10⁻⁹) and prognostic score4 (p-value =2.04× 10⁻⁵) could robustly predict LAC survival. To evaluate the sensitivity of the two prognostic scores, we predicted OS through the nearest neighbor method for ROC curves of censored survival value. As a result, they could effectively predict 3-year OS (AUC of prognostic score20 =0.615, AUC of prognostic score4 =0.5731; p-value <0.05). The ROC curves for the expression of 20 genes were shown in .
Figure 3 Clustering and Kaplan–Meier analysis in testing set. (A and B) The hierarchical clustering of samples in testing set based on the 20 sure independent screening (SIS)-resulted genes and four overlaps. Color bar at the top of the heatmap represents stages. (C and D) The Kaplan–Meier plot of different clusters obtained based on prognostic signature of 20 and four genes, respectively.
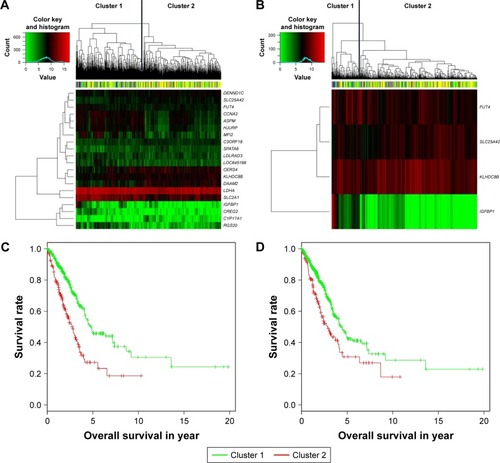
Figure 4 Sensitivity analysis for prognostic score20 and prognostic score4 in testing set. (A and B) The Kaplan–Meier plot of samples in testing set with higher and lower prognostic score20 and prognostic score4, respectively. (C) Receiver operating characteristic curves for the expression of 20 genes and four genes.
Discussion
Lung cancer is the leading cause of cancer-related death in men and women worldwide.Citation17 LAC was a main type of lung cancer and accounts for more than half the incidence of morbidity and mortality.Citation8 A recent study by TCGA revealed potential novel drivers such as NF1, MET, ERBB2, and RIT1 which occur in 13% of cases and are enriched in samples lacking an activated oncogene.Citation18 Accumulated evidence suggested that the abnormally expressed genes in lung cancer, including LAC, were strongly associated with the prognosis and could be regarded as the potential prognostic factors, such as Fibulin-1, HoxB9, TFEB, and BCL2.Citation10,Citation11,Citation19,Citation20 The predictive accuracy of those molecules was deemed insufficient because of no consideration on the condition of simultaneous changes in multiple genes. Several previous studies have focused on the differential expression or prognosis of gene signatures for their potential in LAC diagnosis and treatment.Citation21–Citation23 Combination of those two strategies was applied for the screening of LAC biomarkers, which should be more reliable. Here, we used high-throughput method of searching for genetic differences of multiple genes associated with LAC prognosis and conducted the comprehensive analysis to obtain more reliable genes and the prognostic signature for LAC survival prediction.
In this study, 521 LAC samples and 504 transcriptomes of them were analyzed as training set to identify survival-related biomarkers. Another data set consisting of 230 LAC samples was used as testing set to validate biomarker reliability. A microarray expression data set which included eight LAC samples and eight adjacent tissue samples, the DEGs in the LAC samples compared to adjacent tissues were identified. After univariate survival analysis followed by SIS-based dimensional reduction process, 20 survival-related genes were retained. We identified four genes that exist both in the 20 genes and DEGs of GEO data sets, which might be more reliable biomarkers for LAC diagnosis and treatment.
Based on the tumor grading, we performed sample clustering by the principal component analysis in the training data set. showed that all the samples with different tumor stage were clustered together, suggesting an inaccurate grading standard of tumor, which might induce inaccurate prediction of cancer prognosis. Therefore, the construction-of-molecular model using the survival-related genes is needed.
In our research, univariate survival analysis of the DEGs in LAC samples of the training data set identified C3ORF18, FUT4, and CERS4 as the top three most significant genes that are associated with LAC survival. FUT4 is one of key enzymes to catalyze the α1,3-fucosylation of tumor sugar antigen Lewis Y (LeY), which is a specific tumor-associated sugar antigen (TASA).Citation24 Overexpressed FUT4 was observed in the breast cancer patients, and it could be served as a novel biomarker in the diagnosis and prognosis of breast cancer.Citation25 FUT4 has been reported to be closely correlated to tumor proliferation, apoptosis, metastasis, and epithelial–mesenchymal transition.Citation26 Ceramide synthases (CerSs) are important enzymes that play a central role in the sphingolipid pathway.Citation27 CerSs have been implicated in cancer biology, especially in apoptosis, through the action of ceramide.Citation28 Wegner et al reported that upregulation of CERS4 in breast cancer cells is important for cell proliferation and tumor development.Citation29 In this study, expression values of C3ORF18 and CERS4 were positively correlated with the LAC OS, and expression value of FUT4 shows a negative correlation with the OS in training data set (), which were consistent with the result of regression analysis (). These results suggested that the expression levels of C3ORF18, FUT4, and CERS4 were strongly associated with the OS of LAC patients.
Except for C3ORF18, FUT4, and CERS4, many invasion-, metastasis-, and prognosis-related genes were included in the 20 genes, such as CYP17A1, ASPM, HJURP, and so on. CYP17A1 is one of the key enzymes involved in estrogen biosynthesis and was upregulated in various cancers.Citation30,Citation31 Abnormal expression of CYP17A1 might be used as a post-diagnostic marker and for choosing the right treatment method.Citation32 ASPM is an essential factor for normal mitotic spindle function in embryonic neuroblasts.Citation33 ASPM was overexpressed in many tumor cells and played an important role in malignant transformation and tumor progression.Citation34 Histone chaperone holliday junction recognition protein (HJURP) is responsible for depositing the histone variant centromere protein A at the centromere and is upregulated in lung and breast cancer.Citation35,Citation36 Montes de Oca et al reported that the abnormal expression of HJURP could discriminate the favorable and unfavorable outcomes within the luminal A subtype of breast carcinoma and could be an independent prognostic marker for luminal A patients.Citation37
In recent years, some prognostic models based on cancer-related genes were constructed, and the predictive performances of these models were validated in different cancer types. Choi et al investigated the genetic variation in immune-related genes in breast cancer of Korean women, and the results showed that the genetic polymorphisms in immune-related genes, including IL-6R, IL-8, IL-10RB, IL-12A, and IL-12B, had significant relevance to breast cancer prognosis among Korean women.Citation38 A multivariable predictive model for relapse-free survival of neoadjuvant-resistant rectal cancer patients was constructed, which consists of gender, pT stage, N status, CXCR4, and CXCR7. Higher expression of CXCR4 was significantly correlated with a shorter relapse-free survival and cancer-specific survival, and CXCR4 could be regarded as a new therapeutic target in rectal cancer.Citation39 In this study, the prognostic model constructed with the 20 genes for the LAC was evaluated and compared with the model constructed with the four overlapping genes in the testing data set. Both of the two models could robustly predict LAC OS and the 20-gene-based model with relatively higher prediction accuracy than the four-gene-based model.
In this study, we integrated differential expression and regression analysis for LAC data sets from TCGA and GEO. Two OS prognostic models, that is, the 20-gene-based and the four-gene-based model, were obtained, which should be helpful for LAC early diagnosis and personalized treatment.
Supplementary material
Table S1 The clinicopathological features of patients
Disclosure
The authors report no conflicts of interest in this work.
References
- WuXDongLZhangRYingKShenHTransgelin overexpression in lung adenocarcinoma is associated with tumor progressionInt J Mol Med20143458559124938684
- WoodsLMColemanMPLawrenceGRashbassJBerrinoFRachetBEvidence against the proposition that “UK cancer survival statistics are misleading”: simulation study with National Cancer Registry dataBMJ2011342d339921659366
- NanavatyPAlvarezMSAlbertsWMLung cancer screening: advantages, controversies, and applicationsCancer Control20142191424357736
- ShaoLZhangBHeCEfficacy and safety of icotinib in Chinese patients with advanced non-small cell lung cancer after failure of chemotherapyChin Med J (Engl)201412726627124438614
- TravisWDPathology of lung cancerClin Chest Med20113266969222054879
- FieldJKRajiOYThe potential for using risk models in future lung cancer screening trialsF1000 Med Rep20102 pii:38
- GantiAKMulshineJLLung cancer screening: panacea or pipe dream?Ann Oncol200516Suppl 2ii215ii21915958460
- TravisWDBrambillaENoguchiMInternational Association for the Study of Lung Cancer/American Thoracic Society/European Respiratory Society: international multidisciplinary classification of lung adenocarcinoma: executive summaryProc Am Thorac Soc2011838138521926387
- JemalASiegelRWardECancer statistics, 2008CA Cancer J Clin200858719618287387
- CuiYLiuJYinHBLiuYFLiuJHFibulin-1 functions as a prognostic factor in lung adenocarcinomaJpn J Clin Oncol20154585485926185140
- ZhanJWangPNiuMHigh expression of transcriptional factor HoxB9 predicts poor prognosis in patients with lung adenocarcinomaHistopathology20156695596525324169
- XuPZhaoMLiuZElevated nuclear CCND1 expression confers an unfavorable prognosis for early stage lung adenocarcinoma patientsInt J Clin Exp Pathol20158158871589426884860
- MalatiTTumour markers: an overviewIndian J Clin Biochem200722173123105677
- LeeEMoonAIdentification of biomarkers for breast cancer using databasesJ Cancer Prev20162123524228053957
- LoveMIHuberWAndersSModerated estimation of fold change and dispersion for RNA-seq data with DESeq2Genome Biol20141555025516281
- ShermanBTHuang daWTanQDAVID Knowledgebase: a gene-centered database integrating heterogeneous gene annotation resources to facilitate high-throughput gene functional analysisBMC Bioinformatics2007842617980028
- JemalABrayFCenterMMFerlayJWardEFormanDGlobal cancer statisticsCA Cancer J Clin201161699021296855
- Cancer Genome Atlas Research NetworkComprehensive molecular profiling of lung adenocarcinomaNature201451154355025079552
- GiatromanolakiAKalamidaDSivridisEIncreased expression of transcription factor EB (TFEB) is associated with autophagy, migratory phenotype and poor prognosis in non-small cell lung cancerLung Cancer2015909810526264650
- XuPLiuLWangJGenetic variation in BCL2 3′-UTR was associated with lung cancer risk and prognosis in male Chinese populationPLoS One20138e7219723977251
- LimSMKimEYKimHRGenomic profiling of lung adenocarcinoma patients reveals therapeutic targets and confers clinical benefit when standard molecular testing is negativeOncotarget201672417226992220
- FinnRSDeringJConklinDPD 0332991, a selective cyclin D kinase 4/6 inhibitor, preferentially inhibits proliferation of luminal estrogen receptor-positive human breast cancer cell lines in vitroBreast Cancer Res200911R7719874578
- LoganJEMostofizadehNDesaiAJPD-0332991, a potent and selective inhibitor of cyclin-dependent kinase 4/6, demonstrates inhibition of proliferation in renal cell carcinoma at nanomolar concentrations and molecular markers predict for sensitivityAnticancer Res2013332997300423898052
- TaniguchiASugaRMatsumotoKExpression and transcriptional regulation of the human alpha1, 3-fucosyltransferase 4 (FUT4) gene in myeloid and colon adenocarcinoma cell linesBiochem Biophys Res Commun200027337037610873613
- YanXLinYLiuSAzizFYanQFucosyltransferase IV (FUT4) as an effective biomarker for the diagnosis of breast cancerBiomed Pharmacother20157029930425776515
- TianLShenDLiXGinsenoside Rg3 inhibits epithelial-mesenchymal transition (EMT) and invasion of lung cancer by down-regulating FUT4Oncotarget20167161926636541
- Kageyama-YaharaNRiezmanHTransmembrane topology of ceramide synthase in yeastBiochem J200639858559316756512
- MojakgomoRMbitaZDlaminiZLinking the ceramide synthases (CerSs) 4 and 5 with apoptosis, endometrial and colon cancersExp Mol Pathol20159858559225779024
- WegnerMSWangerRAOertelSCeramide synthases CerS4 and CerS5 are upregulated by 17beta-estradiol and GPER1 via AP-1 in human breast cancer cellsBiochem Pharmacol20149257758925451689
- BulunSESimpsonERAromatase expression in women’s cancersAdv Exp Med Biol200863011213218637488
- CarrubaGAromatase in nontumoral and malignant human liver tissues and cellsAnn N Y Acad Sci2009115518719319250204
- TuzunerMBOzturkTEronatAPEvaluation of local CYP17A1 and CYP19A1 expression levels as prognostic factors in postmenopausal invasive ductal breast cancer casesBiochem Genet20165478480227365044
- BondJRobertsEMochidaGHASPM is a major determinant of cerebral cortical sizeNat Genet20023231632012355089
- LinSYPanHWLiuSHASPM is a novel marker for vascular invasion, early recurrence, and poor prognosis of hepatocellular carcinomaClin Cancer Res2008144814482018676753
- HuZHuangGSadanandamAThe expression level of HJURP has an independent prognostic impact and predicts the sensitivity to radiotherapy in breast cancerBreast Cancer Res201012R1820211017
- KatoTSatoNHayamaSActivation of Holliday junction recognizing protein involved in the chromosomal stability and immortality of cancer cellsCancer Res2007678544855317823411
- Montes de OcaRGurard-LevinZABergerFThe histone chaperone HJURP is a new independent prognostic marker for luminal A breast carcinomaMol Oncol2015965767425497280
- ChoiJSongNHanSThe associations between immunity-related genes and breast cancer prognosis in Korean womenPLoS One20149e10359325075970
- D’AlterioCAvalloneATatangeloFA prognostic model comprising pT stage, N status, and the chemokine receptors CXCR4 and CXCR7 powerfully predicts outcome in neoadjuvant resistant rectal cancer patientsInt J Cancer201413537939024375277