
Abstract
Objective
The aim of this study was to identify the key microRNAs (miRNAs) and their regulatory networks in bladder cancer (BC).
Materials and methods
Three miRNA and three gene expression microarray datasets were downloaded for analysis from Gene Expression Omnibus database. The differentially expressed miRNAs (DEMs) and differentially expressed genes (DEGs) were accessed by the use of GEO2R. Gene ontology process and Kyoto Encyclopedia of Genes and Genomes pathway enrichment analyses were performed by using the Database for Annotation, Visualization and Integrated Discovery program. Protein–protein interaction (PPI) and miRNA–mRNA regulatory networks were established by using the Search Tool for the Retrieval of Interacting Genes/Proteins and Cytoscape tool. Besides, the results and clinical significance were validated in The Cancer Genome Atlas (TCGA) dataset.
Results
A total of 18 significant DEMs, 121 upregulated DEGs and 199 downregulated DEGs were identified. Functional enrichment analysis showed that significant DEGs were related to cell cycle and MAPK pathway in BC. Key DEGs such as CDK1, CCNB1, VGL and PRKCA were found as the hub genes in PPI networks. TCGA analysis supported our results, and the miRNAs were correlated with the pathological stages and survival of BC patients.
Conclusion
In this study, we found 18 DEMs that may play key roles in the regulatory networks of BC. The higher expression of miR-99a, miR-100, miR-125b, miR-145, miR-214 and miR-487b or the lower expression of miR-138 and miR-200a can indicate poor survival in the prognosis of BC. Further experimental studies are required to test our results.
Introduction
Bladder cancer (BC) is the leading cause of death among urological cancers, with an estimated 81,190 new cancer cases and 17,240 deaths in the US in 2018.Citation1
Approximately 70% of BC is non-muscle-invasive bladder cancer (NMIBC) at first diagnosis; however, roughly 20% of NMIBC will progress to muscle-invasive BC (MIBC).Citation2 Owing to the aggressive metastasis and delayed diagnosis, the prognosis of MIBC is still poor.Citation3 Although some conventional methods such as surgery and cytotoxic chemotherapy can be applied, the recurrence rate can be up to 70% within 2 years, which makes the treatment of BC unsatisfactory.Citation4 The thorough understanding of molecular mechanism and biological markers can help in the early detection, risk stratification, appropriate therapeutic intervention and prognosis in patients with BC.
MicroRNA (miRNA) is a group of single-stranded short RNA molecules (generally 21 nucleotides) that take part in the posttranscriptional gene regulation.Citation5 Emerging evidence reveals that miRNAs are involved in the various stages such as tumor initiation, proliferation, migration and invasion.Citation6,Citation7 MiRNAs can also functionally act as oncogene or tumor suppressors.Citation8 The detection technique of miRNA in serum, urine and biopsy specimen is available; therefore, miRNA is an attractive source of noninvasive biomarkers.Citation9 The quantitative reverse transcription polymerase chain reaction (qRT-PCR), small RNA sequencing and microarray are widely applied in BC researches in the past decade. In addition, the utility of miRNA as diagnosis or prognosis markers has generated a great interest. However, the results of different studies are inconclusive due to the heterogeneous ethnicity, sample size, different sample types and less clinical parameters.
To the best of our knowledge, few studies have reported the miRNAs and miRNA–mRNA regulatory networks by integrating multiple microarray datasets. Therefore, a comprehensive analysis was administrated in this study to further elucidate the key miRNAs, regulatory pathways and clinical significance in BC.
Materials and methods
Microarray data
Three miRNA expression profiles (GSE36121, GSE39093 and GSE68594) and three gene expression profiles (GSE27448, GSE40355 and GSE52519) were obtained by the search of the Gene Expression Omnibus (GEO, http://www.ncbi.nlm.nih.gov/geo). The profiles based on BC cell lines or xenograft models were excluded; thus, only BC patients and healthy controls were included in this study. lists the detailed characteristics of the profiles. Every included dataset from the abovementioned profiles contains at least 10 BC samples and normal bladder tissues ().
Table 1 Characteristics of the microarray datasets from GEO database
Data processing
We performed the comparison between the two groups of samples (BC versus normal prostate tissues) in each GEO dataset to identify differentially expressed genes (DEGs) and differentially expressed miRNAs (DEMs). The comparison was launched by a Limma R package based on online program, GEO2R (http://www.ncbi.nlm.nih.gov/geo/geo2r/). The adjusted P-value from the Benjamini–Hochberg method can correct the false-positive results, and the “adjusted P-value<0.05” and “|log FC|>1” parameters were chosen as primary cutoff criteria to test the results. Among the DEMs from the four datasets, only those involved in two or more datasets could be considered the statistically significant DEMs.
Identification of miRNA targets
The MiRWalk 2.0 database provides a large collection of predicted and experimentally verified information about the binding targets of miRNAs.Citation10 We downloaded the data of the significant DEMs and their target mRNAs from the MiRwalk 2.0 retrieval system, which was based on experimental literature reports. Despite the fact that validated target genes were from various disease models, the expression of those genes in BC might not be in consistent with other diseases. Hence, it is important to select the genes from the intersection between the significant DEM–mRNA intersection data and the DEGs from the three GEO datasets. These genes were finally defined as the significant DEGs.
Functional enrichment analysis
The Database for Annotation, Visualization and Integrated Discovery (DAVID) is an online platform that offers the functional annotation and analysis of enormous quantity of genes derived from various genomic resources.Citation11 We used the DAVID database to conduct gene ontology (GO) and Kyoto Encyclopedia of Genes and Genomes (KEGG) pathway analysis on significant DEGs. The species was limited to homo sapiens, and the “adjusted P-value (from the Benjamini–Hochberg method) <0.05” was considered statistically significant.
Interaction and regulatory network establishment
The protein–protein interaction (PPI) was visualized, and its network was constructed by the use of Search Tool for the Retrieval of Interacting Genes/Proteins (STRING), whose database can collect and predict the interaction information from genomic context predictions, high-throughput laboratory experiments, co-expression, automated text mining and previous knowledge in databases.Citation12 The data annotated from high-throughput laboratory experiments and previous knowledge in databases were imposed to access the more objective and reliable results, and the minimum interaction value was set at medium confidence (0.400).
The Targetscan (http://www.targetscan.org/) is a famous miRNA prediction database by searching for the presence of conserved 8mer, 7mer and 6mer sites that match the seed region of each miRNA. The miRanda algorithm from the “microRNA.org-Targets and Expression” is freely available and can be applied to the whole genome sequences using identified miRNA sequences.Citation13 The two programs mentioned earlier were used to predict target mRNAs of the significant DEMs. We note that two miRNAs shared a common target mRNA; they might exist in a similar regulatory pathway. The miRNA–mRNA regulatory network was visualized by using Cytoscape 3.6.0.Citation14
Validation and survival analysis
The Cancer Genome Atlas (TCGA) database provides abundant clinical information from huge sample size. Therefore, the dataset “TCGA-BLCA (https://portal.gdc.cancer.gov/)” was used to find if the significant DEMs were in correlation with survival outcome. The dataset contains 412 patients who were diagnosed as having BC in the period of 1999–2013. Among them, 304 patients are male, while 108 are female. As for the race, 327 BC patients are white, 44 are Asian and 23 are black or African-American, and 23 were not reported. Among the 404 clinical outcome events available, 227 patients were living and 177 were dead when the follow-up ended. We examined the significant DEMs’ expression, relationship with BC stages and survival. The “independent two-sample Student’s t-test” was applied to check the expression level, while the chi-square test was used on different stages. The Kaplan–Meier plots were constructed using Oncolnc.Citation15 The “P-value<0.05” was considered statistically significant.
Results
DEG/DEM identification
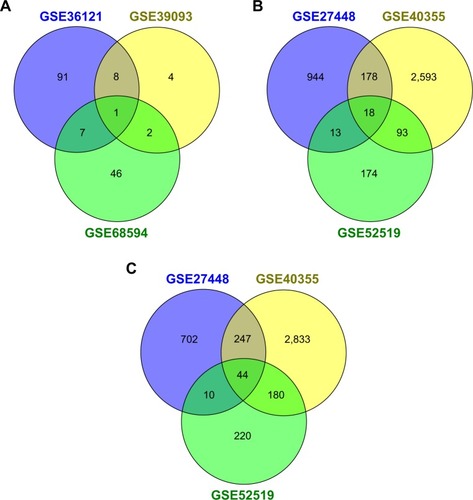
After compared with normal bladder tissues, the results of GEO2R analysis showed that there were totally 159 DEMs (), 4,013 upregulated DEGs () and 4236 downregulated DEGs (). Among them, 18 DEMs appeared in the results of two datasets at least, so they could be identified as significant DEMs. Interestingly, miR-145 was the only DEM in all three datasets simultaneously. The following DEMs were found in every two different datasets: miR-429, miR-487b, miR-494, miR-222, miR-335, miR-202, miR-212, miR-200a, miR-125b, miR-210, miR-214, miR-182, miR-99a, miR-100 and miR-138. Subsequently, we further compared clinical stages T2–T4 versus Ta–T1 and high histological grade versus low grade to identify DEMs which might be related to aggressive BC. Interestingly, only miR-601 and hsa-let-7c appeared in two dataset intersections ().
Figure 1 Venn diagram of DEM/DEG selection in different datasets.
Abbreviations: DEGs, differentially expressed genes; DEM, differentially expressed miRNA; miRNAs, microRNAs.
Using the MiRWalk 2.0-validated-target miRNA-gene retrieval system, we got 9,053 candidate genes of the 18 significant DEMs. The intersection number of these candidate genes and the upregulated DEGs which appeared in two or more datasets was 121, while the intersection number of these candidate genes and the downregulated DEGs which appeared in two or more datasets was 199. Therefore, the 121 upregulated and the 199 downregulated genes were identified as the final sets of significant DEGs.
GO and pathway enrichment
The GO ontology contains three terms: cellular component, molecular function and biological process. The three terms mentioned earlier were used to identify the key biological functions. The results demonstrated that the most significant GO terms for upregulated significant DEGs were “nucleoplasm,” “protein binding” and “cell division.” Whereas for the downregulated significant DEGs, the terms “costamere,” “heparin binding” and “cell–matrix adhesion” turned to be important ().
Table 2 Results of significant GO biological processes and the KEGG pathway analysis
Furthermore, the KEGG pathway analysis indicated that “cell cycle,” “MAPK signaling pathway,” “pathways in cancer” and “proteoglycans in cancer” pathways played an essential role in BC pathogenesis ().
PPI network
The PPI networks were established separately by the significant upregulated DEGs () and significant downregulated DEGs (). As for the former, 64 nodes and 172 edges in total constituted the PPI network. As for the latter, the network was composed of 73 nodes and 80 edges.
Figure 2 PPI network of DEGs.
Abbreviations: DEGs, differentially expressed genes; PPI, protein–protein interaction.
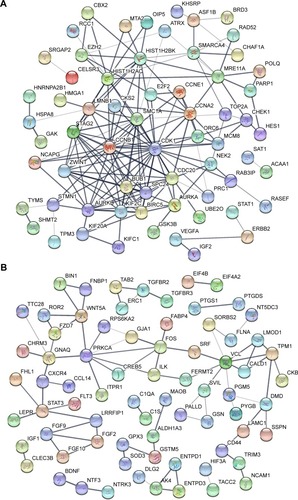
In a single PPI network, the more edges a gene has, the more important role it plays (like a seed). We utilized the parameter “degree” to calculate edge counts of every single gene in a PPI network. The top 5% degree genes are listed in , which were assessed as the hub genes.
Table 3 The top 5% hub genes in the PPI networks
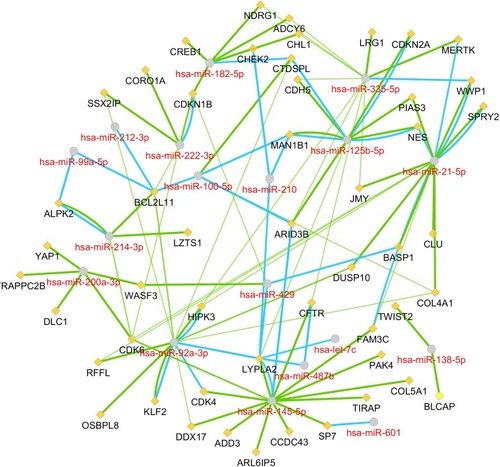
MiRNA–mRNA regulatory network
As illustrated in , the target genes were predicted using miRanda and miRTarbase, among which two or more miRNAs might target the same mRNA. For instance, both miR-92a and miR-145 had the interactions with cyclin-dependent kinase 4 (CDK4). There were 12 mRNA nodes that might interact with at least two miRNAs.
Figure 3 The miRNA–mRNA regulatory network.
Abbreviation: miRNA, microRNA.
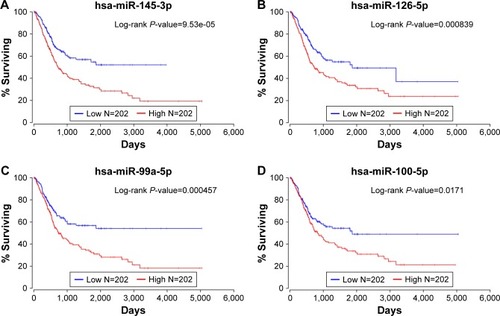
Validation and Kaplan–Meier curves
After comparing the expression level of miRNAs in the TCGA dataset, we found that 13 among the 18 significant DEMs were according to the results in GEO databases. In contrast, the expression of miR-92, miR-494, miR-429, miR-202 and miR-212 was not significantly different between BC samples and normal control bladder tissues. The relationship between miRNAs and the clinical TNM stages was also tested in the TCGA dataset by using chi-square analysis. The results of the significant DEMs are summarized in .
Table 4 Results of the significant DEM expression validation and the relationship with bladder cancer clinical stages in TCGA dataset
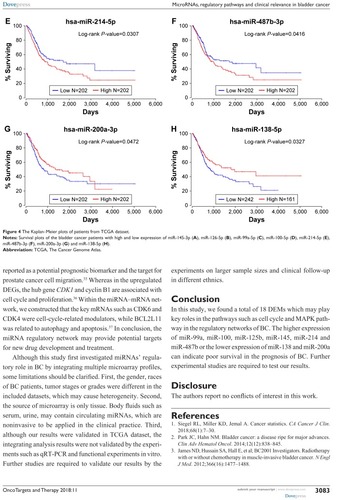
We subsequently drew Kaplan–Meier plots () based on the TCGA survival data. The plots indicated that eight significant DEMs, such as miR-99a, miR-100, miR-125b, miR-138, miR-145, miR-200, miR-214 and miR-487b, were found to be related to overall survival (OS) in BC patients. The higher expression of the abovementioned miRNAs meant the poor OS in patients with BC except miR-138 and miR-200a.
Figure 4 The Kaplan–Meier plots of patients from TCGA dataset.
Abbreviation: TCGA, The Cancer Genome Atlas.
Discussion
In the current study, 18 significant DEMs, 121 upregulated DEGs and 199 downregulated DEGs were identified after integrating and screening multiple datasets. The results of functional enrichment analysis indicated that the significant DEGs in BC were related to classical cancer pathways such as cell cycle and MAPK signaling pathways. The key DEGs such as CDK1, CCNB1, VCL and PRKCA were defined as the hub genes in the PPI networks. Significantly, most of the DEMs were correlated with tumor stages and OS in the TCGA datasets, which meant that the miRNAs have high clinical application value in the prognosis of BC.
BC shares many acknowledged pathways with other human cancers such as p53 and MAPK pathways. With the growing in-depth studies of BC, people have found a great deal of key molecules at gene, transcription regulation and protein interaction level. In these complicated processes, miRNAs nearly take part in all key cellular pathways because one miRNA can interact with many mRNAs and one mRNA can also interact with a lot of miRNAs. Intriguingly, miR-145 was the only one significant DEM that was identified in all three different datasets. We assumed that the source of heterogeneity might be ethnic and sample size. The expression level of miR-145 was higher in BC tissue and cell line than normal control.Citation16,Citation17 Minami et alCitation18 reported that miR-145 could negatively regulate Warburg effect by silencing KLF4 and PTBP1. Long noncoding RNA (lncRNA) can also interact with miRNA in cancer pathways. LncRNA UCA-1 can promote BC cell migration and invasion by hsa-miR-145-ZEB1/2-FSCN1 pathway.Citation19 miR-21 regulates cell proliferation and migration by targeting PTEN and p53 in BC.Citation20 miR-202,Citation21 miR-212,Citation22 miR-222,Citation23 miR-429,Citation24 miR-200,Citation25 miR-210,Citation26 miR-214,Citation27 miR-182,Citation28 miR-99a,Citation29 miR-100Citation30 and miR-138Citation31 were reported in BC studies, which were mostly dependent on cell lines. The studies on miRNA relationship with BC survival were insufficient. Urine is an ideal source of biomarkers due to the easily acquired and noninvasive property.Citation32 Recently, it was reported that inflammation could drive tumor growth and progression.Citation33,Citation34 Mearini et alCitation34 reported that although the expression of miR-145 in urine was higher in BC than in inflammation, and even higher in the high histological grade or high clinical stages, the results were not statistically significant. The expression of miR-145 was significantly higher in BC tissues in our results. It is assumed that the difference may be owing to low secretion amount or degradation. Therefore, we need the microarray studies concerning miRNAs in serum or urine as biomarkers in BC based on large sample sizes in the future.
Our studies may also provide hints for new target genes and pathways in the basic experiments of BC. Except for the previously reported miRNAs, there are also some miRNAs not reported in BC such as miR-335, miR-125b, miR-494 and miR-487b. We found that the higher miR-125b and miR487b expression suggested the poor survival based on 404 patients in TCGA. The mechanisms and in-depth pathways of these miRNAs should be investigated by experiments in the future.
By constructing the PPI network, we can recognize the key genes which miRNAs may interact with. Since the genes were filtered by the 18 significant DEMs’ potential targets, there were still 121 upregulated and 199 downregulated genes. Therefore, when it comes to all the 159 DEMs, the enormous and complicated miRNA–mRNA regulatory network can be imaginable. The hub genes of a network are always important like “seeds,” which connect the different signal pathways. In the current study, we identified several hub genes. Among the downregulated DEGs, the vinculin and protein kinase C alpha were identified. The vinculin was reported as a potential prognostic biomarker and the target for prostate cancer cell migration.Citation35 Whereas in the upregulated DEGs, the hub gene CDK1 and cyclin B1 are associated with cell cycle and proliferation.Citation36 Within the miRNA–mRNA network, we constructed that the key mRNAs such as CDK6 and CDK4 were cell-cycle-related modulators, while BCL2L11 was related to autophagy and apoptosis.Citation37 In conclusion, the miRNA regulatory network may provide potential targets for new drug development and treatment.
Although this study first investigated miRNAs’ regulatory role in BC by integrating multiple microarray profiles, some limitations should be clarified. First, the gender, races of BC patients, tumor stages or grades were different in the included datasets, which may cause heterogeneity. Second, the source of microarray is only tissue. Body fluids such as serum, urine, may contain circulating miRNAs, which are noninvasive to be applied in the clinical practice. Third, although our results were validated in TCGA dataset, the integrating analysis results were not validated by the experiments such as qRT-PCR and functional experiments in vitro. Further studies are required to validate our results by the experiments on larger sample sizes and clinical follow-up in different ethnics.
Conclusion
In this study, we found a total of 18 DEMs which may play key roles in the pathways such as cell cycle and MAPK pathway in the regulatory networks of BC. The higher expression of miR-99a, miR-100, miR-125b, miR-145, miR-214 and miR-487b or the lower expression of miR-138 and miR-200a can indicate poor survival in the prognosis of BC. Further experimental studies are required to test our results.
Supplementary materials
Figure S1 Venn diagram of DEMs (A: Ta–T1 vs T2–T4; B: G3 vs G1) in different datasets.
Abbreviations: DEMs, differentially expressed miRNAs; miRNAs, microRNAs.
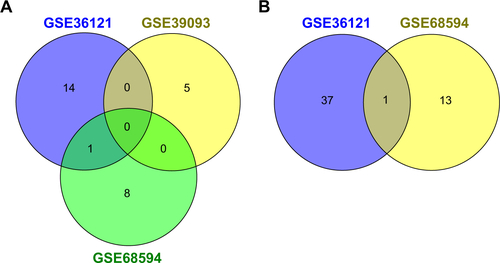
Table S1 Detailed information of patients in each included GEO datasets
Disclosure
The authors report no conflicts of interest in this work.
References
- SiegelRLMillerKDJemalACancer statisticsCA Cancer J Clin201868173029313949
- ParkJCHahnNMBladder cancer: a disease ripe for major advancesClin Adv Hematol Oncol2014121283884525674841
- JamesNDHussainSAHallEBC2001 InvestigatorsRadiotherapy with or without chemotherapy in muscle-invasive bladder cancerN Engl J Med2012366161477148822512481
- GoodisonSRosserCJUrquidiVBladder cancer detection and monitoring: assessment of urine- and blood-based marker testsMol Diagn Ther2013172718423479428
- BartelDPMicroRNAs: genomics, biogenesis, mechanism, and functionCell2004116228129714744438
- HuangTAlvarezAHuBChengSYNoncoding RNAs in cancer and cancer stem cellsChin J Cancer2013321158259324206916
- ShiZWeiQZhangMSheJMicroRNAs in bladder cancer: expression profiles, biological functions, regulation, and clinical implicationsCrit Rev Eukaryot Gene Expr2014241557524579670
- FabrisLCederYChinnaiyanAMThe potential of microRNAs as prostate cancer biomarkersEur Urol201670231232226806656
- FendlerAStephanCYousefGMKristiansenGJungKThe translational potential of microRNAs as biofluid markers of urological tumoursNat Rev Urol2016131273475227804986
- DweepHGretzNmiRWalk2.0: a comprehensive atlas of microRNA-target interactionsNat Methods201512869726226356
- Huang daWShermanBTLempickiRASystematic and integrative analysis of large gene lists using DAVID bioinformatics resourcesNat Protoc200941445719131956
- SzklarczykDMorrisJHCookHThe STRING database in 2017: quality-controlled protein-protein association networks, made broadly accessibleNucleic Acids Res201745Database issueD362D36827924014
- BetelDKoppalAAgiusPSanderCLeslieCComprehensive modeling of microRNA targets predicts functional non-conserved and non-canonical sitesGenome Biol2010118R9020799968
- ShannonPMarkielAOzierOCytoscape: a software environment for integrated models of biomolecular interaction networksGenome Res200313112498250414597658
- AnayaJOncoLnc: linking TCGA survival data to mRNAs, miRNAs, and lncRNAsPeerJ Comput Sci20162e67
- FujiiTShimadaKTatsumiYmicroRNA-145 promotes differentiation in human urothelial carcinoma through down-regulation of syndecan-1BMC Cancer20151581826514209
- AvgerisMMavridisKTokasTStravodimosKFragoulisEGScorilasAUncovering the clinical utility of miR-143, miR-145 and miR-224 for predicting the survival of bladder cancer patients following treatmentCarcinogenesis201536552853725804644
- MinamiKTaniguchiKSugitoNMiR-145 negatively regulates Warburg effect by silencing KLF4 and PTBP1 in bladder cancer cellsOncotarget2017820330643307728380435
- XueMPangHLiXLiHPanJChenWLong non-coding RNA urothelial cancer-associated 1 promotes bladder cancer cell migration and invasion by way of the hsa-miR-145-ZEB1/2-FSCN1 pathwayCancer Sci20161071182726544536
- LeiMXieWSunEmicroRNA-21 regulates cell proliferation and migration and cross talk with PTEN and p53 in bladder cancerDNA Cell Biol2015341062663226230405
- ZhangLXuJYangGLiHGuoXmiR-202 inhibits cell proliferation, migration, and invasion by targeting EGFR in human bladder cancerOncol Res Epub201813
- ZhangQWangWXuWGenetic variations in the 3′-untranslated regions of genes involved in the cell cycle and apoptosis pathways affect bladder cancer riskCancer Genomics Proteomics2018151677229275364
- ZengLPHuZMLiKXiaKmiR-222 attenuates cisplatin-induced cell death by targeting the PPP2R2A/Akt/mTOR Axis in bladder cancer cellsJ Cell Mol Med201620355956726800397
- YangJLiuYHeAHsa-miR-429 promotes bladder cancer cell proliferation via inhibiting CDKN2BOncotarget2017840687216872928978151
- HuangCZengXJiangGXIAP BIR domain suppresses miR-200a expression and subsequently promotes EGFR protein translation and anchorage-independent growth of bladder cancer cellJ Hematol Oncol2017101628057023
- YangXShiLYiCYangYChangLSongDMiR-210-3p inhibits the tumor growth and metastasis of bladder cancer via targeting fibroblast growth factor receptor-like 1Am J Cancer Res2017781738175328861329
- WangJZhangXWangLMicroRNA-214 suppresses oncogenesis and exerts impact on prognosis by targeting PDRG1 in bladder cancerPLoS One2015102e011808625706919
- PapadopoulosEIScorilasACisplatin and paclitaxel alter the expression pattern of miR-143/145 and miR-183/96/182 clusters in T24 bladder cancer cellsClin Transl Sci20158666867526356996
- TsaiTFLinJFChouKYLinYCChenHEHwangTImiR-99a-5p acts as tumor suppressor via targeting to mTOR and enhances RAD001-induced apoptosis in human urinary bladder urothelial carcinoma cellsOnco Targets Ther20181123925229379304
- MoraisDRReisSTVianaNThe involvement of miR-100 in bladder urothelial carcinogenesis changing the expression levels of mRNA and proteins of genes related to cell proliferation, survival, apoptosis and chromosomal stabilityCancer Cell Int201414111925493074
- YangRLiuMLiangHmiR-138-5p contributes to cell proliferation and invasion by targeting Survivin in bladder cancer cellsMol Cancer20161518227978829
- LiDYHaoXYMaTMDaiHXSongYSThe prognostic value of platelet-to-lymphocyte ratio in urological cancers: a meta-analysisSci Rep201771538729133845
- LiDHaoXLiJDose-response relation between dietary inflammatory index and human cancer risk: evidence from 44 epidemiologic studies involving 1,082,092 participantsAm J Clin Nutr2018107337138829566194
- MeariniEPoliGCochettiGBoniAEgidiMGBrancorsiniSExpression of urinary miRNAs targeting NLRs inflammasomes in bladder cancerOnco Targets Ther2017102665267328579804
- AiJJinTYangLVinculin and filamin-C are two potential prognostic biomarkers and therapeutic targets for prostate cancer cell migrationOncotarget2017847824308243629137275
- HarleyMEAllanLASandersonHSClarkePRPhosphorylation of Mcl-1 by CDK1-cyclin B1 initiates its Cdc20-dependent destruction during mitotic arrestEMBO J201029142407242020526282
- DaiYGrantSBCL2L11/Bim as a dual-agent regulating autophagy and apoptosis in drug resistanceAutophagy201511241641825700997