
Abstract
Background and objective
Metastasis is the major cause of cancer-related deaths in patients with colon cancer, however, the exact molecular mechanism is unclear. MicroRNAs (miRNAs) play an important role in the pathogenesis and progression of cancer. Therefore, in this study, we aimed to identify differentially expressed miRNAs in two colon carcinoma cell lines: SW480, derived from primary colon carcinoma and SW620, derived from lymph node metastasis, which were obtained from the same patient.
Materials and methods
Three independent samples of cancer cells were collected from SW480 and SW620 cells, respectively. An miRNA microarray platform, miRCURY LNA™ microRNA array with 1,223 probes containing 3,000 capture probes, was used to determine the miRNA expression profiles of these two cell lines. Differentially expressed miRNAs were validated by quantitative reverse transcription-polymerase chain reaction (qRT-PCR).
Results
The raw data were submitted to the Gene Expression Omnibus database (GSE72412). Thirteen miRNAs were differentially expressed between SW480 and SW620 cells, of which, seven miRNAs (hsa-miR-920, hsa-miR-636, hsa-miR-766-3p, hsa-miR-545-5p, hsa-miR-195-3p, hsa-miR-125a-3p, and hsa-miR-196b-3p) were found to be upregulated and six miRNAs (hsa-miR-3613-3p, hsa-miR-29b-3p, hsa-miR-1297, hsa-miR-141-5p, hsa-miR-200c-3p, and hsa-miR-141-3p) were found to be downregulated. Target analysis of the predicted miRNAs showed that these genes were primarily involved in protein binding, cell adhesion, and cancer metastasis. Furthermore, qRT-PCR validated the results of miRNA microarray.
Conclusion
This is the first systematic analysis of the differences of miRNAs between SW480 and SW620 cells. The results provide useful information to explore potential biomarkers of miRNAs for predicting colon cancer metastasis.
Keywords:
Introduction
Colon cancer is one of the most common types of cancers and metastasis is the leading cause of death in patients with colon cancer.Citation1 However, the molecular mechanism involved in the metastasis is not yet clear. Many studies demonstrate that microRNAs (miRNAs) play an important role in the pathogenesis and progression of cancer.Citation2 miRNAs are small noncoding RNAs that suppress target gene expression at the posttranscriptional level by binding to the 3′-untranslated region of the target mRNA.Citation3 Although miRNAs have been found to promote or suppress tumor metastasis, the exact role of miRNAs in colon cancer metastasis remains to be uncovered. Functional studies indicate that miRNAs have important functions in tumor progression, especially recurrence, drug resistance, and metastasis.Citation4 Majority of the researchers have provided strong evidence that miRNAs play an important role during tumorigenesis and tumor progression.Citation5–Citation8
With this background that the miRNAs are involved in tumor development and progression, in this study, we hypothesized that miRNAs also play a key role in colon cancer metastasis. The metastatic potential of SW620 cells, derived from lymph node metastasis, is known to be higher than that of SW480 cells, derived from primary colon cancer tissues of the same patient, which have been used as model cell lines for analyzing the metastatic ability.Citation9,Citation10 Therefore, we hypothesized that the genes expressed, such as miRNAs, which differ between SW480 and SW620 cells, could be related to tumor metastasis. Until now, there are no systematic reports with respect to the miRNA expression profile of the two recognized cell lines with distinct metastatic capacity. In this study, we profiled the miRNAs of the SW620 and SW480 colon cancer cell lines.
Materials and methods
Cell culture
The human colon cancer cell lines SW480 and SW620 were purchased from the American Tissue Culture Collection (Manassas, VA, USA) and were routinely maintained in RPMI-1640 medium (HyClone, Logan, UT, USA) supplemented with 10% fetal bovine serum (Thermo Fisher Scientific, Waltham, MA, USA), 100 U/mL penicillin sodium and 100 mg/mL streptomycin sulfate at 37°C in a humidified air atmosphere containing 5% CO2. Cells were used in logarithmic growth phase.
RNA extraction
Total RNA was isolated using TRIzol (Thermo Fisher Scientific) and purified with RNeasy mini kit (Qiagen) according to manufacturer’s instructions. RNA quality and quantity were measured by using NanoDrop spectrophotometer (ND-1000; NanoDrop Technologies, Thermo Fisher Scientific, Waltham, MA, USA) and RNA integrity was determined by gel electrophoresis.
Labeling of miRNA and array hybridization
RNA labeling and array hybridization were performed according to Exiqon’s manual. First, after quality control, the miRCURY LNA™ Hy3™/Hy5™ Power labeling kit (Exiqon, Vedbaek, Denmark) was used according to the manufacturer’s guideline for miRNA labeling by following steps: 1) 1 µL RNA in 2.0 µL of water was combined with 1.0 µL of calf intestinal alkaline phosphatase (CIAP) buffer and CIAP (Exiqon). The mixture was incubated for 30 min at 37°C; 2) the reaction was terminated by incubation for 5 min at 95°C. Then, 3.0 µL of labeling buffer, 1.5 µL of fluorescent label (Hy3™), 2.0 µL of dimethyl sulfoxide, and 2.0 µL of labeling enzyme were added into the mixture. The labeling reaction was incubated for 1 h at 16°C; and 3) the labeling reaction was terminated by incubation for 15 min at 65°C. Then, the Hy3™-labeled samples were hybridized on the miRCURY LNA™ microRNA Array (v.18.0) (Exiqon) according to the array manual steps as follows: 1) the total 25 µL mixture from Hy3™-labeled samples with 25 µL hybridization buffer was first denatured for 2 min at 95°C and then incubated on ice for 2 min; 2) then, hybridized on the microarray for 16–20 h at 56°C in a 12-Bay Hybridization Systems (Hybridization System – Nimblegen Systems, Inc., Madison, WI, USA); and 3) following hybridization, the slides were prepared and washed several times using wash buffer kit (Exiqon). Eventually, the slides were scanned using the Axon GenePix 4000B microarray scanner (Axon Instruments, Foster City, CA, USA).
Data analysis
The raw data were submitted to the Gene Expression Omnibus database (GSE72412) (http://www.ncbi.nlm.nih.gov/geo/). The scanned images were then imported into GenePix Pro 6.0 software (Axon Instruments) for grid alignment and data extraction. The replicated miRNAs were averaged and those with intensities ≥30 in all samples were chosen to calculate the normalization factor. The data expressed were normalized using the median normalization. After normalization, significant differentially expressed miRNAs between the two groups were identified using fold change and p-value. Differentially expressed miRNAs between the two samples were filtered through fold change. Finally, hierarchical clustering was performed to show distinguishable miRNA expression profiling among samples.
Quantitative reverse transcription-polymerase chain reaction (qRT-PCR)
Cells of human colon cancer cell lines SW480 and SW620 in the logarithmic growth period were collected. Following the isolation of total RNA, cDNA were synthesized using a miDETECT A Track™ miRNA qRT-PCR Starter kit (RIOBIO Biotechnology Co., Ltd., Guangzhou, People’s Republic of China). All the miRNAs’ primers (miDETECT A Track™ miRNA qPCR Primer Set), including hsa-miR-920, hsa-miR-636, hsa-miR-766-3p, hsa-miR-545-5p, hsa-miR-195-3p, hsa-miR-125a-3p, hsa-miR-196b-3p, hsa-miR-3613-3p, hsa-miR-29b-3p, hsa-miR-1297, hsa-miR-141-5p, hsa-miR-200c-3p, and hsa-miR-141-3p, and control primer (miDETECT A Track™ U6 qPCR Primer Set) were also purchased. We performed qRT-PCR on an ABI 7500 real-time PCR system (Thermo Fisher Scientific) according to the manufacturer’s protocol by miDETECT A Track™ miRNA qRT-PCR Kit (RIOBIO Biotechnology Co., Ltd.). Dissociation curve analysis was used to verify the generation of a single product. U6 was used as a reference gene, and all reactions were repeated three times. Data were analyzed using the ABI 7500 Prism sequence detection software (Thermo Fisher Scientific) and the relative expression was calculated using the 2−ΔΔCq method.
Statistical analysis
Statistical analysis was performed using SPSS statistical software (version 17.0; SPSS, Inc., Chicago, IL, USA). The significant difference between the two groups was analyzed by one-way analysis of variance using paired t-test. Data are expressed as mean±standard deviation. A p-value <0.05 was considered as a significant difference.
Results
miRNA expression profiles between SW620 and SW480 cells
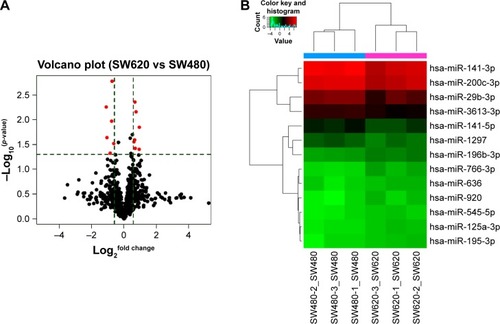
To identify the difference in miRNA expression between SW620 and SW480 cells, we used the miRNA microarray platform, miRCURY LNA™ microRNA Array with 1,223 probes containing 3,000 capture probes, and screened differentially expressed miRNAs. First, three independent cell samples were collected from SW480 and SW620 cells, respectively. Total RNA were extracted from the total six samples (SW480-1, SW480-2, SW480-3, SW620-1, SW620-2, and SW620-3). For spectrophotometer, the ratio of optical density (OD) (A260/A280) should be close to 2.0 for pure RNA (ratios between 1.8 and 2.1 are acceptable). The OD A260/A230 ratio should be more than 1.8. We validated the RNA quantification and assure the quality of RNA (). Furthermore, we obtained a good quality control chip distribution after chip hybridization: 1) The probe distribution of each chip between six total RNAs of samples is not consistent before standardization, and the median of each chip is at the same level and the distribution of the probe is close after the middle value standardization (); 2) The scatter plot reflects the repeatability between the chips or the groups. The better the repeatability is, the closer the diagonal line is (); 3) The closer to 1 the correlation coefficient is, the better the repeatability is (). Eventually, we found that 13 differentially expressed miRNAs (including seven upregulated [hsa-miR-920, hsa-miR-636, hsa-miR-766-3p, hsa-miR-545-5p, hsa-miR-195-3p, hsa-miR-125a-3p, and hsa-miR-196b-3p] and six downregulated known miR-NAs [hsa-miR-3613-3p, hsa-miR-29b-3p, hsa-miR-1297, hsa-miR-141-5p, hsa-miR-200c-3p, and hsa-miR-141-3p], respectively) in the SW620 cells in contrast to the SW480 cells. and summarize the 13 miRNAs that show the significant differences.
Table 2 The list of differentially expressed miRNAs between SW620 cells and SW480 cells
Figure 1 RNA quality control in total six cell samples. (A) RNA quantification and quality assurance by NanoDrop ND-1000. (B) RNA integrity and gDNA contamination test by denaturing agarose gel electrophoresis. Lanes 1, 2, 3, 4, 5, and 6: total RNA of samples SW480-1, SW480-2, SW480-3, SW620-1, SW620-2, and SW620-3.
Table 1 Pearson correlation coefficient to measure repeatability between six total RNAs of samples SW480-1, SW480-2, SW480-3, SW620-1, SW620-2, and SW620-3
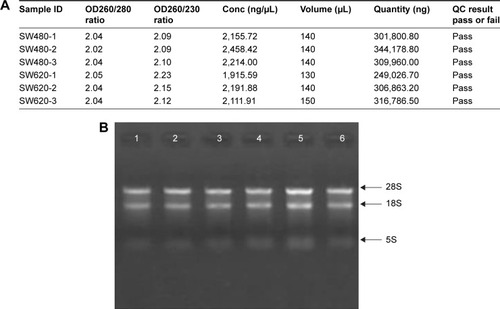
Figure 2 The distribution of the probe on the chip between six total RNAs of samples SW480-1, SW480-2, SW480-3, SW620-1, SW620-2, and SW620-3. The box plot reflects the distribution of the probe on the chip, which can be used to compare the effect of the probe before and after the standardization. The probe distribution of each chip is not consistent before standardization, and the median of each chip is at the same level and the distribution of the probe is close after the middle value standardization.
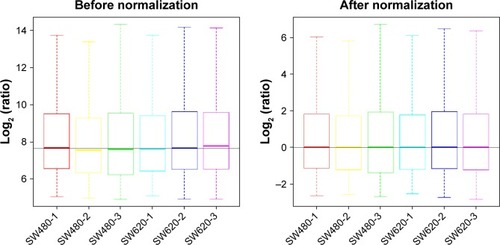
Figure 3 The distribution of the probe on the chip (scatter plot) between six total RNAs of samples SW480-1, SW480-2, SW480-3, SW620-1, SW620-2, and SW620-3. The scatter plot reflects the repeatability between the chips or the groups. The better the repeatability is, the closer the diagonal line is.
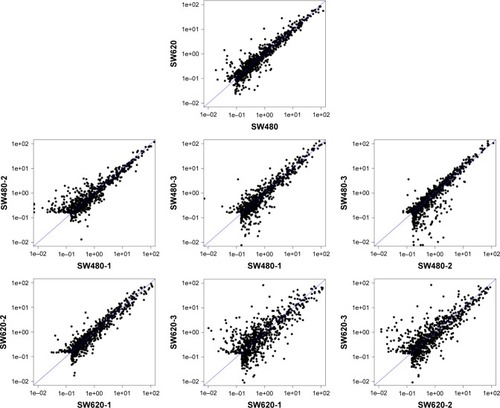
Figure 4 Significantly differentially expressed miRNAs in SW620 cells compared with SW480 cells. (A) Volcano plot: 13 red points represent the 13 significantly differentially expressed miRNAs according to fold change >1.5 and p<0.05. (B) Heatmap and hierarchical clustering of 13 significantly differentially expressed miRNAs.
Validation of differentially expressed miRNAs
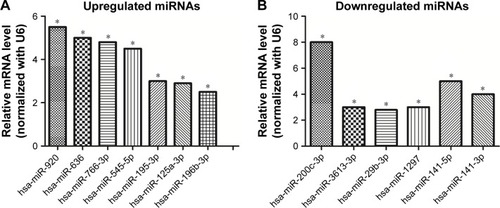
miRNA-specific qRT-PCR was performed to validate the differentially expressed miRNAs. The expression levels of hsa-miR-920, hsa-miR-636, hsa-miR-766-3p, hsa-miR-545-5p, hsa-miR-195-3p, hsa-miR-125a-3p, and hsa-miR-196b-3p were found to be significantly upregulated in SW620 (), whereas those of hsa-miR-3613-3p, hsa-miR-29b-3p, hsa-miR-1297, hsa-miR-141-5p, hsa-miR-200c-3p, and hsa-miR-141-3p were found to be downregulated (). These results agree with the results of the miRNA microarray analysis.
Figure 5 Validation of miRNA microarray results by qRT-PCR. (A) Seven upregulated miRNAs in SW620 cells compared with SW480 cells. (B) Six downregulated miRNAs in SW620 cells in contrast to SW480 cells. U6 was used as a normalization control. Data represent the mean±standard deviation of three biological replicates. *p<0.05.
Analysis of the predicted target genes of differentially expressed miRNAs
To investigate the potential function of predicted target genes, we analyzed the differentially expressed miRNAs by searching previously published studies regarding the particular genes’ functions. We could predict tumor-associated gene targets of the significantly differentially expressed 13 miRNAs. Analysis of predicted miRNAs’ targets showed that these genes were primarily involved in protein binding, cell adhesion, and cancer metastasis. and summarize the results.
Table 3 Putative target genes of the seven upregulated miRNAs
Table 4 Putative target genes of the six downregulated miRNAs
Discussion
In this study, we used SW480 and SW620 cell lines that have different metastatic capabilities () and we hypothesized that miRNAs that differ between SW480 and SW620 cells could be related to the formation of cancer metastasis. Therefore, we investigated the miRNA expression profiling between SW480 and SW620 cells using an miRCURY LNA™ miRNA array platform and identified some differentially expressed miRNAs between them. According to our results, seven miRNAs were found to be upregulated and six were found to be downregulated in SW620 cells in contrast to SW480 cells, whose functions are known to be closely associated with tumor metastasis. Thirteen differentially expressed miRNAs (including seven upregulated [hsa-miR-920, hsa-miR-636, hsa-miR-766-3p, hsa-miR-545-5p, hsa-miR-195-3p, hsa-miR-125a-3p, and hsa-miR-196b-3p] and six downregulated known miRNAs [hsa-miR-3613-3p, hsa-miR-29b-3p, hsa-miR-1297, hsa-miR-141-5p, hsa-miR-200c-3p, and hsa-miR-141-3p], respectively) were identified and qRT-PCR was performed to validate the array results. Furthermore, we analyzed our results on the miRNAs with target genes and found that many target genes are related to tumor progression and metastasis in previously published peer-reviewed literature.
Table 5 Information about SW620 and SW480 cell line from American Tissue Culture Collection (ATCC)
Chen et al found that the risk allele for rs16405 disrupted a binding site for human miR-920 which would negatively regulate beta-transducin repeat-containing protein (betaTrCP) and proposed an miR-920-mediated betaTrCP regulation model depending on rs16405 genotype, which may influence the risk of hepatocellular carcinoma (HCC). The molecular mechanism was, at least in part, found to be hsa-miR-920-mediated regulation, which is possibly involved in the pathogenesis of HCC.Citation11 Jang et al revealed that miR-636 might function as a tumor suppressor miRNA affecting HCC tumorigenesis via downregulation of Ras, and that ANT2 suppression by shRNA could exert an anticancer effect by restoring the expression of miR-636 in HCC.Citation12 Some studies demonstrate that targeting DNMT3B by miR-766 and other miRNAs, decreased methylation of tumor suppressor genes, such as SFRP1, SFRP2, WIF1, and DKK2, and returned the expression of these tumor suppressor genes which can contribute to lethal effect on colon cancer cells and reducing tumorigenicity of these cells.Citation13 In addition, miR-766-3p can promote cell proliferation by targeting the expression of SF2 in renal cell carcinoma (RCC), which is significantly associated with poor survival in a large cohort of RCC specimens.Citation14 miR-545 is found to be involved in tumor proliferation and progression and is associated with overall survival and progression-free survival in patients with cancer.Citation15–Citation17 Furthermore, miR-195 is associated with the progression of fibrosis and remodeling of the extracellular matrix, which can regulate cell proliferation, migration, angiogenesis, and autophagy.Citation18–Citation20 In addition, miR-125a may represent a novel therapeutic target for the treatment of osteo-sarcoma and some findings have suggested that the detected miR-125a-5p levels in plasma could be used as a potential biomarker in early Kawasaki disease diagnosis.Citation21,Citation22 The activation of miR-125a confers resistance to BRAF(V)(600E) melanoma cells to BRAF inhibitors.Citation23 Furthermore, miR-196b significantly contributes to leukemia development,Citation24 and miR-29b could inhibit glioma cell migration and invasion and inhibit breast cancer cell angiogenesis.Citation25,Citation26 miR-1297 inhibits the growth and metastasis of colorectal cancer.Citation27 miR-141 functions as a tumor suppressor in colorectal cancer SW480 cells,Citation28 and miR-200c regulates cancer progression, epithelial–mesenchymal transition, and drug resistance.Citation29,Citation30
Conclusion
In conclusion, we used miRNA microarray technology to analyze the different miRNA expression profiling between SW620 and SW480 cells and found that 13 miRNAs were significantly deregulated. The expression levels of miRNAs were validated by qRT-PCR, and the results were found to be consistent with the results detected by microarray analysis. Target gene predictions indicated that differentially expressed miRNAs play an important role in the metastasis of colon cancer. However, further study on these miRNAs and their functions in the tumorigenesis of colon cancer is necessary.
Acknowledgments
This work was supported by National Nature Science Foundation of China (Grant No 81172285) and Natural Science Foundation of Fujian Province, People’s Republic of China (Grant No 2018J01392 and 2018J01390).
Disclosure
The authors report no conflicts of interest in this work.
References
- WassermanILeeLHShiaJSMAD4 loss in colorectal cancer: correlation with recurrence, chemoresistance, and immune infiltrateJ Clin Oncol201735Suppl 458728068169
- LianWStoletovKJovelJDevelopment of a miRNA-based signature to predict human cancer metastasisCancer Res201777Suppl 131044
- FarhKKGrimsonAJanCThe widespread impact of mammalian microRNAs on mRNA Repression and EvolutionScience200531057551817182116308420
- PenchevaNTavazoieSFControl of metastatic progression by microRNA regulatory networksNat Cell Biol201315654655423728460
- WuCWStoreyKBRegulation of Smad mediated microRNA transcriptional response in ground squirrels during hibernationMol Cell Biochem20184391–215116128780752
- ZhouJHuMWangFSongMHuangQGeBmiR-224 controls human colorectal cancer cell line HCT116 proliferation by targeting Smad4Int J Med Sci2017141093794228924364
- RupaimooleRSlackFJMicroRNA therapeutics: towards a new era for the management of cancer and other diseasesNat Rev Drug Discov201716320322228209991
- LiBXuWWHanLMicroRNA-377 suppresses initiation and progression of esophageal cancer by inhibiting CD133 and VEGFOncogene201736283986400028288140
- TanakaSHosokawaMYonezawaTHayashiWUedaKIwakawaSInduction of epithelial-mesenchymal transition and down-regulation of miR-200c and miR-141 in oxaliplatin-resistant colorectal cancer cellsBiol Pharm Bull201538343544025757925
- LeibovitzAStinsonJCMcCombsWB3rdMcCoyCEMazurKCMabryNDClassification of human colorectal adenocarcinoma cell linesCancer Res19763612456245691000501
- ChenSGHeYDingJAn insertion/deletion polymorphism in the 3′ untranslated region of β-transducin repeat-containing protein (beta-TrCP) is associated with susceptibility for hepatocellular carcinoma in ChineseBiochem Biophys Res Commun2010391155255619931512
- JangJYLeeYSJeonYKLeeKJangJJKimCWANT2 suppression by shRNA restores miR-636 expression, thereby downregulating Ras and inhibiting tumorigenesis of hepatocellular carcinomaExp Mol Med2013451e323306701
- AfgarAFard-EsfahaniPMehrtashAMiR-339 and especially miR-766 reactivate the expression of tumor suppressor genes in colorectal cancer cell lines through DNA methyltransferase 3B gene inhibitionCancer Biol Ther201617111126113827668319
- ChenCXueSZhangJDNA-methylation-mediated repression of miR-766-3p promotes cell proliferation via targeting SF2 expression in renal cell carcinomaInt J Cancer201714191867187828657135
- GuYZhangMPengFThe BRCA1/2-directed miRNA signature predicts a good prognosis in ovarian cancer patients with wild-type BRCA1/2Oncotarget2015642397240625537514
- SongBJiWGuoSmiR-545 inhibited pancreatic ductal adenocarcinoma growth by targeting RIG-IFEBS Lett2014588234375438125315416
- DuBWangZZhangXMicroRNA-545 suppresses cell proliferation by targeting cyclin D1 and CDK4 in lung cancer cellsPLoS One201492e8802224505359
- WuDLiYZhangHKnockdown of Lncrna PVT1 enhances radiosensitivity in non-small cell lung cancer by sponging Mir-195Cell Physiol Biochem20174262453246628848163
- MoJZhangDYangRMicroRNA-195 regulates proliferation, migration, angiogenesis and autophagy of endothelial progenitor cells by targeting GABARAPL1Biosci Rep2016365e0039627623937
- DuJZhengRXiaoFDownregulated MicroRNA-195 in the bicuspid aortic valve promotes calcification of valve interstitial cells via targeting SMAD7Cell Physiol Biochem201744388489629176317
- TaoTShenQLuoJMicroRNA-125a regulates cell proliferation via directly targeting E2F2 in osteosarcomaCell Physiol Biochem201743276877428950256
- LiZJiangJTianLA plasma mir-125a-5p as a novel biomarker for Kawasaki disease and induces apoptosis in HUVECsPLoS One2017125e017540728467514
- Koetz-PlochLHannifordDDolgalevIMicroRNA-125a promotes resistance to BRAF inhibitors through suppression of the intrinsic apoptotic pathwayPigment Cell Melanoma Res201730332833828140520
- PopovicRRiesbeckLEVeluCSRegulation of mir-196b by MLL and its overexpression by MLL fusions contributes to immortalizationBlood2009113143314332219188669
- ShiCRenLSunCmiR-29a/b/c function as invasion suppressors for gliomas by targeting CDC42 and predict the prognosis of patientsBr J Cancer201711771036104728787434
- LiYCaiBShenLMiRNA-29b suppresses tumor growth through simultaneously inhibiting angiogenesis and tumorigenesis by targeting Akt3Cancer Lett201739711111928365400
- WangYXueJKuangHZhouXLiaoLYinFmicroRNA-1297 inhibits the growth and metastasis of colorectal cancer by suppressing cyclin D2 expressionDNA Cell Biol2017361199199928933597
- LongZHBaiZGSongJNmiR-141 inhibits proliferation and migration of colorectal cancer SW480 cellsAnticancer Res20173784345435228739727
- MutluMRazaUSaatciÖEyüpoğluEYurdusevEŞahinÖmiR-200c: a versatile watchdog in cancer progression, EMT, and drug resistanceJ Mol Med (Berl)201694662964427094812
- HurKToiyamaYTakahashiMMicroRNA-200c modulates epithelial-to-mesenchymal transition (EMT) in human colorectal cancer metastasisGut20136291315132622735571