
Abstract
Purpose
The aim of this study was to identify critical genes in lung cancer progression.
Methods
We downloaded and reanalyzed gene expression profiles from different public data-sets using comprehensive bioinformatics analysis. Differentially expressed genes (DEGs) were identified in lung adenocarcinoma tissues compared with adjacent nonmalignant lung tissues. The overlapping DEGs identified from different datasets were used for functional and pathway enrichment analyses and protein–protein interaction (PPI) analysis. Moreover, transcription factors (TFs) and miRNAs that regulated the overlapping DEGs were predicted, followed by a TF–miRNA–target network construction. Furthermore, survival analysis of genes was performed. Several genes were further validated by quantitative real-time PCR (qRT-PCR).
Results
A total of 647 overlapping upregulated genes and 979 overlapping downregulated genes were identified. The overlapping upregulated genes and downregulated genes were involved in different functions, such as cell cycle, p53 signaling pathway, immune response, and cell adhesion molecules (CAMs). Several genes belonging to the cyclin family, including CCNB1, CCNB2, and CCNA2, were hubs of the PPI network and TF–miRNA–target network. Additionally, genes, including NPAS2, GNG7, CHIA, and SLC2A1, were predicted to be prognosis-related DEGs. Gene expression profiles determined by bioinformatics analysis and qRT-PCR were highly comparable.
Conclusion
CCNB1, CCNB2, CCNA2, NPAS2, GNG7, CHIA, and SLC2A1 are promising targets for the clinical diagnosis and therapy of lung adenocarcinoma.
Introduction
Lung carcinomas are becoming a prevalent disease worldwide and are the leading cause of cancer-associated mortality among men and women.Citation1 Lung cancer is mainly classified as small cell lung cancer and non-small-cell lung cancer (NSCLC), which accounts for approximately 85% of all lung cancers.Citation2 Lung adenocarcinoma is the predominant pathological type of NSCLC. The average 5-year survival rate of NSCLC is around 15%, and adenocarcinoma makes a significant contribution.Citation3 Current standard treatments for lung cancer include surgical resection, targeted therapies, and platinum-based dual chemotherapy.Citation4 Although tremendous progress has been made concerning treatment, overall prognosis of lung cancer patients is still dismal.Citation5 Thus, it is essential to discover effective diagnostic biomarkers and better understand the mechanisms underlying lung cancer.
Gene expression profiling has become a new and powerful approach to identify molecular targets for prognostic markers and therapy.Citation6 A large-scale meta-analysis of lung cancer gene expression defined protein tyrosine kinase 7 (Inactive) (PTK7) as a specifically expressed gene in lung adeno-carcinoma.Citation7 C-X-C motif chemokine receptor 2 (CXCR2) expression was found to promote invasion and metastasis in lung adenocarcinoma.Citation8 Konstantinidou et alCitation9 showed that the RHOA–FAK signaling axis was critical for the maintenance of lung adenocarcinomas carrying activating mutations of the proto-oncogene KRAS. Recently, Lenka et alCitation10 demonstrated differential expression of STXBP6 in lung adenocarcinoma, which may be used as a novel biomarker for the prognosis of lung adenocarcinoma. Nevertheless, the significant genes associated with the progression of lung adenocarcinoma are still not well known.
In the present study, we downloaded and reanalyzed gene expression profiles from different public datasets using comprehensive bioinformatics analysis. Differentially expressed genes (DEGs) were identified in lung adenocar-cinoma tissues compared with adjacent nonmalignant lung tissues. The overlapping DEGs identified from different datasets were used for functional and pathway enrichment analyses and protein–protein interaction (PPI) analysis. Moreover, transcription factors (TFs) and miRNAs that regulated the overlapping DEGs were predicted, followed by a TF–miRNA–target network construction. Furthermore, survival analysis of genes was performed. Several genes were further validated by quantitative real-time PCR (qRT-PCR). This study aimed to identify critical genes in lung cancer progression, which may lead to the discovery of candidate biomarkers and novel therapeutic targets for lung adenocarcinoma.
Methods
Data acquisition
Microarray data GSE75037 deposited by Girard et al,Citation11 which contained a total of 166 related samples, including 83 lung adenocarcinoma tissues and 83 adjacent nonmalignant lung tissues, was downloaded from an international public repository,Citation12 Gene Expression Omnibus (GEO, http://www.ncbi.nlm.nih.gov/geo/). The data platform is the GPL6884 Illumina HumanWG-6 v3.0 expression beadchip.
In addition, mRNA-seq and clinical data from lung tumor and paired normal tissues were downloaded from FireBrowse (http://firebrowse.org/), which is a portal to cull and analyze data generated by The Cancer Genome Atlas (TCGA). We finally obtained 515 tumor samples and 59 adjacent nontumor control samples from 515 patients with lung adenocarcinoma (average age: 65 years; 277 females and 238 males). The detailed patient information is found in Table S1.
Screening of DEGs
For the GSE75037 data from the GEO database, the Student’s t-test was implemented in the limma packageCitation13 of R/Bioconductor to screen DEGs in the tumor group vs in the normal group. Benjamini–Hochberg (BH) procedureCitation14 was used for multiple test adjustment. Finally, we chose the adjusted P-value of <0.05 and the |log2 fold change (FC)| of >1 as the significant threshold to screen DEGs.
The R-package edgeRCitation15 (Version 3.4, http://www.bioconductor.org/packages/release/bioc/html/edgeR.html) was used to identify DEGs for the TCGA mRNA-seq data. Briefly, raw read count was processed using the Trimmed Mean of M-values (TMM) normalization, which is the default normalization method of the edgeR package. A generalized linear model was applied, and Voom’s precision weights were used to calculate the mean–variance relationship of the log-counts.Citation16 Afterward, differential expression analysis was performed on mRNA data in the tumor group vs in the normal group using the t-test method implemented in the limma package.Citation13 The P-value was also corrected by BH multiple correction test, resulting in an adjusted P-value. The threshold for the screening of DEGs was an adjusted P-value of <0.05 and the |log2FC| of >1.
Finally, the overlapped (common) genes between the DEGs from the GEO data and the TCGA data were collected, which were considered as significant genes associated with lung adenocarcinomas.
Functional and pathway enrichment analyses
The popular enrichment analysis tool DAVIDCitation17 (https://david-d.ncifcrf.gov/summary.jsp; Version:6.7) was used to analyze the Gene Ontology (GO) functionCitation18 and the Kyoto Encyclopedia of Genes and Genomes (KEGG) pathwaysCitation19 of the upregulated and downregulated genes, respectively. The enriched gene count of ≥2 and the hypergeometric test P-value of <0.05 were set as the significant threshold.
Construction of PPI network
Based on human PPIs in the STRING (Version: 10.0, http://www.string-db.org/) database,Citation20 PPIs for DEGs were ana-lyzed using the default parameters. Required confidence (combined score) >0.9 was selected as the threshold for PPI analysis.
Through the PPI relationship obtained in the previous step, Cytoscape softwareCitation21 was used to construct the network diagram. CytoNCA plugin (Version 2.1.6, http://apps.cytoscape.org/apps/cytonca)Citation22 was used to perform node topology analysis with the following parameter: without weight. By ranking the scores of each node, including degree centrality (DC), betweenness centrality (BC), and closeness centrality (CC), important nodes in the PPI network were obtained, namely hub protein.Citation23 Moreover, significant modules were extracted from the PPI network using the MCODE clustering algorithmCitation24 with the score threshold of >10.
Prediction of miRNAs and TFs that regulate DEGs
Enrichr (http://amp.pharm.mssm.edu/Enrichr/) is a web-based comprehensive gene set enrichment analysis resource that accumulates biological knowledge for further biological discoveries.Citation25 Enrichr uses the TargetScan database to predict miRNAs of genes.Citation26 In this study, the Enrichr tool was used to identify lung cancer-associated miRNAs. Significant enrichment results with P-values <0.05 were screened out.
Transcriptional regulation data were identified using the ITFP database (http://itfp.biosino.org/itfp) and TRANSFAC database (http://www.gene-regulation.com/pub/databases. html). We downloaded all the predicted TF–target pairs from these two databases, screened the DEGs regulated by TFs by local Perl script, and further screened the TFs for DEGs.
Cytoscape softwareCitation21 was used to integrate the miRNA– target gene network and the TF–target network, and the TF–miRNA–target network was constructed to find the major regulated genes.
Survival analysis
Clinical data of lung cancer patients were obtained from the TCGA data portal, including the overall survival (OS) time and vital status. The patients were divided into the following two groups according to the median expression value of the identified overlapping DEGs in the tumor group: high expression group and low expression group. The Kaplan– Meier curves of the two groups were drawn, and the log-rank statistical test was performed to analyze the relationship of gene and patient’s prognosis. P-value <0.05 was set as a statistically significant threshold.
qRT-PCR validation
To validate the results identified by the abovementioned analysis, the expression patterns of the top four prognosis-related DEGs were determined by qRT-PCR. The total RNA was extracted from a cultured human NSCLC cell line A549 and a human normal bronchial epithelial cell line BEAS-2B (as control) using the TRIzol reagent (Takara, Kyoto, Japan) according to the manufacturer’s protocol. Purity and concentration of isolated total RNA from cells were measured by the TECAN infinite M100 PRO Biotek microplate reader (Tecan Group, Ltd., Männedorf, Switzerland). First-strand cDNA was generated from 0.5 μg of total RNA using PrimerScript™ RT Master Mix (Takara Biotechnology Co., Ltd., Dalian,*China) according to the manufacturer’s instructions, and quantitative PCR was performed using the PowerUp SYBR™ Green Master Mix Kit (Thermo Fisher Scientific, Waltham, MA, USA) according to the manufacturer’s protocol. The total reaction volume was 20 μL, including 10 μL of SYBR Premix Ex Taq (2×), 1 μL of PCR Forward Primer (10 μM), 1 μL of PCR Reverse Primer (10 μM), and 8 μL of cDNA (diluted in double-distilled water). The qRT-PCR was set at an initial step of 3 minutes at 50°C and 3 minutes at 95°C, followed by 40 cycles at 95°C for 10 seconds and 60°C for 30 seconds. All experiments were done in triplicate, and all samples were normalized to GAPDH. The expression levels were calculated using 2−ΔΔCt methods. All primer sequences are listed in . Statistical analysis was performed with SPSS 22.0 software (IBM Corporation, Armonk, NY, USA) using Student’s t-test. Data are expressed as the mean ± SD from three independent experiments. A P-value of <0.05 was considered as statistically significant.
Table 1 The primer sequences for qRT-PCR analyses
Results
Identification of DEGs
After analysis of the GSE75037 data, 1,324 upregulated genes and 1,542 downregulated genes were obtained. For the TCGA mRNA-seq data, 2,189 upregulated genes and 2,701 downregulated genes were obtained. The intersection of DEGs from both GSE75037 and the TCGA mRNA-seq data were considered as our focus. Thus, 647 overlapping upregulated genes and 979 overlapping downregulated genes were identified.
Functional annotation of DEGs
The overlapping upregulated genes and downregulated genes were found to be involved in different GO terms and pathways. The top five GO biological process (BP) terms and pathways of overlapping upregulated genes and down-regulated genes are shown in , respectively. From the results, we found that the overlapping upregulated genes were mainly enriched in functions associated with the cell cycle, protein digestion and absorption, and p53 signaling pathway. The overlapping downregulated genes were mainly associated with the immune response and cell adhesion molecules (CAMs).
Table 2 The enriched GO BP and pathway for overlapping upregulated and downregulated genes, respectively
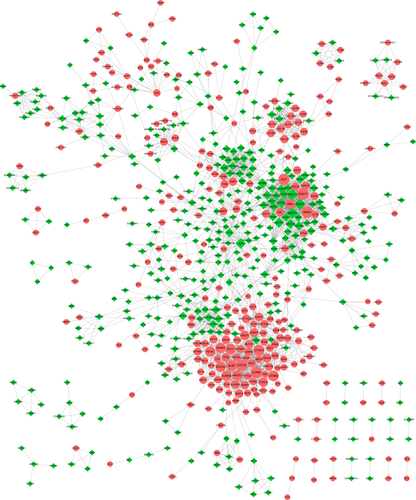
Construction of the PPI network
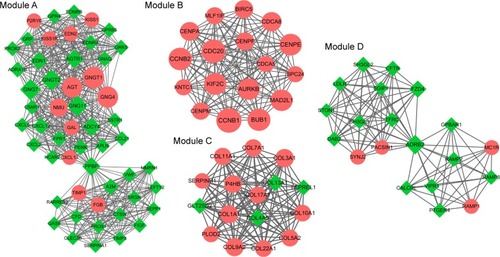
The PPI network of overlapping DEGs is shown in . The top 10 nodes with higher degree in the PPI network included G protein subunit gamma transducin 1 (GNGT1, upregulated, degree =50), G protein subunit gamma 7 (GNG7, downregulated, degree =48), G protein subunit gamma transducin 2 (GNGT2, downregulated, degree =48), G protein subunit gamma 4 (GNG4, upregulated, degree =48), cyclin B1 (CCNB1, upregulated, degree =47), G protein subunit gamma 11 (GNG11, downregulated, degree =46), angiotensinogen (AGT, upregulated, degree =45), cyclin A2 (CCNA2, upregulated, degree =43), cell division cycle 20 (CDC20, upregulated, degree =43), and Jun proto-oncogene, AP-1 TF subunit (JUN, downregulated, degree =41). Moreover, four significant modules were identified from the PPI network (). We found that the genes in module B were upregu-lated including CCNB1 and cyclin B2 (CCNB2).
Figure 1 Four modules extracted from the PPI network.
Integrated analysis of the miRNA–target gene network and TF–target network
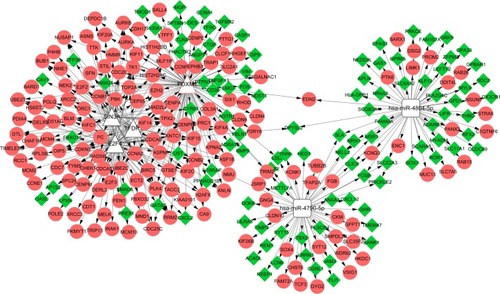
A total of two miRNAs (hsa-miR-4804-5p and hsa-miR-4790-5p) and four TFs (Forkhead Box M1 [FOXM1], TF TFDP1, E2F4, and SIN3A) were predicted to regulate the DEGs. Among them, FOXM1 was also differentially expressed in this study. Then, the TF–miRNA–target network was constructed (). We found that CCNA2 and CCNB1 can be targeted by these four TFs. CCNB2 can be regulated by a miRNA and three TFs.
Figure 2 TF–miRNA–target network of the overlapping DEGs.
Abbreviations: DEGs, differentially expressed genes; TF, transcription factor.
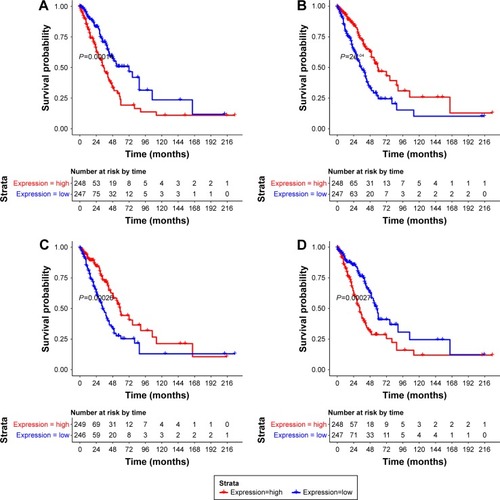
Survival analysis
A total of 232 prognosis-related DEGs were identified from the overlapping DEGs. The top four prognosis-related DEGs (ranked by P-value) were neuronal PAS domain protein 2 (NPAS2, upregulated), G-protein subunit gamma 7 (GNG7) (downregulated), chitinase, acidic (CHIA, downregulated), and solute carrier family 2 member 1 (SLC2A1, upregulated). Survival curves of these four genes are shown in .
Figure 3 Survival curves.
qRT-PCR validation
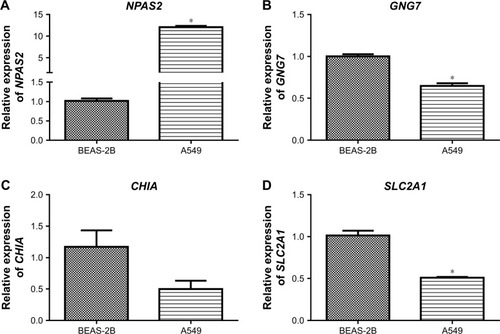
We examined the expression of the top four prognosis-related DEGs (NPAS2, GNG7, CHIA and SLC2A1) in lung cancer cell lines using qRT-PCR to validate the results of gene profiles of which NPAS2 and SLC2A1 were upregulated and GNG7 and CHIA were downregulated. As shown in , two genes (NPAS2 and GNG7) yielded concordance with the results of bioinformatics analysis; NPAS2 was indeed significantly upregulated and GNG7 was significantly down-regulated when compared with normal control cells. CHIA was downregulated without significant difference. However, SLC2A1 showed a slight expression change in the opposite direction to our initial result, which may be affected by the heterogeneity between the samples used in the downloaded datasets and qRT-PCR. Nevertheless, gene expression profiles determined by bioinformatics analysis and qRT-PCR were highly comparable.
Figure 4 qRT-PCR validation of the expression of NPAS2 (A), GNG7 (B), CHIA (C), and SLC2A1 (D) in the human non-small-cell lung cancer cell line A549 compared with those in the human normal bronchial epithelial cell line BEAS-2B. *P-value<0.05.
Discussion
In this study, we used comprehensive bioinformatics analysis to identify DEGs in human lung adenocarcinomas, by investigating the microarray data from the GEO database and data from the TCGA database. Members of the cyclin family function as regulators of the cell cycle by activating cyclin-dependent kinase (CDK) enzymes.Citation27 Deregulated expression of cyclin D1 is found frequently in cancer, and it has been demonstrated to be a biomarker of cancer progression.Citation28 Activation of CCNB1 was found to promote cell proliferation and tumor growth in colorectal cancer cells.Citation29 A study has demonstrated that CCNB2 may be used as a very reliable biomarker of lung adenocarcinoma.Citation30 In addition, the findings of Guo et al showed that CCNA2 was a biomarker for breast cancer prognosis.Citation31 In this study, CCNB1, CCNB2, and CCNA2 were identified as overlapping DEGs using data from two databases. Moreover, they were hubs in the PPI network and the TF–miRNA–target network, indicating their possible significant roles. In this context, we suggest that CCNB1, CCNB2, and CCNA2 may play critical roles in the progression of lung adenocarcinoma, which warrants further verification.
Additionally, NPAS2, GNG7, CHIA, and SLC2A1 were predicted to be prognosis-related DEGs. NPAS2 is a TF expressed primarily in the mammalian forebrain and is implicated in the regulation of the circadian rhythm.Citation32 Evidence indicates that circadian rhythm disruption promotes lung tumorigenesis.Citation33 Dysregulation of GNG7 was found in various types of cancer.Citation34,Citation35 The protein encoded by CHIA degrades chitin and chitotriose, which have relation to immune response regulation.Citation36 A study had indicated the potential roles of chitin, chitinases, and chitinase-like proteins in lung diseases.Citation37 Furthermore, the differential expression of SLC2A1 was demonstrated to promote tumor cell proliferation and metastasis.Citation38 In addition, the differential expression profile of these four candidate genes was further validated by qRT-PCR in lung cancer cells due to the current lack of tissue samples. Thereinto, SLC2A1 showed an opposite expression direction between the initial result and experiments, which may be affected by the heterogeneity between the samples used in the downloaded datasets and qRT-PCR.Citation39 Taken together, the results suggest NPAS2, GNG7, CHIA, and SLC2A1 as promising diagnostic markers for patients with lung adenocarcinoma; therefore, conducting further investigation is important.
Conclusion
Our integrated approach showed several potential targets for lung adenocarcinoma. CCNB1, CCNB2, and CCNA2 may play critical roles in the progression of lung adenocarcinoma. NPAS2, GNG7, CHIA, and SLC2A1 may be promising diagnostic markers for patients with lung adenocarcinoma. However, additional research is required to clarify whether these genes are involved in lung adenocarcinoma and to promote the development of targets for the clinical diagnosis and therapy of lung cancer.
Supplementary material
Figure S1 PPI network of the overlapping DEGs.
Disclosure
The authors report no conflicts of interest in this work.
References
- TorreLA SiegelRL JemalA Lung Cancer Statistics Adv Exp Med Biol 2016 893 1 19 26667336
- ZhaoJ LiL WangQ HanH ZhanQ XuM CircRNA Expression Profile in Early-Stage Lung Adenocarcinoma Patients Cell Physiol Biochem 2017 44 6 2138 2146 29241190
- ChengTY CrambSM BaadePD YouldenDR NwoguC ReidME The International Epidemiology of Lung Cancer: Latest Trends, Disparities, and Tumor Characteristics J Thorac Oncol 2016 11 10 1653 1671 27364315
- RoyM LuoYH YeM LiuJ Nonsmall cell lung cancer therapy: insight into multitargeted small-molecule growth factor receptor inhibitors Biomed Res Int 2013 2013 964743 23936861
- MaoY YangD HeJ KrasnaMJ Epidemiology of Lung Cancer Surg Oncol Clin N Am 2016 25 3 439 445 27261907
- KhanJ WeiJS RingnérM Classification and diagnostic prediction of cancers using gene expression profiling and artificial neural networks Nat Med 2001 7 6 673 679 11385503
- ChenR KhatriP MazurPK A meta-analysis of lung cancer gene expression identifies PTK7 as a survival gene in lung adenocarcinoma Cancer Res 2014 74 10 2892 2902 24654231
- SaintignyP MassarelliE LinS CXCR2 expression in tumor cells is a poor prognostic factor and promotes invasion and metastasis in lung adenocarcinoma Cancer Res 2013 73 2 571 582 23204236
- KonstantinidouG RamadoriG TortiF RHOA-FAK is a required signaling axis for the maintenance of KRAS-driven lung adenocarci-nomas Cancer Discov 2013 3 4 444 457 23358651
- LenkaG TsaiMH LinHC Identification of Methylation-Driven, Differentially Expressed STXBP6 as a Novel Biomarker in Lung Adenocarcinoma Sci Rep 2017 7 42573 28198450
- GirardL Rodriguez-CanalesJ BehrensC An Expression Signature as an Aid to the Histologic Classification of Non-Small Cell Lung Cancer Clin Cancer Res 2016 22 19 4880 4889 27354471
- EdgarR DomrachevM LashAE Gene Expression Omnibus: NCBI gene expression and hybridization array data repository Nucleic Acids Res 2002 30 1 207 210 11752295
- SmythGK Limma: linear models for microarray data GentlemanR CareyV HuberW IrizarryR DudoitS Bioinformatics and Computational Biology Solutions Using R and Bioconductor New York Springer 2005 397 420
- BenjaminiY HochbergY Controlling the false discovery rate: a practical and powerful approach to multiple testing J R Stat Soc Series B 1995 57 1 289 300
- RobinsonMD McCarthyDJ SmythGK edgeR: a Bioconductor package for differential expression analysis of digital gene expression data Bioinformatics 2010 26 1 139 140 19910308
- LawCW ChenY ShiW SmythGK voom: Precision weights unlock linear model analysis tools for RNA-seq read counts Genome Biol 2014 15 2 R29 24485249
- Huang daW ShermanBT LempickiRA Systematic and integrative analysis of large gene lists using DAVID bioinformatics resources Nat Protoc 2009 4 1 44 57 19131956
- HarrisMA ClarkJ IrelandA Gene Ontology Consortium The Gene Ontology (GO) database and informatics resource Nucleic Acids Res 2004 32 Database issue D258 D261 14681407
- KanehisaM GotoS KawashimaS OkunoY HattoriM The KEGG resource for deciphering the genome Nucleic Acids Res 2004 32 Database issue D277 D280 14681412
- SzklarczykD FranceschiniA WyderS STRING v10: protein-protein interaction networks, integrated over the tree of life Nucleic Acids Res 2015 43 Database issue D447 D452 25352553
- KohlM WieseS WarscheidB Cytoscape: software for visualization and analysis of biological networks Methods Mol Biol 2011 696 291 303 21063955
- TangY LiM WangJ PanY WuFX CytoNCA: a cytoscape plugin for centrality analysis and evaluation of protein interaction networks Biosystems 2015 127 67 72 25451770
- HeX ZhangJ Why do hubs tend to be essential in protein networks? PLoS Genet 2006 2 6 e88 16751849
- BaderGD HogueCW An automated method for finding molecular complexes in large protein interaction networks BMC Bioinformatics 2003 4 1 2 12525261
- KuleshovMV JonesMR RouillardAD Enrichr: a comprehensive gene set enrichment analysis web server 2016 update Nucleic Acids Res 2016 44 W1 W90 W97 27141961
- ChoSJ JungYS ChenX Poly (C)-binding protein 1 regulates p63 expression through mRNA stability PLoS One 2013 8 8 e71724 23940783
- ShapiroGI Cyclin-dependent kinase pathways as targets for cancer treatment J Clin Oncol 2006 24 11 1770 1783 16603719
- MusgroveEA CaldonCE BarracloughJ StoneA SutherlandRL Cyclin D as a therapeutic target in cancer Nat Rev Cancer 2011 11 8 558 572 21734724
- FangY YuH LiangX XuJ CaiX Chk1-induced CCNB1 overexpres-sion promotes cell proliferation and tumor growth in human colorectal cancer Cancer Biol Ther 2014 15 9 1268 1279 24971465
- StavD BarI SandbankJ Usefulness of CDK5RAP3, CCNB2, and RAGE genes for the diagnosis of lung adenocarcinoma Int J Biol Markers 2007 22 2 108 113 17549666
- GaoT HanY YuL AoS LiZ JiJ CCNA2 is a prognostic bio-marker for ER+ breast cancer and tamoxifen resistance PLoS One 2014 9 3 e91771 24622579
- DioumEM RutterJ TuckermanJR GonzalezG Gilles-GonzalezMA McKnightSL NPAS2: a gas-responsive transcription factor Science 2002 298 5602 2385 2387 12446832
- PapagiannakopoulosT BauerMR DavidsonSM Circadian Rhythm Disruption Promotes Lung Tumorigenesis Cell Metab 2016 24 2 324 331 27476975
- OhtaM MimoriK FukuyoshiY Clinical significance of the reduced expression of G protein gamma 7 (GNG7) in oesophageal cancer Br J Cancer 2008 98 2 410 417 18219292
- HartmannS SzaumkesselM SalaverriaI Loss of protein expression and recurrent DNA hypermethylation of the GNG7 gene in squamous cell carcinoma of the head and neck J Appl Genet 2012 53 2 167 174 22183866
- Di RosaM DistefanoG ZorenaK MalaguarneraL Chitinases and immunity: Ancestral molecules with new functions Immunobiology 2016 221 3 399 411 26686909
- MackI HectorA BallbachM The role of chitin, chitinases, and chitinase-like proteins in pediatric lung diseases Mol Cell Pediatr 2015 2 1 3 26542293
- YanS WangY ChenM LiG FanJ Deregulated SLC2A1 Promotes Tumor Cell Proliferation and Metastasis in Gastric Cancer Int J Mol Sci 2015 16 7 16144 16157 26193257
- DallasPB GottardoNG FirthMJ Gene expression levels assessed by oligonucleotide microarray analysis and quantitative real-time RT-PCR – how well do they correlate? BMC Genomics 2005 6 59 15854232