
Abstract
Purpose
Oral squamous cell carcinoma (OSCC) is one of the most common malignant diseases worldwide, yet its molecular mechanisms are largely unknown. We aimed to construct gene co-expression networks to identify key modules and hub genes involved in the pathogenesis of OSCC.
Patients and methods
We used dataset GSE30784 to construct co-expression networks by weighted gene co-expression network analysis (WGCNA). Gene Ontology (GO) and Kyoto Encyclopedia of Genes and Genomes (KEGG) enrichment analyses were performed by Database for Annotation, Visualization and Integrated Discovery (DAVID). Hub genes were screened and validated by other datasets.
Results
Turquoise and brown modules were found to be the most significantly related to tumorigenesis. Functional enrichment analysis showed that the turquoise module was associated with cell–cell adhesion, extracellular matrix and collagen catabolic process. A total of 10 hub genes (MMP1, TNFRSF12A, PLAU, FSCN1, PDPN, KRT78, EVPL, GGT6, SMIM5 and CYSRT1) were identified and validated at transcriptional and translational levels. Their genetic alteration and survival analysis were also revealed.
Conclusion
We identified two modules and 10 hub genes, which were associated with the tumorigenesis of OSCC. The two modules provided references that will advance the understanding of mechanisms of tumorigenesis in OSCC. Moreover, the hub genes may serve as biomarkers and therapeutic targets for precise diagnosis and treatment of OSCC in the future.
Introduction
Head and neck cancer is a type of upper gastrointestinal cancer based on anatomical structure. Head and neck squamous cell carcinoma (HNSC) is a common malignancy in the world, which accounts for 90% of head and neck cancers, and oral squamous cell carcinoma (OSCC) is the main subtype of HNSC. OSCC is characterized by high incidence of masses in the oral cavity, which leads to high mortality.Citation1 The incidence of OSCC is associated with smoking, drinking and diet. In addition, viral infections, especially human papillomavirus (HPV), and the lack of vitamins and trace elements such as folic acid; vitamins A, C and E; zinc and selenium are also important etiological factors that can contribute to the incidence of OSCC.Citation2–Citation4 Accumulation of genetic alterations in oral epithelial cells is also considered to trigger the initiation and progression of OSCC.Citation5 Considering recent developments in molecular biological research, it has been discovered that the occurrence and development of OSCC are related to the activation of oncogenes such as Bcl-2, c-Myc and EGFRCitation6,Citation7 and the inactivation of p53, Rb, p16 and p21 tumor suppressor genes.Citation8,Citation9 However, the occurrence of tumors is a complex and progressive process that is multifactorial, multistage and multistep. The molecular pathogenesis of OSCC remains unclear, and therefore, it is difficult to prevent the pathogenesis of OSCC and improve the survival rate of OSCC patients. In order to diagnose OSCC at its early stage and improve its treatment effect, better understanding of the pathomechanism of OSCC development is needed.
With the discovery and development of high-throughput research methods, systematic description, high-throughput data analysis and screening of important information are the basis for subsequent research. Previous research has been largely focused on studying individual molecules with little focus on functional networks. However, the development of cancer is a systematic biological process (BP) that traverses different functional networks. Weighted gene co-expression network analysis (WGCNA)Citation10 is a new tool that is used to analyze the potential gene modules that function in the gene expression data. It has been reported that WGCNA can be used to analyze many BPs, such as genetics, multiple cancers and brain imaging data analysis,Citation11 and hence can be useful to identify candidate biomarkers or therapeutic targets. Besides, it can be applied in comparing differentially expressed genes and help investigating the interactions among genes in different modules.Citation12 WGCNA has been successfully applied in various types of cancer, such as breast cancer,Citation13 glioblastomaCitation14 and prostate cancer,Citation15 in which WGCNA is used to investigate the relationship between tissue microarray data and clinical traits to identify rules for predicting survival outcome of patients.
In this study, WGCNA was constructed on the basis of data from GSE30784, which included 167 OSCC samples, 17 dysplasia samples and 45 normal samples. Key gene modules associated with tumorigenesis of OSCC were identified, and the biological functions and pathways of genes in the two modules were detected and analyzed. Hub genes in turquoise and brown modules were also revealed and were validated by other datasets of GSE74530 and TCGA. Information on their genetic alterations and clinical features were also revealed. We postulated that these genes and modules might be potential biomarkers for the diagnosis and treatment of OSCC and might contribute to our understanding of the molecular mechanisms of its tumorigenesis.
Patients and methods
Data information
The OSCC datasets of GSE30784 and GSE74530 were obtained from NCBI Gene Expression Omnibus (GEO) (https://www.ncbi.nlm.nih.gov/geo/). GSE30784 consists of 167 OSCC samples, 17 dysplasia samples and 45 normal samples, and the platform is [HG-U133_Plus_2] Affymetrix Human Genome U133 Plus 2.0 Array. As for the GSE74530, it contains six OSCC samples and six normal samples, and its platform is also [HG-U133_Plus_2] Affymetrix Human Genome U133 Plus 2.0 Array. The R packages affy and annotate were used to process the raw data, make expression matrix and match the probe to their gene symbol.
Construction of WGCNA
The raw data of GSE30784 were downloaded from the GEO database. We used the affy package (under the R environment, version 3.4.3) to preprocess and normalize (RMA normalization) the raw data (.CEL files). The parameters were set as RMA (for background correction) and impute (for supplemental missing value). Ranked by SD from large to small (including normal, dysplasia and OSCC samples), we chose the top 5,000 genes for WGCNA. R package WGCNA was conducted, and the power parameter was pre-calculated by the pickSoftThreshold function. It can provide the appropriate soft-thresholding power for network construction by calculating the scale-free topology fit index for several powers. Turning adjacency into topological overlap was carried out, which could measure the network connectivity of a gene defined as the sum of its adjacency with all other genes for the network generation. Hierarchical clustering function was used to classify genes with similar expression profile into modules based on the TOM dissimilarity with a minimum size of 50 for the gene dendrogram. The dissimilarity of module eigengenes was calculated to choose a cutline to merge some modules. The gene network was visualized with randomly selected 1,000 genes. Last visualization in gene network of eigengenes was also carried out.
Identification of clinical significant modules
We calculated the correlation between MEs and clinical trait to identify the relevant module. Afterward, gene significance (GS) was defined as the log10 transformation of the P-value (GS=lgP) in the linear regression between gene expression and clinical information. In addition, module significance (MS) was defined as the average GS for all the genes in a module. In general, the module with the absolute MS ranked first among all the selected modules was considered as the one related with clinical trait.
Function enrichment analysis
To get further insight into the function of genes in key modules, we performed the Gene Ontology (GO) enrichment analysis for modules by using the online Database for Annotation, Visualization and Integrated Discovery (DAVID; https://david.ncifcrf.gov/summary.jsp).Citation16,Citation17 The gene lists of modules were uploaded, and we got the results of BP, cellular component (CC), molecular function (MF) and Kyoto Encyclopedia of Genes and Genomes (KEGG) pathway. P-value ⩽0.05 was regarded as significant.
Identification of hub genes in key modules
Hub genes that are highly interconnected with nodes in a module have been considered as functionally significant. In this study, key modules were selected and were visualized by Cytoscape and hub genes in networks were screened out by degree. Hub genes ranked top 30 in module networks were chosen as the candidates for further analysis and validation. GEPIA (http://gepia.cancer-pku.cn/)Citation18 is a Web server for analyzing the RNA sequencing expression data of 9,736 tumors and 8,587 normal samples from the TCGA and the GTEx projects, using a standard processing pipeline. Survival analysis of candidate genes was carried out in GEPIA, and the significant results were picked out (logrank P⩽0.05). We chose the top five genes in each module with significant results of survival analysis and ranked them by node degree as hub genes in OSCC tumorigenesis.
Validation of hub genes
The “limma” R package was used to screen the differently expressed genes (DEGs) between OSCC samples and normal samples in dataset GSE74530 for validation. The cutoff value was log2FC⩾|2|, adjusted P-value ⩽0.01. Volcano plot and hierarchical clustering analysis were carried out by R packages ggplot2 and pheatmap, respectively. Venn diagram was performed by online tool jvenn (http://jvenn.toulouse.inra.fr/app/example.html)Citation19 to overlap the gene in key modules and DEGs. The expression statuses of hub genes in GSE30784, GSE74530 and TCGA HNSC were revealed for validation. P-value ⩽0.05 was regarded as significant. The translational-level validation of hub genes was carried out using The Human Protein Atlas database (https://www.proteinatlas.org/).Citation20
Genetical alteration of hub genes
CBio Cancer Genomics Portal (http://www.cbioportal.org/)Citation21,Citation22 is an open platform that provides visualization, analysis and downloads of large-scale cancer genomic datasets of various cancers. Complex cancer genomic profiles can be easily obtained by using the query interface of the portal, enabling researchers to explore and compare genetic alterations across samples. We used CBioPortal to explore genetic alterations connected with the 10 hub genes and their correlation with other famous genes and drugs.
Results
Expression value analysis of microarray data
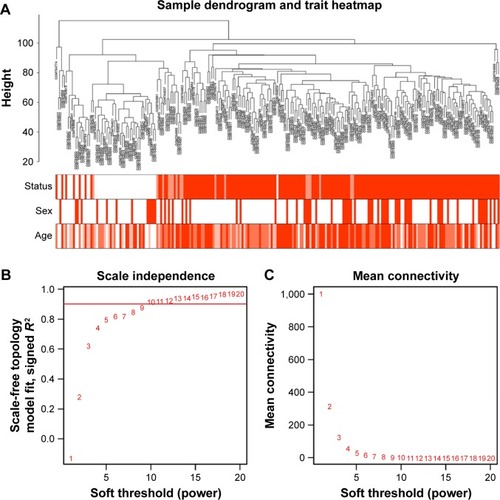
To construct the gene co-expression networks, the raw data of GSE30784 were downloaded from GEO database. Raw data were preprocessed identically by using R for background correction and normalization. R package annotation were conducted to match probes and gene symbols, and the probes matching several genes were removed, and for the gene matched by multiple probes, the median was regarded as the final expression value. At last, we obtained a total 20,027 genes. We calculated SD for each gene and ranked them from large to small, and then, the top 5,000 genes were chosen for WGCNA. The 5,000 genes were used for cluster analysis by fashClust function of the WGCNA package (). As we can see, 229 samples were divided into two clusters on the whole.
Figure 1 Clustering of samples and determination of soft-thresholding power.
Abbreviations: OSCC, oral squamous cell carcinoma; WGCNA, weighted gene co-expression network analysis.
Construction of weighted co-expression network and identification of key modules
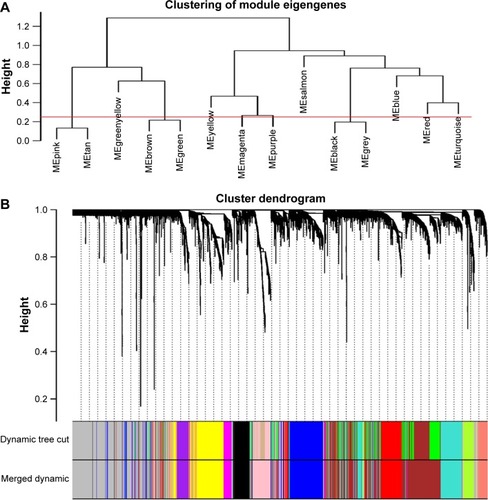
Selection of the soft-thresholding power is an important step when constructing a WGCNA. We performed the analysis of network topology for thresholding powers from 1 to 20 and identified the relatively balanced scale independence and mean connectivity of the WGCNA. As shown in , power value 9, which was the lowest power for the scale-free topology fit index on 0.9, was selected to produce a hierarchical clustering tree (dendrogram) of 5,000 genes. We set the MEDissThres as 0.25 to merge similar modules (), and 11 modules were generated (). There were 223 genes in the black module, 518 genes in the blue module, 954 genes in the brown module, 139 in genes in the greenyellow module, 172 genes in the magenta module, 302 genes in the pink module, 143 genes in the purple module, 379 genes in the red module, 112 genes in the salmon module, 530 genes in the turquoise module and 471 genes in the yellow module. The genes that could not be included in any modules were put into the gray module, which was removed in the subsequent analysis. Module preservation analyses for the process of normal to dysplasia and dysplasia to neoplasm are shown in .
Figure 2 Construction of co-expression modules by WGCNA package in R.
Abbreviation: WGCNA, weighted gene co-expression network analysis.
Correlation between modules and identification of key modules
Interaction relationships of the 11 modules were analyzed, and the network heatmap was plotted (). The results revealed that each module was an independent validation to each other, which demonstrated a high level of independence among the modules and relative independence of genes expression in each module. Besides, we calculated eigengenes and clustered them according to their correlation in order to explore co-expression similarity of all modules (). We found that the 11 modules were mainly divided into two clusters. Similar results were demonstrated by the heatmap plotted according to adjacencies (). Furthermore, the ME of the turquoise module and brown module revealed a high correlation with disease status (normal, dysplasia and OSCC) compared with other modules (). The turquoise module was positively correlated with the disease status, while the brown module was negatively correlated with the disease status, indicating that the turquoise module may play an important role in tumorigenesis of OSCC and the brown module may function as an antitumor. We identified the turquoise module and brown module as the modules most relevant to the disease status of OSCC. illustrates the correlation between module membership and GS in turquoise and brown modules, respectively.
Figure 3 (A) Interaction relationship analysis of co-expression genes. Different colors of horizontal axis and vertical axis represent different modules. The brightness of yellow in the middle represents the degree of connectivity of different modules. There was no significant difference in interactions among different modules, indicating a high-scale independence degree among these modules. (B) Heatmap of the correlation between module eigengenes and the disease status of OSCC. The turquoise module was the most positively correlated with status, and the brown module was the most negatively correlated with status. (C) Hierarchical clustering of module hub genes that summarize the modules yielded in the clustering analysis. (D) Heatmap plot of the adjacencies in the hub gene network.
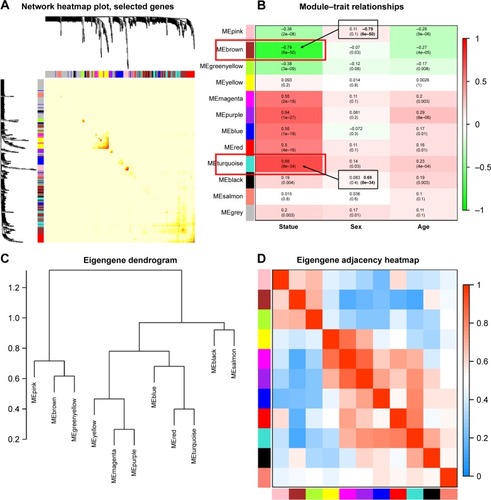
Figure 4 (A) Scatter plot of module eigengenes in the turquoise module. (B) Scatter plot of module eigengenes in the brown module. (C) The top 30 hub genes in the turquoise module. (D) The top 30 hub genes in the brown module. Nodes represent genes, and node size is correlated with connectivity of the gene by degree.
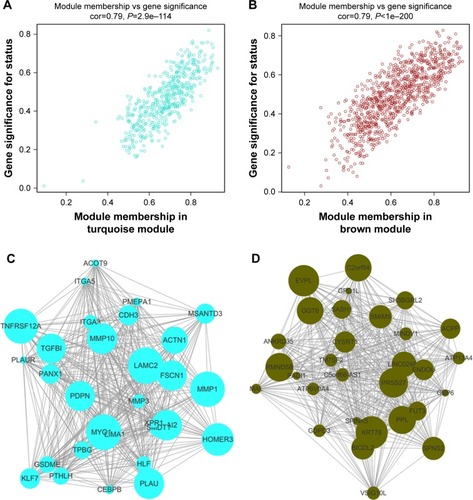
Identification of hub genes in the turquoise module and brown module
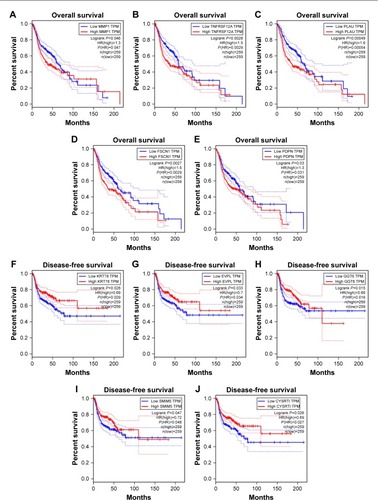
We visualized the turquoise module and the brown module as networks in Cytoscape and screened out 30 genes by sorting node degree candidate gene for further analysis. shows the top 30 hub genes in the turquoise module and brown module. We used GEPIA to perform survival analysis; P⩽0.05 was regarded as statistically significant. The genes with a significant result of survival analysis were selected and ranked by node degree. The top five genes in each module were considered as hub genes. shows the survival analysis of hub genes (A–E were hub genes in the turquoise module and F–J were hub genes in the brown module). They were MMP1, TNFRSF12A, PLAU, FSCN1 and PDPN in the turquoise module and KRT78, EVPL, GGT6, SMIM5 and CYSRT1 in the brown module. The survival analysis of the 10 hub genes were validated in another GEO dataset, GSE41613 ().
Figure 5 Survival analysis of hub genes.
Function enrichment analysis in two key modules
We performed enrichment analysis to explore the BP and pathway in which the two key modules were involved. GO enrichment of BP was conducted by DAVID, and the detailed information is given in . As the results show, the brown module was mainly enriched in regulation of epidermis such as epidermis development, epithelial cell differentiation and keratinocyte differentiation, which were negatively correlated with tumorigenesis. In the turquoise module, the results of enrichment analysis were mainly concerned with tumorigenesis of malignancy such as positive regulation of cell migration, angiogenesis, cell adhesion, cell–matrix adhesion and extracellular matrix (ECM) organization, which played an important role in tumorigenesis, invasion, migration and metastasis of OSCC.
Table 1 GO enrichment analysis of turquoise module and brown module
As for the pathways in which these two modules were involved, we performed KEGG pathway analysis, and the details of the results are shown in . As we can see, the brown module enriched in pathways of metabolism of biological compounds such as steroid biosynthesis, leucine and isoleucine degradation, biosynthesis of antibiotics and glycerolipid metabolism. In the turquoise module, pathways concerning with regulation of cell adhesion were significantly enriched such as focal adhesion, PI3K–Akt signaling pathway and ECM–receptor interaction, which were closely related with malignancy.
Table 2 KEGG pathway enrichment analysis of turquoise module and brown module
A direct comparison of the network constructed from tumor vs normal samples of GSE30784 for providing solid insights (). The GO enrichment analysis and the KEGG pathway analysis were carried out for the DEGs mentioned earlier ( and ). The enrichment analysis results between modules from WGCNA and DEGs were similar, which means that the results were reliable.
Validation of hub genes
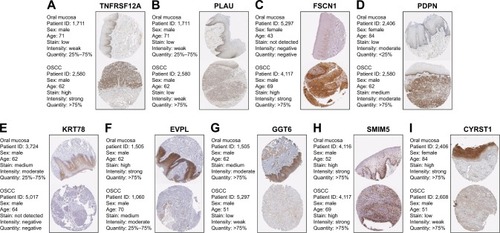
We used another dataset GSE74530 from GEO database to validate the expression status of the 10 hub genes. We set the cutoff as logFC⩾|1| and P⩽0.05 to screen DEGs. shows the volcano plot of DEGs, and shows hierarchical clustering heat map of DEGs. We overlapped the DEGs and genes in the turquoise module and brown module by venn diagram and found that the 10 hub genes were all present in DEGs and modules. The results are shown in . demonstrates the expression status of 10 hub genes in normal, dysplasia and OSCC samples of GSE30784. As shown in the figure, the expression status was in accordance with the disease status in which expression of five hub genes of the turquoise module was positively correlated with disease status and expression of five hub genes of the brown module was negatively correlated with disease status. illustrates the validation of 10 hub genes in GSE74530, which presents a similar conclusion with GSE30784, that the hub genes in the turquoise module were highly expressed in tumor samples, while hub genes in the brown module were highly expressed in normal samples. We further analyzed TCGA data of HNSCs to validate the results and found similar results as described earlier (). Moreover, immunohistochemistry (IHC) staining obtained from The Human Protein Atlas database also demonstrated the expression status of hub genes and the patient data as shown in . shows hub genes in the turquoise module, whose results were in accordance with the transcriptional level, but there were no related IHC samples of MMP1 in the database. shows hub genes in the brown module, and results were in accordance with transcriptional level before. These results confirmed the validity of the hub genes that we found as reliable.
Figure 6 Validation of hub genes in GSE31056.
Abbreviations: DEGs, differently expressed genes; OSCC, oral squamous cell carcinoma.
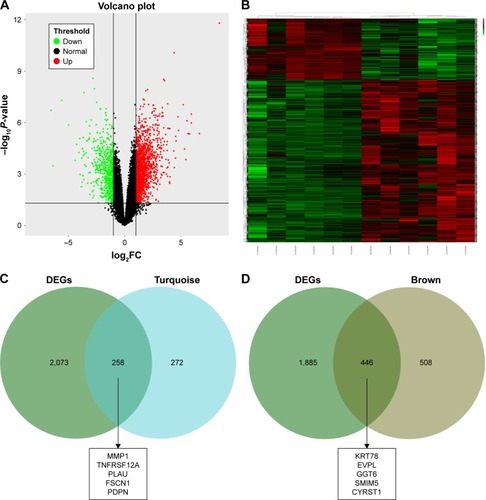
Figure 7 Validation of hub genes in the transcriptional level.
Abbreviations: WGCNA, weighted gene co-expression network analysis; HNSC, head and neck squamous cell carcinoma.
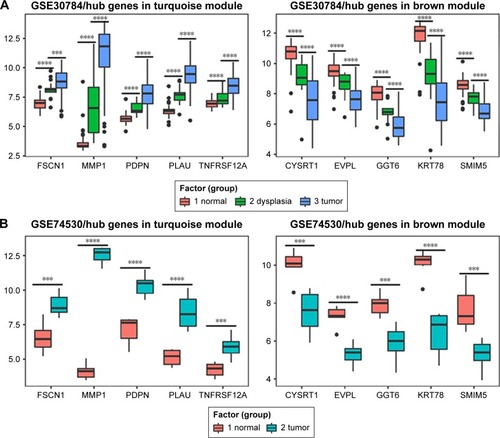
Figure 8 Validation of hub genes in the translational level.
Abbreviations: IHC, immunohistochemistry; OSCC, oral squamous cell carcinoma.
Genetical alteration of hub genes
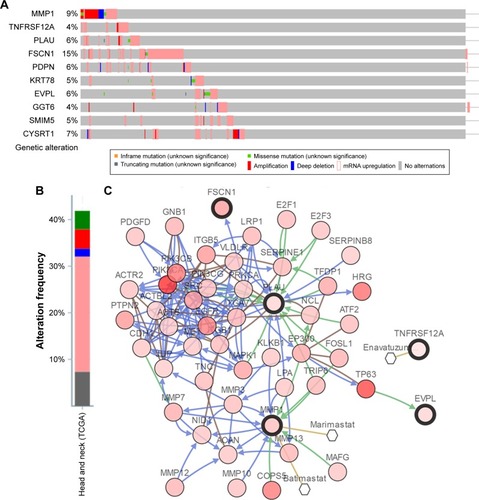
OncoPrint of CBioPortal was used to show the 10 hub genes’ alteration statuses in TCGA HNSC patients. The 10 hub genes altered in 222 (44%) of 510 patients (), and the frequency of alteration of each hub gene is shown in . FSCN1 and MMP1 altered most (15% and 9%, respectively), amplification, and mRNA upregulation was the main type. demonstrates the relationship of the 10 genes and the other 50 most frequently altered neighbor genes (only MMP1, PLAU, FSCN1 and EVPL had connection with these 50 genes). PIK3CA and TP63 were significantly important in the network. The correlation of antitumor drugs and hub genes was exhibited; we found MMP1 and TNFRSF12A were the target of cancer drugs, as for the other hub genes, there was no drug targeting to them, which might be the promising target of new cancer drugs.
Figure 9 Genetic alterations associated with hub genes in TCGA HNSC.
Abbreviation: HNSC, head and neck squamous cell carcinoma.
Discussion
OSCC is a common malignancy caused by abnormal squamous cells, which mainly occurs in older adults. Clinical symptoms are not often present in the early stages of the disease but are observed in the late stages of the disease. Its 5-year survival rate is 50%.Citation23 In patients with high metastasized cancer, the 5-year survival rate drops to ~20%,Citation24 which can seriously harm human health and life. Although the new and advanced medical methods have greatly improved the quality of life for patients with OSCC, the 5-year survival rate has not yet improved significantly. Therefore, it is of great help for the prevention and treatment of OSCC to study the development of OSCC at the molecular level and develop effective measures to prevent and suppress metastasis of OSCC. In the present study, we applied WGCNA to identify the key modules and hub genes in tumorigenesis of OSCC by R and identified two modules that were most significantly associated with the OSCC disease status (the turquoise module was positively correlated with OSCC status, and the brown module was negatively correlated with the disease status). Functional enrichment analysis of the two modules was performed by DAVID. A total of 10 hub genes with significant correlation with survival analysis in the two modules were identified and were further validated in another dataset and TCGA to confirm the reliability of the results. CBioPortal was used to show the correlation between hub genes and genetic alteration. The results provide novel insights that will help to explain the pathogenesis of OSCC at the molecular level, and the hub genes might serve as biomarkers as well as therapeutic targets for precise diagnosis and treatment of OSCC in the future.
In this study, we used a global approach to construct co-expression network of OSCC to predict clusters of genes involved in the pathogenesis and tumorigenesis of OSCC. We aimed to find new and critical biomarkers and to understand the molecular mechanism of OSCC, which might contribute to the diagnosis and treatment of the disease. In this study, WGCNA was performed by extracting co-expression networks of group genes from a large expression data.Citation25 GSE30784 was downloaded from the GEO database, and 11 co-expression modules were obtained by WGCNA. Among the 11 modules, we found that the turquoise module and brown module were most significantly related to the OSCC status, in which the turquoise module was positively correlated and the brown module was negatively correlated. There are many genome-wide gene expressions of OSCC datasets available, and there are many opportunities for researchers to use these data to carry out multiple analyses. However, there are challenges in data analysis. For example, data from different platforms cannot be compared together, but WGCNA methods avoid this limitation by focusing on a group of genes rather than on individual genes. Besides, the cutoff criterion is not necessary for WGCNA, and hence, important information that is omitted when using other methods can be retrieved. Until now, WGCNA has been applied in many cancers such as pancreatic cancer,Citation26 breast cancerCitation27 and osteosarcoma.Citation28 Although there were some reports on OSCC based on expression profiles,Citation29 their disadvantages were obvious. There were no studies in which the expression profile of OSCC was analyzed by WGCNA. In this study, we used WGCNA to analyze OSCC from a new perspective.
From our research, the turquoise module and brown module identified by WGCNA were the most significantly related modules to OSCC disease status, indicating their importance in OSCC invasion, metastasis, migration and tumorigenesis. It has been reported that the epithelial–mesenchymal transition and the loss of cell adhesion are significant gene– molecular changes in the development and progression of OSCC.Citation30 We found that the turquoise module played a role in the BPs and pathways, mainly in the regulation of ECM and collagen catabolic process, which play important roles in malignancy.Citation31 The results were in accordance with previous reportsCitation32 that analyzed the DEGs between normal samples and OSCC in which the function of ECM was stressed and the MMP family and laminin family play an important role in tumorigenesis of OSCC.Citation33 These findings revealed the function of the turquoise module in OSCC, and further research is required to identify the role of the genes in the turquoise module because they might have diverse functions in OSCC malignant phenotypes. The KEGG pathway analysis revealed similar results. These pathways were concerned with cell adhesion such as focal adhesion, PI3K–Akt signaling pathway and ECM–receptor interaction. ECM proteolysis confers cancer cells with invasive capability, and it influences migration in many types of cancers.Citation34 It has been reported that COL11A1 promoted tumor progression in EOC via ECM–receptor interactions.Citation35 FAK is an important mediator of proliferation, cell survival and cell migration; the development of malignancy is often associated with abnormal FAK activity.Citation36 It has been reported in OSCC that focal adhesion is related to cell proliferation.Citation37 PI3K–Akt pathway plays an important role in cancer cell cycle progression, apoptosis and neoplastic transformationCitation38 and is involved in many of the mechanisms targeted by newer antitumor drugs.
As for the brown module, GO analysis revealed that it is involved in the regulation of epidermis development and epithelial cell differentiation, which oppose OSCC EMT. The brown module decreased in those BP that promotes the OSCC EMT, resulting in invasion and metastasis of tumor cells.Citation39 This illustrated an important role of the brown module as an antitumor.
Owing to the importance of turquoise and brown module in OSCC tumorigenesis, we screened the hub genes in the two modules. We found MMP1, TNFRSF12A, PLAU, FSCN1 and PDPN in the turquoise module and KRT78, EVPL, GGT6, SMIM5 and CYRST1 in the brown module. They were significantly related to survival analysis results and were validated by other data at transcriptional and translational levels. Many studies have reported that some of the 10 hub genes were cancer-related genes, which function in tumorigenesis and malignant phenotypes such as MMP1, TNFRSF12A and FSCN. As for PLAU, PDPN, KRT78, EVPL, GGT6, SMIM5 and CYSRT1, there were few reports implicating them in cancers. MMP1 encodes for a member of the peptidase M10 family of MMPs. It is involved in the breakdown of ECM in normal physiological processes, such as embryonic development, reproduction and tissue remodeling, as well as in disease processes, such as arthritis and metastasis. It was shown that MMP1 associated with Ras, thereby initiating malignant tumor formation and leading to aberrant regulation of cell survival, proliferation and mobilization.Citation40 TNFRSF12A encodes receptor for TNFSF12/ TWEAK. It can promote angiogenesis and modulate cellular adhesion to matrix proteins. Knockdown of TNFRSF12A would lead to inhibition of cell proliferation and migration in hepatocellular carcinoma,Citation41 but no report has shown that it is linked to OSCC. PLAU encodes for a secreted serine protease that converts plasminogen into plasmin. Mutations in this gene may be associated with Quebec platelet disorder and late-onset Alzheimer’s disease. Studies on PLAU were mainly focused on Alzheimer’s disease, but several reports have shown that PLAU played an important role in breast cancer cell line aggression and metastasis.Citation42 PLAU mutation occurs more or less in many cancer types, but there was no study that reported the effects of PLAU mutation in cancers. However, in Quebec platelet disorder, tandem duplication of a 78 kb region of chromosome 10 containing PLAU (the uPA gene) would lead to increasing production of normal PLAU transcripts.Citation43 FSCN1 encodes for a member of the fascin family of actin-binding proteins, which plays a critical role in cell migration, motility, adhesion and cellular interactions. It has been reported that overexpression of this gene may play a role in the metastasis of multiple types of cancer by increasing cell motility. For instance, in esophageal cancer, tumor-suppressive miRNAs target FSCN1 and directly control oncogenic FSCN1 gene.Citation44 FSCN1 gene alteration was rarely reported, but there was a report showing that alteration of FSCN1 increased when using demethylating agent, resulting in drug resistance of gastric cancer.Citation45 However, there are no reports implicating it in OSCC at present. PDPN encodes for type I integral membrane glycoprotein, which has diverse distribution in human tissues. The specific function of this protein has not been determined, but it has been proposed to be a marker of lung injury. The role of PDPN in cancers has not been studied at present. Alteration of PDPN was reported to be associating with keratocystic odontogenic tumors’ neoplastic invasion.Citation46 EVPL encodes for a member of the plakin family of proteins that forms a component of desmosomes and the epidermal cornified envelope. It has been reported that EVPL was underexpressed in esophageal squamous cell carcinoma compared to normal tissue, and hence, it may be used for early detection of ESCC.Citation47 The EVPL gene mutation was closely linked to the tylosis esophageal cancer locus in sporadic OSC and could be the target gene responsible for OSC.Citation48 OSCC was similar to OSC, which means the EVPL mutation also plays an important role in OSCC. As for KRT78, GGT6, SMIM5 and CYSRT1, they are relatively new molecules with only few reports regarding their role in OSCC at present. Nevertheless, they played an important role in OSCC tumorigenesis and were significantly different between normal samples and OSCC. Further research is required to fully explore their roles in OSCC.
We acknowledge there were some limitations and shortcomings in this study. First, this study was mainly focused on the data mining and data analysis, which were based on methodology and the results were not validated by experiments. Further experiments are needed to better confirm the findings of this study. Second, the clinical parameters and prognosis were not well analyzed in this study because of the availability of data. Last, the datasets we could obtain were limited. We could only find one dataset that contained normal samples, dysplasia samples and OSCC samples. If there would have been another dataset that contained these three or more statuses of OSCC, it would be much better. Besides, we only validated our findings in one GEO dataset and TCGA data; more datasets should be involved to obtain a solid result.
Conclusion
We applied WGCNA to construct co-expression network for exploring the development of OSCC (from normal to dysplasia and normal to OSCC) for the first time and found two modules (turquoise module and brown module) and 10 hub genes (MMP1, TNFRSF12A, PLAU, FSCN1, PDPN, KRT78, EVPL, GGT6, SMIM5 and CYRST1), which played an important role in OSCC tumorigenesis. The turquoise module plays a positive role in OSCC tumorigenesis, which includes functions of cell migration, cell adhesion and ECM, and the brown module plays a negative role in tumorigenesis, which functions opposite to the turquoise module. The two modules may provide a better understanding of the mechanisms of tumorigenesis in OSCC patients. Moreover, the 10 hub genes we newly found might serve as prognostic biomarkers and therapeutic targets in the future.
Acknowledgments
This study was partially supported by the National Nature Science Foundation of China (Grant Nos 81470719 and 81611140133) to Li M.
Supplementary materials
Figure S1 The medianRank and Zsummary statistics of module preservation.
Abbreviation: OSCC, oral squamous cell carcinoma.
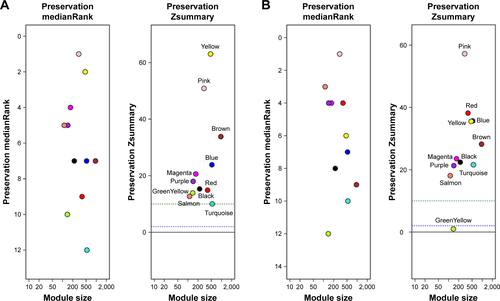
Figure S2 (A) Volcano plot visualizing DEGs in GSE30784 (45 normal samples and 167 OSCC). The vertical lines demark the fold change values. The right vertical line corresponds to more than or equal to twofold up changes, and the left vertical line corresponds to twofold down changes, while the horizontal line marks a –log10 adjusted P-value of 0.01. (B) Heat map hierarchical clustering reveals DEGs in OSCC groups compared with control groups.
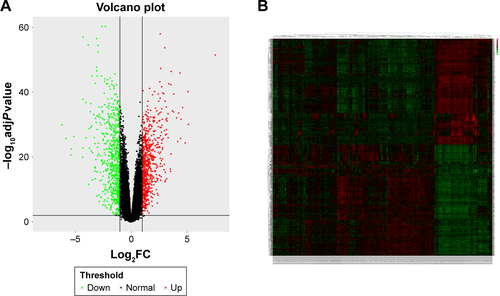
Figure S3 Survival analysis of the 10 hub genes using GSE41613 for validation.
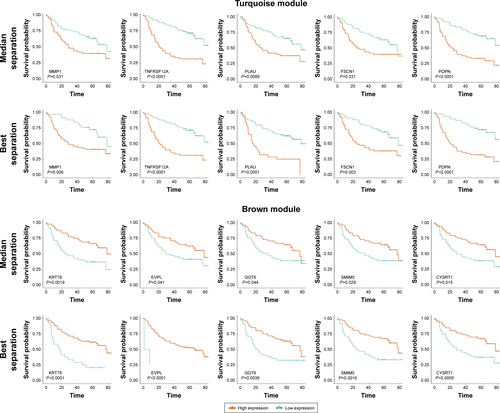
Table S1 GO enrichment analysis of DEGs
Table S2 KEGG pathway enrichment analysis of turquoise module and brown module
Disclosure
The authors report no conflicts of interest in this work.
References
- MignognaMDFedeleSLo RussoLThe World Cancer Report and the burden of oral cancerEur J Cancer Prev200413213914215100581
- HosokawaSTakahashiGOkamuraJRisk and prognostic factors for multiple primary carcinomas in patients with head and neck cancerJpn J Clin Oncol201848212412929244150
- JacobsCDEtiologic considerations for head and neck squamous cancersCancer Treat Res1990522652821976370
- FalkRTPickleLWBrownLMMasonTJBufflerPAFraumeniJFEffect of smoking and alcohol consumption on laryngeal cancer risk in coastal TexasCancer Res19894914402440292736543
- ChoiSMyersJNMolecular pathogenesis of oral squamous cell carcinoma: implications for therapyJ Dent Res2008871143218096889
- MarioniGStaffieriALionelloMRelationship between anti-apoptotic proteins survivin and Bcl-2, and response to treatment in patients undergoing post-operative RT for laryngeal cancer: a pilot studyJ Oral Pathol Med201342433934423126236
- FuSGuoYChenHMYCT1-TV, a novel MYCT1 transcript, is regulated by c-Myc and may participate in laryngeal carcinogenesisPLoS One2011610e2564821998677
- JalaliMMHeidarzadehAZavareiMJSarmastHp53 overexpression impacts on the prognosis of laryngeal squamous cell carcinomasAsian Pac J Cancer Prev20111271731173422126554
- BoonyaphiphatPPruegsanusakKThongsuksaiPThe prognostic value of p53, Bcl-2 and Bax expression in laryngeal cancerJ Med Assoc Thai201295101317132023193747
- ZhangBHorvathSA general framework for weighted gene co-expression network analysisStat Appl Genet Mol Biol20054 Article17
- IvlievAE‘t HoenPASergeevaMGCoexpression network analysis identifies transcriptional modules related to proastrocytic differentiation and sprouty signaling in gliomaCancer Res20107024100601007021159630
- ClarkeCMaddenSFDoolanPCorrelating transcriptional networks to breast cancer survival: a large-scale coexpression analysisCarcinogenesis201334102300230823740839
- PressonAPYoonNKBagryanovaLProtein expression based multimarker analysis of breast cancer samplesBMC Cancer20111123021651811
- XiangYZhangCQHuangKPredicting glioblastoma prognosis networks using weighted gene co-expression network analysis on TCGA dataBMC Bioinformatics201213Suppl 2S12
- WangLTangHThayanithyVGene networks and microRNAs implicated in aggressive prostate cancerCancer Res200969249490949719996289
- DawHuangShermanBTLempickiRABioinformatics enrichment tools: paths toward the comprehensive functional analysis of large gene listsNucleic Acids Res200937111319033363
- DawHuangShermanBTLempickiRASystematic and integrative analysis of large gene lists using DAVID bioinformatics resourcesNat Protoc200941445719131956
- TangZLiCKangBGaoGLiCZhangZGEPIA: a web server for cancer and normal gene expression profiling and interactive analysesNucleic Acids Res201745W1W98W10228407145
- BardouPMarietteJEscudiéFDjemielCKloppCjvenn: an interactive Venn diagram viewerBMC Bioinformatics20141529325176396
- UhlénMFagerbergLHallströmBMProteomics. Tissue-based map of the human proteomeScience20153476220126041925613900
- GaoJAksoyBADogrusozUIntegrative analysis of complex cancer genomics and clinical profiles using the cBioPortalSci Signal20136269 pl1
- CeramiEGaoJDogrusozUThe cBio cancer genomics portal: an open platform for exploring multidimensional cancer genomics dataCancer Discov20122540140422588877
- ScottSEGrunfeldEAMcgurkMThe idiosyncratic relationship between diagnostic delay and stage of oral squamous cell carcinomaOral Oncol200541439640315792612
- SmithRACokkinidesVEyreHJAmerican Cancer Society guidelines for the early detection of cancer, 2006CA Cancer J Clin200656111492550 quiz
- LangfelderPHorvathSWGCNA: an R package for weighted correlation network analysisBMC Bioinformatics2008955919114008
- ZhouZChengYJiangYTen hub genes associated with progression and prognosis of pancreatic carcinoma identified by co-expression analysisInt J Biol Sci201814212413629483831
- ZhaoQSongWHeDYLiYIdentification of key gene modules and pathways of human breast cancer by co-expression analysisBreast Cancer201825221322329170883
- LiuXHuAXZhaoJLChenFLIdentification of Key Gene Modules in Human Osteosarcoma by Co-Expression Analysis Weighted Gene Co-Expression Network Analysis (WGCNA)J Cell Biochem2017118113953395928398605
- FountzilasEKotoulaVAngouridakisNIdentification and validation of a multigene predictor of recurrence in primary laryngeal cancerPLoS One201388e7042923950933
- ChungCHParkerJSElyKGene expression profiles identify epithelial-to-mesenchymal transition and activation of nuclear factor-kappaB signaling as characteristics of a high-risk head and neck squamous cell carcinomaCancer Res200666168210821816912200
- WuJSShengSRLiangXHTangYLThe role of tumor microenvironment in collective tumor cell invasionFuture Oncol20171311991100228075171
- YangBChenZHuangYHanGLiWIdentification of potential biomarkers and analysis of prognostic values in head and neck squamous cell carcinoma by bioinformatics analysisOnco Targets Ther2017102315232128490889
- TanisTCincinZBGokcen-RohligBThe role of components of the extracellular matrix and inflammation on oral squamous cell carcinoma metastasisArch Oral Biol201459111155116325090271
- WolfKFriedlPMapping proteolytic cancer cell-extracellular matrix interfacesClin Exp Metastasis200926428929818600304
- WuYHChangTHHuangYFHuangHDChouCYCOL11A1 promotes tumor progression and predicts poor clinical outcome in ovarian cancerOncogene201433263432344023934190
- McleanGWCarragherNOAvizienyteEEvansJBruntonVGFrameMCThe role of focal-adhesion kinase in cancer – a new therapeutic opportunityNat Rev Cancer20055750551516069815
- Abu-AliSFotovatiAShirasunaKTyrosine-kinase inhibition results in EGFR clustering at focal adhesions and consequent exocytosis in uPAR down-regulated cells of head and neck cancersMol Cancer200874718519000
- ChangFLeeJTNavolanicPMInvolvement of PI3K/Akt pathway in cell cycle progression, apoptosis, and neoplastic transformation: a target for cancer chemotherapyLeukemia200317359060312646949
- LumermanHFreedmanPKerpelSOral epithelial dysplasia and the development of invasive squamous cell carcinomaOral Surg Oral Med Oral Pathol Oral Radiol Endod19957933213297621010
- UhlirovaMBohmannDJNK- and Fos-regulated Mmp1 expression cooperates with Ras to induce invasive tumors in DrosophilaEmbo J200625225294530417082773
- WangTMaSQiXKnockdown of the differentially expressed gene TNFRSF12A inhibits hepatocellular carcinoma cell proliferation and migration in vitroMol Med Rep20171531172117828138696
- Moquet-TorcyGTolzaCPiechaczykMJariel-EncontreITranscriptional complexity and roles of Fra-1/AP-1 at the uPA/Plau locus in aggressive breast cancerNucleic Acids Res20144217110111102425200076
- HaywardCPLiangMTasneemSThe duplication mutation of Quebec platelet disorder dysregulates PLAU, but not C10orf55, selectively increasing production of normal PLAU transcripts by mega-karyocytes but not granulocytesPLoS One2017123e017399128301587
- KanoMSekiNKikkawaNmiR-145, miR-133a and miR-133b: Tumor-suppressive miRNAs target FSCN1 in esophageal squamous cell carcinomaInt J Cancer2010127122804281421351259
- MaedaOAndoTOhmiyaNAlteration of gene expression and DNA methylation in drug-resistant gastric cancerOncol Rep20143141883189024504010
- ZhangXWangJDingXAltered expression of podoplanin in keratocystic odontogenic tumours following decompressionOncol Lett20147362763024527067
- HuNQianLHuYQuantitative real-time RT-PCR validation of differential mRNA expression of SPARC, FADD, Fascin, COL7A1, CK4, TGM3, ECM1, PPL and EVPL in esophageal squamous cell carcinomaBMC Cancer20066133
- IwayaTMaesawaCKimuraTInfrequent mutation of the human envoplakin gene is closely linked to the tylosis oesophageal cancer locus in sporadic oesophageal squamous cell carcinomasOncol Rep200513470370715756445