
Abstract
Introduction
This study aimed to explore the effect of activated T cells on breast cancer (BC) cells and provide a theoretical basis for the interaction mechanism studies between BC and immune cells.
Methods
The microarray dataset GSE73527 was downloaded from the Gene Expression Omnibus database. The common differentially expressed mRNAs (co-DEMs) and the common differentially expressed long non-coding RNAs (co-DElncRNAs) were identified between MDA-MB-231 cells and MCF7 activated human T cells, respectively. The RNA–miRNA–lncRNA (ceRNA) network was constructed. Furthermore, the Kyoto encyclopedia of genes and genomes pathway and the gene ontology function analyses were performed on co-DEMs. The protein–protein interaction networks and modules were investigated.
Results
A total of 639 co-DEMs (such as interleukin-6 [IL6] and signal transducer and activator of transcription 1 [STAT1]) were detected in this study. Defense response to other organisms and herpes simplex infection were the most outstanding function and pathway assembled with co-DEMs, respectively. One protein–protein interaction network and three modules were further constructed. A total of 88 mRNA–miRNA–lncRNA relationships such as BTN3A1-has-mir-20-b-5p-HCP5 were explored in the ceRNA network.
Conclusion
Activated T cells may play a crucial role in the defense response to other organism functions and herpes simplex infection pathways by upregulating IL6 and STAT1, which further affected the progression of BC. The BTN3A1-has-miR-20b-5p-HCP5 relationship may be the potential interaction mechanism between BC and immune cells.
Introduction
Breast cancer (BC) is the most frequently diagnosed cancer in women worldwide, accounting for 25% of all cancer casesCitation1 with 1.68 million new cases and 522,000 deaths in a year.Citation2 BC is typically treated by surgery, which may be followed by chemotherapy, radiation therapy, or other immune-modulating treatments.Citation3 Although increasingly aggressive treatments are employed in clinical applications, the survival rates of BC in developing countries remain poor.Citation1,Citation4
Malignant human tumors are often accompanied by infiltration of immune cells into the region of tumor cell proliferation.Citation5 Activated CD8+ T cells have been shown to play a critical role in the killing of tumor cells, and elevated T-cell activation scores are positively correlated with longer patient survival in BC.Citation6 Additionally, a previous study demonstrated a relationship between tumor-infiltrating lymphocytes (TILs) and BC.Citation7 TILs, which include T cells and B cells, are part of the larger category of “tumor-infiltrating immune cells” that are present in variable proportions.Citation8 A previous study showed that TILs are good prognostic indicators in highly proliferative breast tumors.Citation9 The results of large cohorts indicated an association between the TILs in early stage of BC and high response rates to neoadjuvant chemotherapy.Citation10 TILs are involved in the process of BC via gene expression or pathway regulation.Citation11 Numerous studies have revealed the molecular pathways such as PI3K-Akt-mTOR governing the migration of T lymphocytes into tumor tissue.Citation12,Citation13 In a previous study, Noonepalle et al compared the immunophenotype by mRNA sequencing between MDA-MB-231 cells and MCF7-activated human T cells.Citation14 Their results showed that indoleamine 2,3-dioxygenase 1 (IDO1) methylation regulated anti-immune responses in BC subtypes and can be used as a predictive biomarker for immunotherapy. However, genetic evaluation of TILs in a BC specimen is currently not routine because the genetic relevance remains unclear.
Based on the microarray data provided by Noonepalle et al,Citation14 we performed bioinformatics analysis to identify the common differentially expressed mRNAs (co-DEMs) and common differentially expressed long non-coding RNA (co-DElncRNA) between MDA-MB-231 cells and MCF7-activated human T cells, respectively. Functional and pathway enrichment analysis was performed based on these co-DEMs. Next, the protein–protein interaction (PPI) network and modules were investigated. Furthermore, lncRNAs are reported to act as ceRNAs that regulate the expression of miRNA-targeted genes by sponging miRNAs.Citation15 LncRNAs have also been identified as promising prognostic and metastatic markers in BC.Citation16,Citation17 Thus, an mRNA–miRNA–lncRNA interaction network was constructed. We explored the effect of activated T cells on the expression of BC cell lines and provide a theoretical basis for studying the interaction mechanism between BC and immune cells.
Materials and methods
Data resource and preprocessing
Gene expression profile data in the dataset GSE73527Citation14 were downloaded from the Gene Expression Omnibus database (http://www.ncbi.nlm.nih.gov/geo/). This dataset was produced on the GPL11154 Illumina HiSeq 2000 platform (Homo sapiens). A total of 12 cell samples including 3 MCF7 cell samples (MCF7-control samples), 3 MCF7 samples co-cultured with normal peripheral blood mononuclear cells activated with anti-CD3/CD28 antibodies (MCF-case samples), 3 MDA-MB-231 cell samples (MDA-MB-231-control samples), and 3 MDA-MB-231 samples co-cultured with normal peripheral blood mononuclear cells activated with anti-CD3/CD28 antibodies (MDA-MB-231-case samples) were examined in this profile.
Principal component analysis (PCA) is a statistical procedure that uses an orthogonal transformation to convert a set of observations of possibly correlated variables into a set of values of linearly uncorrelated variables known as principal components (or sometimes, principal modes of variation).Citation18 PCA is widely used in data processing and dimensionality reduction.Citation19 After downloading the standardized data of GSE73527, pattern recognition of data and samples distribution observation were performed by PCA. Next, combined with the protein coding gene annotation information (V25) provided by the Gencode database (https://www.gencodegenes.org/),Citation20 the mRNA expression matrix and the lncRNA expression matrix for subsequent analysis were extracted, and our analysis was mainly based on mRNA expression.
Investigation of DEMs
According to different cell types and processing methods, the samples were grouped and analyzed as follows: MCF7-case vs MCF7-control (MCF7 group) and MDA-MB-231-case vs MDA-MB-231-control (MDA-MB-231 group). The P-value of DEMs in each group was calculated using the empirical Bayes linear model in Linear Models for Microarray Data (limma, http://www.bioconductor.org/packages/release/bioc/html/limma.html) packageCitation21 of R (version: 3.32.5) software. The adjusted P-values (adjust.P.value) of DEMs were obtained by multiple checking and correction based on the Benjamini and Hochberg method.Citation22 An adjust.P.value <0.05 and a |log fold change (FC) >1 were selected as the thresholds for identifying DEMs.
The intersection results for all DEMs (co-DEMs) in both the MCF7 and MDA-MB-231 groups were visualized using a Venn diagram. The expression values of DEMs were visualized using a heat map with pheatmap softwareCitation23 (clustering distance: Pearson’s correlation, clustering methods: linkage clustering) in R package (version: 1.0.8, https://cran.r-project.org/web/packages/pheatmap).
Gene ontology (GO) and Kyoto Encyclopedia of Genes and Genomes (KEGG) pathway enrichment analysis
GO analysis is commonly used for functional studies of large-scale genomic or transcriptomic data.Citation24 The KEGG pathway databaseCitation25 contains information regarding how molecules or genes are networked. In this study, the clusterProfiler softwareCitation26 (version: 3.4.4, https://bioconductor.org/packages/release/bioc/html/clusterProfiler.html) in R package was used to identify over-represented GO categories in biological process and significant KEGG pathways. Next, the Benjamini and Hochberg methodCitation27 corrected adjust.P.value <0.05 was selected as the threshold for identification.
PPI network and modules construction
The Search Tool for the Retrieval of Interacting Genes/Proteins (STRING, version: 10.0, http://www.string-db.org/)Citation28 was used to predict PPIs in this study. Based on the information in the STRING database, the PPI network was constructed from up- and downregulated proteins, and then visualized using Cytoscape (version: 3.4.0) software.Citation29 The network topological index (degree) is defined as the number of links incident upon a node.Citation30 The degree was calculated using CytoNCA software (version 2.1.6, http://apps.cytoscape.org/apps/cytonca).Citation31 The key node (hub protein) was determined by the degree score: a higher score indicated a more important location. in the network
A previous study demonstrated that a gene from the same module in a PPI network plays a regulatory role in biological function.Citation32 The MCODE packageCitation33 (version 1.4.2, http://apps.cytoscape.org/apps/MCODE) plugin in Cytoscape software (degree cutoff=2, node score cutoff=0.2, K-core=2, Max. Depth=100) was used to analyze modules in this study. Additionally, KEGG pathway enrichment analysis was carried out on outstanding modules. An adjust.P.value <0.05 was selected as the threshold for identification.
Investigation of differentially expressed lncRNAs
According to the method for screening DEMs between groups, the differentially expressed lncRNAs (DElncRNA) were also explored as the adjust.P.value <0.05 and |log FC| >1. Next, the intersection results for all DElncRNAs in both the MCF7 and MDA-MB-231 groups were visualized using a Venn diagram. The expression values of DElncRNAs were visualized as a heat map using pheatmap software (clustering distance: Pearson’s correlation, clustering methods: linkage clustering) in R package.
miRNA associated lncRNA exploration
The miRNA prediction of co-DEMs was performed using miRWalk 2.0 software (http://zmf.umm.uni-heidelberg.de/apps/zmf/mirwalk2/).Citation34,Citation35 Based on the predicted and experimentally confirmed miRNA–gene regulatory relationship in the miRWalk database, the miRNA–co-DEM interactions were further explored.
The starBase v2.0 database provides the most comprehensive CLIP-Seq experimentally supported miRNA–lncRNA interaction networks.Citation36 In this study, the union set of miRNA–lncRNA interactions in both the starBase (version: 2.0) database and InCeDBCitation37 (http://gyanxet-beta.com/lncedb/) database were used as the background for investigating miRNA regulatory factors of co-DElncRNAs.
Based on the miRNA–mRNA interactions, lncRNAs–miRNA interactions, and positive co-expression relationship between mRNA and lncRNAs (correlation coefficient >0.9 and P<0.05), the mRNA–miRNA–lncRNA network (ceRNA) was further explored. Finally, network topology analysis was carried out to identify the key elements in the network.
Results
Differentially expressed analyses
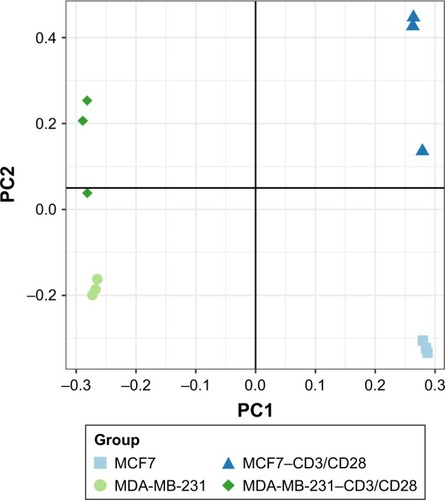
PCA analysis was performed on the downloaded data (). The results showed that samples from the same group were clustered together, particularly for the MCF7-control samples and the MDA-MB-231-control samples.
Figure 1 Principal component analysis of samples in different groups.
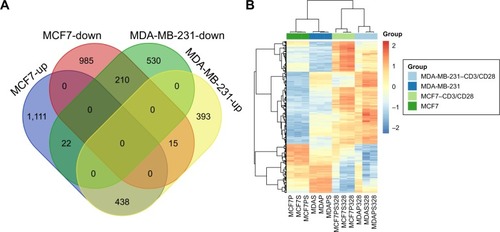
After annotation, 18,984 mRNAs were obtained from the expression matrix. A total of 2,781 DEMs (1,571 upregulated and 1,210 downregulated) were obtained between MCF7-case samples and MCF7-control samples in the MCF7 group. A total of 846 upregulated and 762 downregulated DEMs were detected between MDA-MB-231-case samples and MDA-MB-231-control samples in the MDA-MB-231 group. Furthermore, 438 upregulated co-DEMs (including IDO1) and 201 downregulated co-DEMs in the intersection of two groups were identified (). The clustering heat map for these co-DEMs is shown in , indicating that co-DEMs could distinguish samples from different groups.
Figure 2 Venn diagram and heat map of co-DEMs between groups.
Abbreviation: coDEM, common differentially expressed mRNA.
GO function and KEGG pathway enrichment analysis
GO categories in biological process functions enriched by co-DEMs are shown in . The results showed that these co-DEMs were mainly related to functions such as the defense response to other organisms (GO: 0098542, P: 3.68E-25, count: 72, gene: interleukin 6 [IL6], STAT1, 2′–5′-oligoadenylate synthetase 1 [OAS1], interferon regulatory factor 7 [IRF7], 2′–5′-oligoadenylate synthetase 2 [OAS2], etc), response to virus (GO: 0009615, P: 1.88E-28, count: 54, gene: interferon gamma inducible protein 16 [IFI16], OAS1, interferon regulatory factor 7 [IRF7], beta-2 microglobulin [B2M], interleukin 10 receptor subunit beta [IL10RB], etc), and response to interferon-gamma (GO: 0034341, P: 7.24E-46, count: 60, gene: nitric oxide synthase 2 [NOS2], major histocompatibility complex, class II, DR alpha [HLA-DRA], class II major histocompatibility complex transactivator [CIITA], OAS1, IRF7, etc).
Figure 3 GO function and KEGG pathway enrichment analyses of co-DEMs.
Abbreviations: co-DEM, common differentially expressed mRNA; GO, gene ontology; KEGG, Kyoto encyclopedia of genes and genomes.
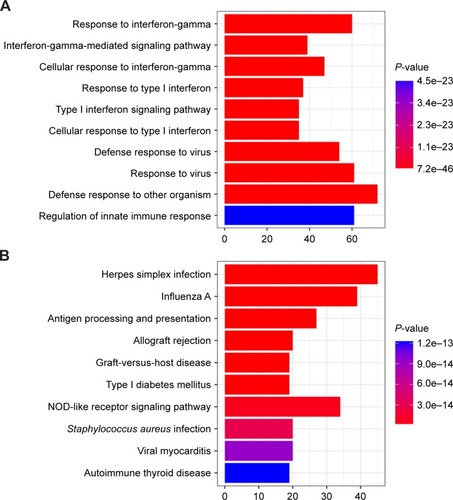
KEGG pathway enrichment analysis showed that the co-DEMs were mainly enriched in herpes simplex infection (hsa05168, P: 5.72E-23, gene: C3, OAS1, IRF7, STAT1, IL6, etc), influenza A (hsa05164, P: 1.00E-18, gene: OAS, IRF7, janus kinase 2 [JAK2], caspase 1 [CASP1], suppressor of cytokine signaling 3 [SOCS3], etc), and NOD-like receptor signaling pathway (hsa04621, P: 6.30E-15, gene: MEFV, pyrin innate immunity regulator [MEFV], guanylate binding protein 7 [GBP7], IFI16, OAS1, IRF7, etc), as shown in .
PPI network analysis
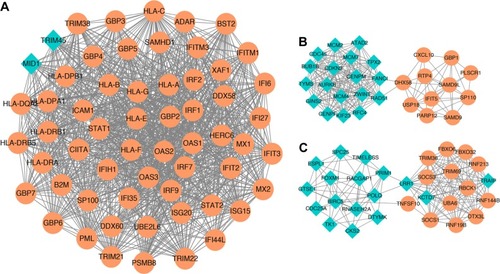
To obtain more useful information from the co-DEMs mentioned above, a PPI network was constructed based on the relationships among protein interactions. The results revealed 499 nodes (348 upregulated and 151 downregulated proteins) and 4,769 interactions in the current PPI network. Among these nodes, IL6, STAT1, IRF7, OAS1, and OAS2 were the top five nodes according to the degree score and were considered as hub proteins in the network ().
Figure 4 Top three modules extracted from protein–protein interaction network.
Modules and related pathway analysis
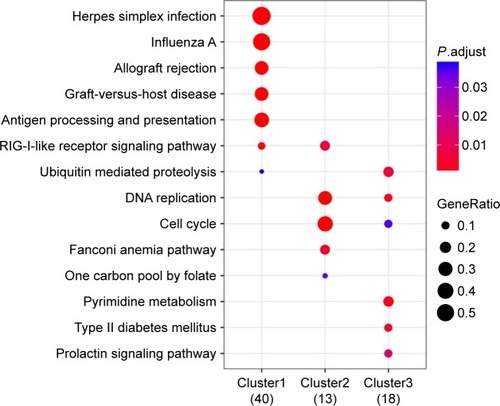
Three modules with the highest scores were selected for further investigation. The results showed that there were 57 upregulated proteins and 2 downregulated proteins in module A (); these proteins were mainly enriched in pathways such as herpes simplex infection and influenza A (). There were 11 upregulated proteins and 18 downregulated proteins in module B (); these proteins were mainly enriched in pathways such as cell. cycle and DNA replication (). Furthermore, a total of 13 upregulated proteins and 17 downregulated proteins were found in module C (); these proteins were mainly enriched in pathways such as pyrimidine metabolism and DNA replication.
Figure 5 Results of KEGG pathway enrichment analyses for proteins in three modules.
Abbreviation: KEGG, Kyoto encyclopedia of genes and genomes.
LncRNA investigation
After annotation, 11,023 lncRNAs were obtained. Differential expression analysis revealed 134 DElncRNAs (103 upregulated and 31 downregulated) between MCF7-case samples and MCF7-control samples in the MCF7 group. There were 69 DElncRNAs (30 upregulated and 39 downregulated) between MDA-MB-231-case samples and MDA-MB-231-control samples in the MDA-MB-231 group. A total of nine upregulated co-DElncRNAs and three downregulated co-DElncRNAs between the two groups were further obtained from these DElncRNAs.
CeRNA regulatory network analysis
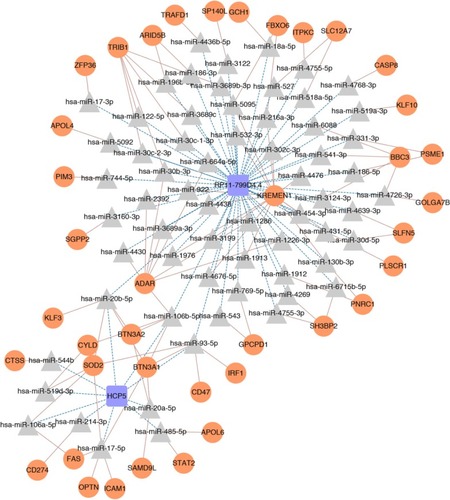
A total of 88 mRNA–miRNA–lncRNA regulation relationships including BTN3A1-has-mir-20b-5p-HCP5 and BTN3A1-has-mir-17–5 p-HCP5 were explored in ceRNA regulatory network analysis (). Among these relationships, there were 2 upregulated lncRNAs (RP11-799D4.4 and HLA Complex P5 [HCP5]), 39 upregulated mRNAs (such as Kringle Containing Transmembrane Protein 1 [KREMEN1] and CD47 Molecule [CD47]), and 64 miRNAs (such as hsa-mir-20b-5p and hsa-mir-17–5 p) in the ceRNA network. The results of network topological analysis showed that the most outstanding miRNAs regulating mRNA–lncRNA relationships were hsa-mir-20b-5p, hsa-mir-17–5 p, hsa-mir-93–5 p, and hsa-mir-106b-5p.
Figure 6 Competing endogenous RNA regulatory network in the present study.
Abbreviation: co-DElncRNA, common differentially expressed long non-coding RNA.
Discussion
BC is the most common invasive cancer in women worldwide. Although TILs are related to BC progression, the detailed molecular mechanism of TILs in BC remains unclear. Consistent with the findings by Noonepalle et al,Citation14 our bioinformatics analysis also showed that IDO1 was co-upregulated between MDA-MB-231 cells and MCF7 cells-activated human T cells. Moreover, key co-DEMs including IL6 and STAT1 were detected in this study. GO function and KEGG pathway analysis showed that the defense response to other organisms and herpes simplex infection were the most outstanding functions and pathway assembled with co-DEMs, respectively. Furthermore, 88 mRNA–miRNA–lncRNA relationships including BTN3A1-has-mir-20b-5p-HCP5 and BTN3A1-has-mir-17–5 p-HCP5 were found in the ceRNA network.
A recent study found that infiltration of tissue by immune cells contributes to BC development.Citation38 The extent of T-cell infiltration into invasive BC has been reported to range from 1% to 45% of the total cellular mass.Citation39 In rapidly proliferating tumors, the presence of T lymphocytes at tumor sites is a good prognostic indicator compared to non-immunogenic tumors.Citation39 However, the exact composition of T lymphocyte infiltration varies greatly and may profoundly affect disease progression and overall patient survival.Citation40 Furthermore, certain leukocytes, such as cytotoxic T lymphocytes, play a vital function in constraining tumor development.Citation41 This is supported by epidemiologic data showing an increased incidence of viral-associated cancers.Citation42 In the present study, co-DEMs between T-cell-activated samples and control samples were mainly enriched in immune response functions such as the defense response to other organisms and pathways such as herpes simplex infection. This result indicates that activated T cells affect BC cell lines via the defense response to other organism function and herpes simplex infection pathway. Interestingly, IL6 and SATA1 were two DEMs that were both outstanding in the defense response to other organism function and herpes simplex infection pathway. IL6 is secreted by T cells to stimulate immune responses during infection or other tissue damage, leading to inflammation.Citation43 Kim et al found that normal mammary epithelial cells from healthy women release IL-6, but the expression of IL-6 was abolished in ductal infiltrating carcinomas.Citation44 However, Garcia-Tuñón et al suggested that high expression of IL-6 and its receptors in breast tumors is related to enhanced cell proliferation in BC.Citation45 IL-6 appears to have a dual function in the biology of in vitro BC cells. STAT1 is a member of the STAT family and plays an important role in orchestrating immune reactions.Citation46 The antitumor function of STAT1 through its capacity to control the immune system and promote tumor immune surveillance has been widely examined.Citation47 A previous study shows that interferon-γ restores BC sensitivity to the drug fulvestrant by regulating STAT1 and signaling to caspase-dependent apoptosis.Citation48 In an animal study, Siebler et al showed that STAT1-deficient and T-bet-deficient mice were protected from T-cell-dependent liver injury, suggesting a close relationship between STAT1 and T-cell activation in disease.Citation49 Thus, based on our results, we speculate that the activated T cells may play an important role in the defense response to other organism function and herpes simplex infection pathway by upregulating IL6 and STAT1, which further affect BC progression.
The expression of lncRNAs has recently been reported in tumorigenesis and plays a pivotal role in regulating the malignant behavior of cancers.Citation50 HCP5 is a human endogenous retrovirus, but has now become an integral part of the human genome.Citation51 Liang et al suggested that HCP5 could induce follicular thyroid carcinoma progression via an miRNA sponge.Citation52 Furthermore, Venkatadri et al showed that modulating miRNAs with mimics or inhibitors validated the key roles of miR-542-3 p in MCF-7 and miR-122-5 p in MDA-MB-231 BC cell death.Citation53 As an miRNA, miR-20b may underlie the metastatic heterogeneity of BC.Citation54 Moreover, some genes such as early growth response-1 play an important role in miR-20b regulation during BC progression.Citation55 Butyrophilin subfamily three member A1 (BTN3A1), a member of the butyrophilin gene family, plays a role in T-cell activation, activated T-cell proliferation, and immune response adaption.Citation56 It is widely known that in the ceRNA network of BC, mRNAs can communicate with each other by competing for a limited pool of miRNAs.Citation57 A previous study showed that the 3′ untranslated region of the pseudogene CYP4Z2P promotes tumor angiogenesis in BC by acting as a ceRNA.Citation58 In the present study, has-miR-20b-5p-BTN3A1-HCP5 showed an outstanding miRNA–mRNA–lncRNA regulation relationship in ceRNA regulation network. Thus, the has-miR-20b-5p-BTN3A1-HCP5 relationship may be involved in the interaction mechanism between BC and immune cells.
There were some limitations to this study. First, the sample size was small. Second, there was a lack of experimental verification because human or mouse tumor samples with activated T cells were difficult to obtain. Verification experiments with a large sample size are needed to confirm our results.
Conclusion
Activated T cells may play an important role in the defense response to other organism function and herpes simplex infection pathway by upregulating IL6 and STAT1, which further affect the progression of BC. Furthermore, the has-miR-20b-5p-BTN3A1-HCP5 relationship may be involved in the interaction mechanism between BC and immune cells.
Acknowledgments
This study was supported by the National Natural Science Foundation of China (No 11572200, No 81773043, No 31501127, No 11502146) and Shanghai Key Laboratory of Biliary Tract Disease Research Foundation (No 17DZ2260200).
Disclosure
The authors report no conflicts of interest in this work.
References
- StewartBWildCWorld Cancer Report 2014International Agency for Research on Cancer2014
- TaoZShiALuCSongTZhangZZhaoJBreast cancer: epidemiology and etiologyCell Biochem Biophys201572233333825543329
- SainiKSTaylorCRamirezAJRole of the multidisciplinary team in breast cancer management: results from a large international survey involving 39 countriesAnn Oncol201223485321821551
- MungrueKRamdathJAliSChallenges to the control of breast cancer in a small developing countryBreast Cancer (Auckl)2014887 BCBCR.S1278024526837
- WhitesideTLImmune suppression in cancer: effects on immune cells, mechanisms and future therapeutic interventionSemin Cancer Biol2006161316153857
- LuLBaiYWangZElevated T cell activation score is associated with improved survival of breast cancerBreast Cancer Res Treat2017164368969628488141
- DisisMLImmune regulation of cancerJ Clin Oncol20102829453120516428
- GentlesAJNewmanAMLiuCLThe prognostic landscape of genes and infiltrating immune cells across human cancersNat Med201521893826193342
- AaltomaaSLipponenPEskelinenMLymphocyte infiltrates as a prognostic variable in female breast cancerEur J Cancer199228A4–58598641524909
- LoiSSirtaineNPietteFPrognostic and predictive value of tumor-infiltrating lymphocytes in a Phase III randomized adjuvant breast cancer trial in node-positive breast cancer comparing the addition of docetaxel to doxorubicin with doxorubicin-based chemotherapy: BIG 02-98J Clin Oncol201331786086723341518
- CalabròABeissbarthTKunerREffects of infiltrating lymphocytes and estrogen receptor on gene expression and prognosis in breast cancerBreast Cancer Res Treat20091161697718592372
- ZhangXHuangTWuYInhibition of the PI3K-Akt-mTOR signaling pathway in T lymphocytes in patients with active tuberculosisInt J Infect Dis201759C11011728416440
- SzamelMReschKT-cell antigen receptor-induced signal-transduction pathways-activation and function of protein kinases c in T lymphocytesEur J Biochem2016215379
- NoonepalleSKGuFLeeEJPromoter methylation modulates indoleamine 2,3-dioxygenase 1 induction by activated T cells in human breast cancersCancer Immunol Res20175433028264810
- KallenANZhouXBXuJThe imprinted H19 lncRNA antagonizes let-7 microRNAsMol Cell201352110111224055342
- GuptaRAShahNWangKCLong non-coding RNA HOTAIR reprograms chromatin state to promote cancer metastasisNature201046472911071107620393566
- LuLZhuGZhangCAssociation of large noncoding RNA HOTAIR expression and its downstream intergenic CpG island methylation with survival in breast cancerBreast Cancer Res Treat2012136387588323124417
- RenVMaYSastrySSGeneralized Principal Component AnalysisSpringer Publishing Company, Incorporated2016
- AlizadehELyonsSMCastleJMPrasadAMeasuring systematic changes in invasive cancer cell shape using Zernike momentsIntegr Biol (Camb)20168111183119327735002
- HarrowJFrankishAGonzalezJMGENCODE: the reference human genome annotation for The ENCODE ProjectGenome Res20122291760177422955987
- SmythGKLimma: linear models for microarray dataBioinformatics and Computational Biology Solutions Using R and BioconductorSpringerNew York, NY2005397420
- BenjaminiYHochbergYControlling the false discovery rate: a practical and powerful approach to multiple testingJ R Stat Soc1995571289300
- KoldeRPheatmap: pretty heatmaps2015 Available from: https://cran.r-project.org/web/packages/pheatmap/index.htmlAccessed July 30, 2018
- AshburnerMBallCABlakeJAGene ontology: tool for the unification of biology. The Gene Ontology ConsortiumNat Genet2000251252910802651
- KanehisaMGotoSKEGG: Kyoto encyclopedia of genes and genomesNucleic Acids Res2000281273010592173
- YuGWangLGHanYHeQYQyHclusterProfiler: an R package for comparing biological themes among gene clustersOMICS201216528428722455463
- BenjaminiYHochbergYControlling the false discovery rate: a practical and powerful approach to multiple testingJ R Stat Soc Series B Stat Methodol1995289300
- SzklarczykDFranceschiniAWyderSSTRING v10: protein–protein interaction networks, integrated over the tree of lifeNucleic Acids Res201543Database issueD447D45225352553
- ShannonPMarkielAOzierOCytoscape: a software environment for integrated models of biomolecular interaction networksGenome Res200313112498250414597658
- SharmaDSuroliaACentralityDDubitzkyWWolkenhauerOChoK-HYokotaHEncyclopedia of Systems BiologyNew York, NYSpringer New York2013558558
- Yu TangMLWangJPanYWuF-XCytonca: a cytoscape plugin for centrality analysis and evaluation of biological networksBioSystems201411005
- WangJRenJLiMWuFXFxWIdentification of hierarchical and overlapping functional modules in PPI networksIEEE Trans Nanobioscience201211438622955967
- BaderGDHogueCWAn automated method for finding molecular complexes in large protein interaction networksBMC Bioinformatics20034212525261
- BreuerKForoushaniAKLairdMRInnateDB: systems biology of innate immunity and beyond – recent updates and continuing curationNucleic Acids Res201341Database issueD1228D123323180781
- DweepHGretzNmiRWalk2.0: a comprehensive atlas of microRNA-target interactionsNat Methods201512869769726226356
- LiJHLiuSZhouHQuLHYangJHstarBase v2.0: decoding miRNA–ceRNA, miRNA–ncRNA and protein–RNA interaction networks from large-scale CLIP-Seq dataNucleic Acids Res201442Database issueD92D9724297251
- dasSGhosalSSenRChakrabartiJlnCeDB: database of human long noncoding RNA acting as competing endogenous RNAPLoS One201496e9896524926662
- StevenASeligerBThe role of immune escape and immune cell infiltration in breast cancerBreast Care (Basel)2018
- ChinYJanseensJVandepitteJPhenotypic analysis of tumor-infiltrating lymphocytes from human breast cancerAnticancer Res1992125146314661332579
- LiZDongPRenMPD-L1 expression is associated with tumor FOXP3(+) regulatory T-cell infiltration of breast cancer and poor prognosis of patientJ Cancer20167778479327162536
- DunnGPOldLJSchreiberRDThe immunobiology of cancer immunosurveillance and immunoeditingImmunity200421213714815308095
- SavilleMWSmithCLillySMannKPAIDS-related malignanciesCancer Chemother Biol Response Modif19971744089551223
- ZhouYQLiuZLiuZHInterleukin-6: an emerging regulator of pathological painJ Neuroinflammation201613114127267059
- KimHJKrennVSteinhauserGBerekCPlasma cell development in synovial germinal centers in patients with rheumatoid and reactive arthritisJ Immunol199916253053306210072558
- Garcia-TuñónIRicoteMRuizAIL-6, its receptors and its relationship with bcl-2 and bax proteins in infiltrating and in situ human breast carcinomaHistopathology2005471828915982327
- HjKKimYJSignal transducer and activator of transcription proteins: regulators of myeloid-derived suppressor cell-mediated immunosuppression in cancerArch Pharm Res2016391111226242901
- KoromilasAESexlVThe tumor suppressor function of STAT1 in breast cancerJAKSTAT201322e2335324058806
- NingYRigginsRBMullaJEIFNgamma restores breast cancer sensitivity to fulvestrant by regulating STAT1, IFN regulatory factor 1, NF-kappaB, BCL2 family members, and signaling to caspase-dependent apoptosisMol Cancer Ther2010951274128520457620
- SieblerJWirtzSKleinSA key pathogenic role for the STAT1/T-bet signaling pathway in T-cell-mediated liver inflammationHepatology2003386157314647068
- TengHWangPXueYRole of HCP5-miR-139-RUNX1 feedback loop in regulating malignant behavior of glioma cellsMol Ther201624101806182227434586
- VastagBAIDS abated: genome scans illuminate immune control of HIVScience News201017233535
- LiangLXuJWangMLncRNA HCP5 promotes follicular thyroid carcinoma progression via miRNAs spongeCell Death Dis20189337229515098
- VenkatadriRMuniTIyerAKYakisichJSAzadNRole of apoptosis-related miRNAs in resveratrol-induced breast cancer cell deathCell Death Dis201672e210426890143
- LiJYZhangYZhangWHDifferential distribution of miR-20a and miR-20b may underly metastatic heterogeneity of breast cancersAsian Pac J Cancer Prev20121351901190622901144
- LiDIlnytskyyYKovalchukACrucial role for early growth response-1 in the transcriptional regulation of miR-20b in breast cancerOncotarget2013491373138723945289
- Btn1a1Butyrophilin subfamily 1 member a1 Available from: http://www.informatics.jax.org/marker/MGI:103118Accessed July 30, 2018
- ZhouXLiuJWangWConstruction and investigation of breast-cancer-specific ceRNA network based on the mRNA and miRNA expression dataIET Syst Biol2014839610325014376
- ZhengLLiXGuYLvXXiTThe 3′UTR of the pseudogene CYP4Z2P promotes tumor angiogenesis in breast cancer by acting as a ceRNA for CYP4Z1Breast Cancer Res Treat2015150110511825701119