
Abstract
Background
Hepatocellular carcinoma (HCC) is an extremely common malignant tumor with worldwide prevalence. The aim of this study was to identify potential prognostic genes and construct a competing endogenous RNA (ceRNA) regulatory network to explore the mechanisms underlying the development of HCC.
Methods
Integrated analysis was used to identify potential prognostic genes in HCC with R software based on the GSE14520, GSE17548, GSE19665, GSE29721, GSE60502, and the Cancer Genome Atlas databases. Gene Ontology and Kyoto Encyclopedia of Genes and Genomes pathway-enrichment analyses were performed to explore the molecular mechanisms of potential prognostic genes. Differentially expressed miRNAs (DEMs) and lncRNAs (DELs) were screened based on the Cancer Genome Atlas database. An lncRNA–miRNA–mRNA ceRNA regulatory network was constructed based on information about interactions derived from the miRcode, TargetScan, miRTarBase, and miRDB databases.
Results
A total of 152 potential prognostic genes were screened that were differentially expressed in HCC tissue and significantly associated with overall survival of HCC patients. There were 13 key potential prognostic genes in the ceRNA regulatory network: eleven upregulated genes (CCNB1, CEP55, CHEK1, EZH2, KPNA2, LRRC1, PBK, RRM2, SLC7A11, SUCO, and ZWINT) and two downregulated genes (ACSL1 and CDC37L1) whose expression might be regulated by eight DEMs and 61 DELs. Kaplan–Meier curve analysis showed that nine DELs (AL163952.1, AL359878.1, AP002478.1, C2orf48, C10orf91, CLLU1, CLRN1-AS1, ERVMER61-1, and WARS2-IT1) in the ceRNA regulatory network were significantly associated with HCC-patient prognoses.
Conclusion
This study identified potential prognostic genes and constructed an lncRNA– miRNA–mRNA ceRNA regulatory network of HCC, which not only has important clinical significance for early diagnoses but also provides effective targets for HCC treatments and could provide new insights for HCC-interventional strategies.
Introduction
Hepatocellular carcinoma (HCC) is one of the most common malignant tumors worldwide.Citation1 However, the early onset of HCC is difficult to identify, and tumors are often found in the later stages of the disease.Citation2,Citation3 Many studies have demonstrated that the occurrence of HCC is closely related to the dysregulation of multiple genes and key signaling pathways.Citation4,Citation5 Therefore, it is important to study the molecular mechanisms of HCC carcinogens to help us explore more effective tumor markers for early detection and key therapeutic targets of HCC.
MicroRNAs are predicted to control the activity of about 50% of all protein-coding genes, and deregulated miRNA expression has been implicated in a variety of cancers.Citation6,Citation7 Accumulating evidence suggests that lncRNAs play important roles in the regulation of cell proliferation, invasion, and angiogenesis through interactions with miRNAs and mRNAs.Citation8–Citation10 The competing endogenous RNA (ceRNA) hypothesis was proposed, which revealed how mRNAs and lncRNAs “talk” to each other using miRNA response elements as letters of a new language, and how ceRNA activity forms a large-scale regulatory network across the transcriptome.Citation11 The interaction between lncRNAs and mRNAs through shared miRNAs represents a novel layer of gene regulation that plays important roles in the physiology and development of cancer.Citation12 However, studies of lncRNA– miRNA–mRNA ceRNA regulatory networks in HCC based on multiple databases have rarely been reported.
In this study, we integrated expression data from multiple databases and screened out potential prognostic genes in HCC by bioinformatic analysis. Then, Gene Ontology (GO) and Kyoto Encyclopedia of Genes and Genomes (KEGG) pathway-enrichment analysis was performed to help us understand the molecular mechanisms underlying the development of HCC. Subsequently, we constructed a ceRNA regulatory network to clarify potential relationships among lncRNAs, miRNAs, and mRNAs. Moreover, expression levels of key potential prognostic genes in the ceRNA regulatory network were validated using quantitative real-time (qRT) PCR analysis. In summary, our study not only identified potential molecular markers for the early diagnosis and prognosis of HCC but also provides new insights into HCC-interventional strategies.
Methods
Gene-expression data
Five gene-expression-profile groups (GSE14520, GSE17548, GSE19665, GSE29721, and GSE60502) were downloaded from the Gene Expression Omnibus (GEO) database (https://www.ncbi.nlm.nih.gov/geo) from a total of 79 HCC-tissue and 77 adjacent normal liver-tissue samples. Information about the five groups of GEO datasets is shown in . Whole-transcriptome sequencing (WTS) data of 374 HCC-tissue and 50 adjacent normal liver-tissue samples and clinical data of 374 HCC patients were downloaded from the Cancer Genome Atlas (TCGA) database (http://cancergenome.nih.gov).
Table 1 Details for GEO data
Screening for differentially expressed genes using integrated bioinformatic analysis
Data of the gene-expression profiles (GSE14520, GSE17548, GSE19665, GSE29721, and GSE60502) were calibrated, standardized, and log2-transformed after being processed using the R software package. Differential expression analysis between HCC and adjacent normal liver tissue was performed using R software with the Limma package. Log2 fold change (FC) >1 and P<0.05 were used as cutoff criteria. Subsequently, lists of differentially expressed genes (DEGs) obtained from the differential expression analysis of the five GEO-microarray data-set groups were integrated using R software with the RRA (robust rank aggregation) package, which is openly available on the comprehensive R network (http://cran.r-project.org) and based on the hypothesis that each gene is randomly ordered in each experiment and that there is a greater likelihood of differential gene expression when a gene is ranked high in all experiments. P<0.05 was used as the cutoff criterion.
RNA-sequencing data downloaded from the TCGA database was organized into gene-expression-matrix files. Protein-coding mRNA- and lncRNA-expression data were separated from the RNA-sequencing data, and the extracted data were used without further transformation. Differential mRNA expression was analyzed in HCC-tissue and adjacent normal liver-tissue samples with the R software with the Limma package. Log2FC >1 and P<0.05 were used as cutoff criteria.
Kaplan–Meier curve analysis
Kaplan–Meier curve analysis was performed on the DEGs in HCC-tissue samples compared with adjacent normal liver tissue to obtain potential prognostic genes that were significantly associated with HCC patient prognoses, based on the downloaded clinical data and the standardized gene-expression-matrix file produced by R with the survival package. P<0.05 was used as the cutoff criterion.
GO and KEGG pathway-enrichment analyses of potential prognostic genes
GO and KEGG pathway-enrichment analysis was performed using the DAVID online tool (http://david.abcc.ncifcrf.gov), which provides a comprehensive set of high-throughput functional gene analyses to help researchers understand biological characteristics to analyze potential prognostic genes at the functional level. P<0.05 was used as the cutoff criterion.
Identification of differentially expressed miRNAs and differentially expressed lncRNAs
To clarify the potential interactions among the differentially expressed lncRNAs (DELs), miRNAs (DEMs), and potential prognostic genes and to construct the lncRNA–miRNA– mRNA regulatory networks. DEM and DEL analysis in HCC tissue and adjacent normal liver tissue from the TCGA data sets was performed using R with Limma. Log2FC >2 and P<0.01 were used as the cutoff criteria.
Construction of competing endogenous RNA regulatory network
DEMs that might affect the function of potential prognostic genes were simultaneously searched using the miRTarBase (http://mirtarbase.mbc.nctu.edu.tw), TargetScan (http://www.targetscan.org) and miRDB (http://www.mirdb.org) online databases. Then, the miRcode (http://www.mircode.org) database was used to screen DELs that might affect the function of DEMs. Potential prognostic genes that did not show target DEMs or DELs were deleted to confirm the reliability of the ceRNA regulatory network. The result was visualized using Cytoscape software.
Human specimens
HCC-tissue and adjacent normal liver-tissue sections were collected from the Department of General Surgery at Beijing Tongren Hospital, Capital Medical University. No patients received chemotherapy, radiotherapy, biological treatments, or other treatments before the surgeries were performed. Written informed consent was obtained from all patients, and was in accordance with the Declaration of Helsinki. The study protocol was approved by the institutional review board of Beijing Tongren Hospital, Capital Medical University.
Quantitative real-time polymerase chain reaction
Total RNA was extracted from tissue using Trizol (Thermo Fisher Scientific, Waltham, MA, USA) and cDNA synthesized using a reverse-transcription kit (Thermo Fisher Scientific). RT-PCR was repeated in triplicate using an RT-PCR instrument (Thermo Fisher Scientific) according to the manufacturer’s instructions. The relative expression of each target gene was calculated using the comparative Ct (2−ΔΔCt) method.
Results
Screening for differentially expressed genes from GEO and TCGA databases
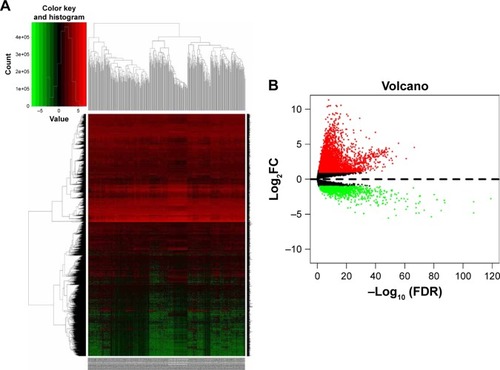
A total of 854, 348, 2,120, 820, and 1,052 DEGs were screened from the GSE14520, GSE17548, GSE19665, GSE29721, and GSE60502 data sets, respectively. The differential expression of multiple genes from the two sets of data included in each of the five microarrays is shown in Figure S1, and cluster heat maps of the top-50 DEGs are shown in Figure S2. A total of 429 DEGs were screened using RRA analysis, including 150 upregulated and 279 downregulated genes. The heat map of the top-20 upregulated and downregulated genes is shown in . Differential expression analyses of protein-coding mRNAs in HCC-tissue and adjacent normal liver-tissue samples from the TCGA data sets were performed using R with Limma package (Log2FC >1 and P<0.05). A total of 4,844 DEGs were identified, including 3,756 upregulated and 1,088 downregulated mRNAs. DEG volcano plots and cluster heat maps are shown in .
Figure 1 Log2FC heat map of the top 20 upregulated and downregulated genes of the five expression-microarray groups downloaded from the GEO data set.
Notes: The differentially expressed gene (DEG) list of each expression microarray from the GEO data was integrated using R software with the RRA package. The abscissa is the GEO ID, and the ordinate is the gene name. Red represents upregulated gene expression, and green represents downregulated gene expression in hepatocellular carcinoma tissues compared with adjacent normal liver tissues. Numbers in the box represent log2FC values that resulted from the integrated analysis.
Abbreviations: FC, fold change; GEO, Gene Expression Omnibus; RRA, robust rank aggregation.
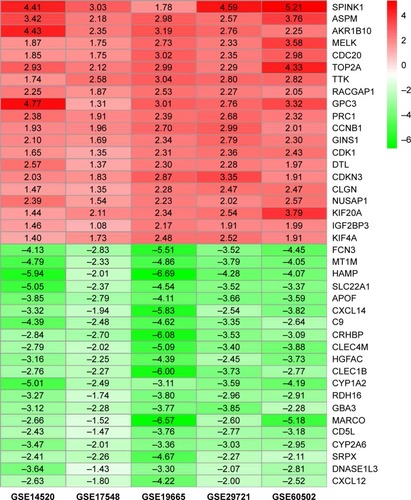
Figure 2 Hierarchical clustering heat map (A) and volcano plot (B) of differentially expressed genes screened based on TCGA HCC WTS data.
Notes: Protein-encoding mRNA-expression data were screened and analyzed using R software and the Limma package. Log2FC >1 and P<0.05 were used as cutoff criteria.
Abbreviations: FC, fold change; TCGA, the Cancer Genome Atlas; HCC, hepatocellular carcinoma; WTS, whole-transcriptome sequencing; FDR, false discovery rate.
Identification of potential prognostic genes
The Venn online tool (http://bioinformatics.psb.ugent.be/webtools/Venn) was used to screen 369 genes, which were differentially expressed in HCC tissue samples compared with adjacent normal liver tissue samples from both the TCGA database and the five GEO database groups. Kaplan–Meier curve analysis was performed on the DEGs from the downloaded clinical data and the standardized gene-expression-matrix files, which were derived from the TCGA data set using R software with the survival package (P<0.05). Finally, a total of 152 potential prognostic genes were screened out, consisting of 86 upregulated genes and 66 downregulated genes, which were differentially expressed in HCC tissue compared with adjacent normal liver tissue and significantly associated with the prognosis of HCC patients, as shown in .
Table 2 Potential prognostic genes in hepatocellular carcinoma
GO and KEGG pathway-enrichment analyses
The DAVID online tool was used to analyze functional and pathway-enrichment to investigate the function of potential prognostic genes. Significant results regarding the GO enrichment analyses of potential prognostic genes are shown in Figure S3. The GO analysis divided potential prognostic genes into three functional groups: molecular function, biological process, and cell composition. In the biological process group, potential prognostic genes were primarily enriched in cell division, mitotic nuclear division, sister-chromatid cohesion, and mitotic spindle organization. In the cell-composition group, potential prognostic genes were mainly enriched in mid-body formations, condensed chromosome kinetochores, and spindle poles. In the molecular function group, potential prognostic genes were mainly enriched in microtubule binding, microtubule-motor activity, and monooxygenase activity. KEGG signaling pathways of potential prognostic genes were mainly enriched in factors associated with the cell cycle, metabolic pathways, retinol metabolism, arachidonic acid metabolism, the p53-signaling pathway, oocyte meiosis, chemical carcinogenesis, drug metabolism, the CYP/CYP450 pathway, complement and coagulation cascades, linoleic acid metabolism, and HTLV1 infection, as shown in and Figure S4.
Table 3 KEGG pathway analysis of potential prognostic genes associated with HCC
Identification of differentially expressed miRNAs and lncRNAs
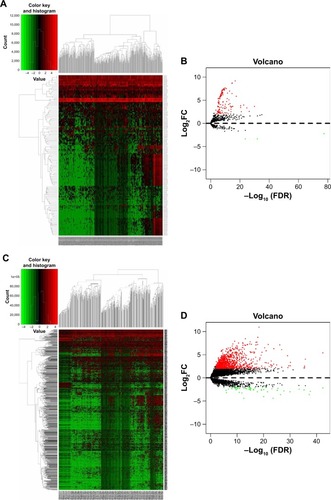
A total of 126 DEMs were identified, including 123 upregulated and three downregulated miRNAs. Additionally, 1,059 DELs were identified, including 1,002 upregulated and 57 downregulated lncRNAs. Heat maps and volcano plots of the DEMs and DELs are shown in .
Figure 3 Hierarchical clustering heat map and volcano plot of screened DEMs (A, B) and DELs (C, D) based on TCGA HCC WTS data.
Notes: miRNA- and lncRNA-expression data were downloaded and analyzed using R software and the Limma package. Log2FC >2 and P<0.01 were used as cutoff criteria.
Abbreviations: DEMs, differentially expressed miRNAs; DELs, differentially expressed lncRNAs; FC, fold change; TCGA, the Cancer Genome Atlas; HCC, hepatocellular carcinoma; WTS, whole-transcriptome sequencing.
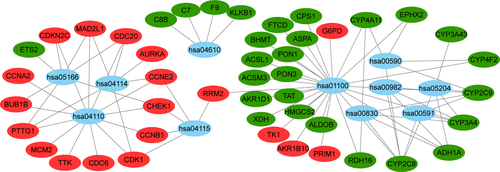
Construction of competing endogenous RNA regulatory network
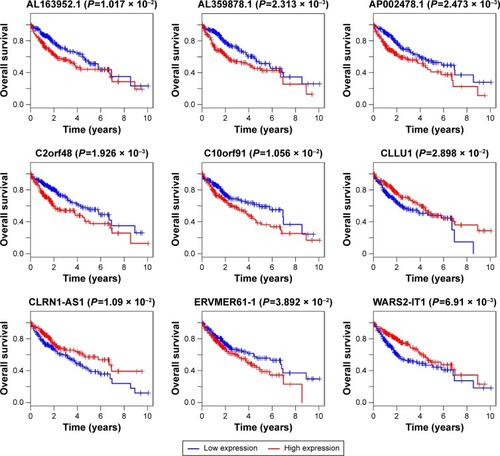
We found a total of 13 key potential prognostic genes whose expression might be affected by the eight DEMs. Meanwhile, the functions of these eight DEMs were predicted to be regulated by 61 DELs. Interactions among DELs, DEMs, and the key potential prognostic genes are listed in . The network of gene nodes and interactions were visualized using the Cytoscape software, as shown in . Kaplan–Meier curve analyses were performed on the miRNAs and lncRNAs in the ceRNA regulatory network based on the HCC-patient clinical data from the TCGA database. Nine key candidate lncRNAs (AL163952.1, AL359878.1, AP002478.1, C2orf48, C10orf91, CLLU1, CLRN1-AS1, ERVMER61-1, and WARS2-IT1) were significantly associated with HCC-patient prognoses, as shown in . However, no DEMs were identified in the ceRNA regulatory network related to the postoperative survival of HCC patients.
Table 4 Interaction between genes in ceRNA regulatory network
Figure 4 The ceRNA regulatory network in HCC.
Notes: The oval represents mRNA, the diamond represents lncRNA, and the square represents miRNA. Red indicates the gene was upregulated and green indicates the gene downregulated in HCC tissues compared with adjacent normal liver tissues. The line between the genes indicates that there could be regulatory relationships between the two genes.
Abbreviations: ceRNA, the competing endogenous RNA; HCC, hepatocellular carcinoma.
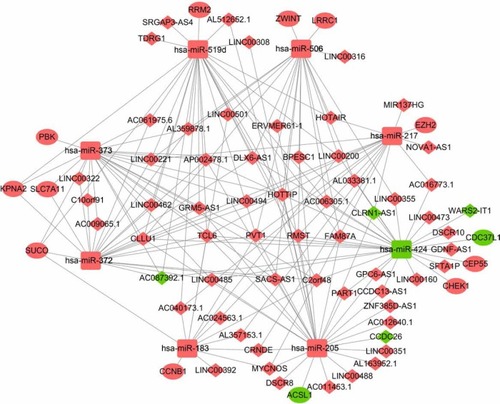
Figure 5 Kaplan–Meier curve analysis was performed on the DELs in the ceRNA regulatory network. P<0.05 was used as the cutoff criterion.
Abbreviations: DELs, differentially expressed lncRNAs; ceRNA, competing endogenous RNA.
Validation of key potential prognostic genes by quantitative real-time polymerase chain reaction
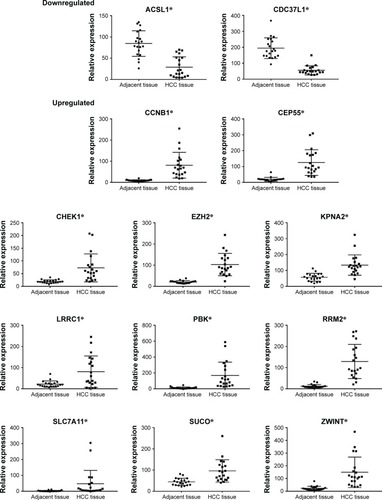
The key potential prognostic genes were subjected to qRT-PCR on 20 pairs of tissue samples. As shown in , expression levels of eleven genes (CCNB1, CEP55, CHEK1, EZH2, KPNA2, LRRC1, PBK, RRM2, SLC7A11, SUCO, and ZWINT) were upregulated and those of two mRNAs (ACSL1, CDC37L1) downregulated in HCC tissue compared with adjacent normal liver tissue. (P<0.05). Dysregulation trends were consistent with the results of our previous bioinformatic analysis.
Figure 6 mRNA-expression levels in the ceRNA regulatory network of the 20 pairs of HCC tissue and adjacent normal liver tissue.
Notes: Experiments were repeated three times. *P<0.05.
Abbreviations: ceRNA, competing endogenous RNA; HCC, hepatocellular carcinoma.
Discussion
HCC is one of the leading causes of death worldwide, and is an overwhelming experience for patients, due to its poor prognosis.Citation13 Therefore, exploring the underlying mechanisms and identifying effective prognostic biomarkers for the early detection of and effective therapy for HCC patients has become an urgent mandate.
Several studies have revealed that some dysregulated genes might act as potential biomarkers in HCC. However, previous studies mainly focused on different gene data without clinical data to predict prognosis in HCC.Citation4,Citation14 Several previous studies containing prognostic analyses were mostly based on a single database.Citation15,Citation16 In the present study, we screened and integrated the DEGs of five groups of gene-expression data from the GEO database, and then validated these DEGs based on gene expression and clinical survival data from the TCGA database, which could determine more reliable and accurate potential prognostic genes in HCC. This finding provided numerous potential biomarkers which may be used in diagnosing HCC and predicting patient prognoses with HCC. Considering that these potential prognostic genes are the implementers of molecular function, GO and KEGG pathway-enrichment analyses were performed to help us understand the molecular mechanisms underlying the development of HCC. Remarkably, our study reveals that the cell cycle was the most affected pathway in HCC, which may guide individualized therapy choices.
Currently, cross talk is thought to occur between lncRNAs, miRNAs, and mRNAs during many aspects of tumorigenesis, and the ceRNA hypothesis has been considered a novel measure of gene regulation at the posttranscriptional level in multiple tumor types.Citation17–Citation19 This study attempted to construct a lncRNA–miRNA–mRNA ceRNA regulatory network during HCC tumorigenesis at the transcriptional level using comprehensive analysis. To confirm the reliability of the ceRNA regulatory network, differentially expressed miRNAs and lncRNAs were selected, and potential prognostic genes that did not show target DEMs and DELs were deleted.
In this study, 13 key potential prognostic genes were included to develop the novel ceRNA network, the expression of which might be regulated by eight DEMs and 61 DELs. We conducted qRT-PCR experiments on 20 pairs of HCC-and adjacent liver-tissue samples, and the result showed that expression levels of the 13 key potential prognostic genes were consistent with the result of our previous analysis. Among these key potential prognostic genes, CCNB1,Citation20 CEP55,Citation21 CHEK1,Citation22 EZH2,Citation23 KPNA2,Citation24 LRRC1,Citation25 PBK,Citation26 RRM2,Citation27 SLC7A11,Citation28 and ZWINTCitation29 have been validated as oncogenes in HCC according to previous studies. Interestingly, no studies have reported a relationship between SUCO gene expression and tumorigenesis, and we are planning to conduct experiments to explore the role of SUCO in the development and progression of HCC. It has been reported that ACSL1 was upregulated by HBXIP in breast cancer tissue and might play crucial roles in breast cancer development.Citation30 However, studies regarding the relationship between ACSL1 gene expression and HCC were not reported. In this study, we found that ACSL1 was downregulated in HCC tissues and that patients with high ACSL1 gene expression had a better prognosis, which needs further verification. Another study showed that patients with hepatitis B-associated HCC had higher CDC37L1 gene expression compared with patients without HCC, and CDC37L1 was able to protect HCC patients from persistent drug toxicity.Citation31 In contrast, we found that the CDC37L1 gene was downregulated in HCC tissue compared with adjacent normal liver tissue based on bioinformatic analyses and qRT-PCR experiments.
Recently, dysregulated miRNAs were reported to be associated with many molecular pathways in tumor evolution and progression.Citation32–Citation34 In this ceRNA network, eight DEMs were identified as core elements by which mRNAs and lncRNAs can “talk” to each other in the physiology and development of HCC. The identified DEMs were miR183,Citation35 miR205,Citation36 miR217,Citation37 miR372,Citation38 miR373,Citation39 miR424,Citation40 miR506,Citation41 and miR519d,Citation42 which have been validated previously to play specific roles in HCC tumorigenesis. These DEMs, which were experimentally validated in previous studies, could ensure ceRNA-network stability and were more conducive to the identification of DELs in this study.
Plenty of studies have certified that lncRNAs could be involved in many functional aspects associated with tumor evolution and progression.Citation43–Citation45 In this novel ceRNA network, nine potential prognostic lncRNAs were identified through survival analyses that could participate in the development of HCC. CLLU1 expression was shown to be upregulated in chronic lymphocytic leukemia and has been used for prognostic and diagnostic purposes.Citation46,Citation47 It has been reported that AP002478.1 can function as a prognostic biomarker in patients with Helicobacter pylori-positive gastric cancer.Citation48 Also, C2orf48 and C10orf91 are related to the overall survival time of patients with oral squamous-cell carcinoma.Citation49 However, lncRNAs CLLU1, AP002478.1, C2orf48, and C10orf91 have not previously been reported in other tumor types, including HCC. Moreover, little is known about the other five potential prognostic lncRNAs (AL163952.1, AL359878.1, CLRN1-AS1, ERVMER61-1, and WARS2-IT1). Therefore, further investigations are needed to clarify the function of these potential prognostic lncRNAs in HCC and other cancers.
Several limitations of the current study should be discussed. First, no DEMs related to postoperative HCC-patient survival were identified in the novel ceRNA network. Second, we lacked the experimental validation of lncRNA and miRNA expression in tissue samples to confirm our findings. Therefore, further research is needed to verify our study findings and unravel the mechanism of ceRNA in HCC.
Conclusion
This study provides numerous potential prognostic genes, and the function and signaling pathways they participate in are presented systematically. Moreover, we constructed a lncRNA–miRNA–mRNA ceRNA regulatory network in HCC, which has important clinical significance for the early detection and diagnosis of HCC and for the potential development of therapeutic targets for HCC. However, further biological experiments are needed to assess the function of these potential prognostic genes and the effect of the miRNAs and lncRNAs present within the ceRNA regulatory network.
Acknowledgments
This study was funded by the Beijing Municipal Administration of Hospitals Clinical Medicine Development of Special Funding Support (ZYLX201612), Beijing Municipal Administration of Hospitals’ Youth Programme (code QML20180203), the Basic Clinical Cooperative Research Foundation of Capital Medical University (17JL65), and the Capital Foundation of Medical Development (shoufa2016-2-2053).
Supplementary materials
Figure S1 Differential gene expression between HCC tissue and adjacent normal liver tissue from five expression-microarray groups.
Notes: (A) GSE14520 data; (B) GSE17548 data; (C) GSE19665 data; (D) GSE29721 data; (E) GSE60502 data. The red points represent genes that were upregulated and the green points those that were downregulated in HCC tissue compared with adjacent normal liver tissue, which were analyzed using R software and the Limma package. The black points represent genes without a significant difference between the two tissue types. Log2FC >1 and P<0.05 were used as cutoff criteria. Microarray groups downloaded from the GEO data set.
Abbreviations: FC, fold change; GEO, Gene Expression Omnibus; HCC, hepatocellular carcinoma.
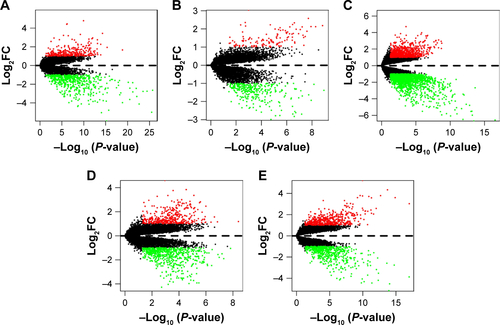
Figure S2 Hierarchical clustering heat maps of differentially expressed genes of five expression-microarray groups, downloaded from the GEO data set.
Notes: (A) GSE14520 data; (B) GSE17548 data; (C) GSE19665 data; (D) GSE29721 data; and (E) GSE60502 data. The color of genes gradually changes with expression-level changes in hepatocellular carcinoma (HCC) tissue compared with adjacent normal liver tissue. Black indicates no significant changes in gene expression. Prominent gene expression in HCC tissue is either upregulated (red color) or downregulated (green color). The depth of color corresponds to expression intensity. Data were analyzed using the R software and the Limma package using. Log2FC >1 and P<0.05 were used as cutoff criteria.
Abbreviations: FC, fold change; GEO, Gene Expression Omnibus.
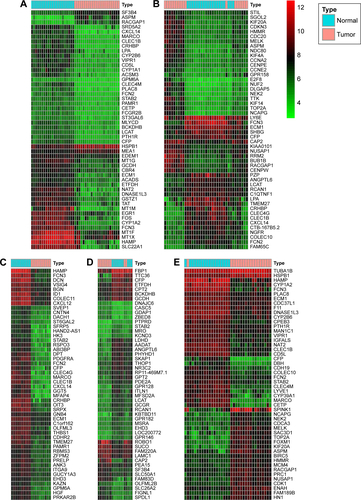
Figure S3 GO enrichment analysis of the potential prognostic genes in hepatocellular carcinoma.
Notes: (A) The GO analysis divided potential prognostic genes into three functional groups: the biological process, cell composition, and molecular function groups. (B) Significant GO enrichment items relating to the potential prognostic genes in the different functional groups.
Abbreviation: GO, Gene Ontology.
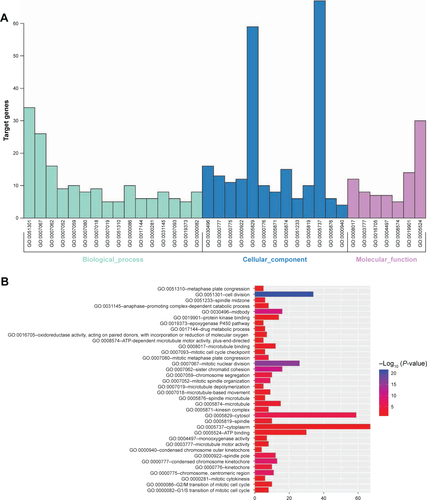
Figure S4 Pathway enrichment of potential prognostic genes.
Note: Blue represents signaling pathways, red represents upregulated genes, and green represents downregulated genes.
Disclosure
The authors report no conflicts of interest in this work.
References
- SiegelRLMillerKDJemalACancer statistics, 2018CA Cancer J Clin201868173029313949
- KulikLEl-SeragHBEpidemiology and management of hepatocellular carcinomaGastroenterology Epub20181024
- GhouriYAMianIRoweJHReview of hepatocellular carcinoma: epidemiology, etiology, and carcinogenesisJ Carcinog201716128694740
- ZhouLduYKongLZhangXChenQIdentification of molecular target genes and key pathways in hepatocellular carcinoma by bioinformatics analysisOnco Targets Ther2018111861186929670361
- YinFShuLLiuXMicroarray-based identification of genes associated with cancer progression and prognosis in hepatocellular carcinomaJ Exp Clin Cancer Res201635112727567667
- KrolJLoedigeIFilipowiczWThe widespread regulation of microRNA biogenesis, function and decayNat Rev Genet201011959761020661255
- RenFHYangHHeRQAnalysis of microarrays of miR-34a and its identification of prospective target gene signature in hepatocellular carcinomaBMC Cancer20181811229298665
- WenDYLinPLiangHWUp-regulation of CTD-2547G23.4 in hepatocellular carcinoma tissues and its prospective molecular regulatory mechanism: a novel qRT-PCR and bioinformatics analysis studyCancer Cell Int20181817429780284
- LiangCZhangJGeHLong non-coding RNA CASC2 in solid tumors: a meta-analysisClin Chim Acta201848635736830144439
- XieCRWangFZhangSLong noncoding RNA HCAL facilitates the growth and metastasis of hepatocellular carcinoma by acting as a ceRNA of LAPTM4BMol Ther Nucleic Acids2017944045129246322
- SalmenaLPolisenoLTayYKatsLPandolfiPPA ceRNA hypothesis: the Rosetta stone of a hidden RNA language?Cell2011146335335821802130
- KarrethFAPandolfiPPceRNA cross-talk in cancer: when ce-bling rivalries go awryCancer Discovery20133101113112124072616
- YangDHannaDLUsherJImpact of sex on the survival of patients with hepatocellular carcinoma: a surveillance, epidemiology, and end results analysisCancer2014120233707371625081299
- DwHKaiAKIoNTCGA whole-transcriptome sequencing data reveals significantly dysregulated genes and signaling pathways in hepatocellular carcinomaFront Med20159332233026276037
- LiBFengWLuoODevelopment and validation of a three-gene prognostic signature for patients with hepatocellular carcinomaSci Rep201771551728717245
- LinPWenDYLiQHeYYangHChenGGenome-wide analysis of prognostic lncRNAs, miRNAs, and mRNAs forming a competing endogenous RNA network in hepatocellular carcinomaCell Physiol Biochem20184851953196730092571
- ZhangZWangSJiDConstruction of a ceRNA network reveals potential lncRNA biomarkers in rectal adenocarcinomaOncol Rep20183952101211329512732
- WangXHuKBZhangYQYangCJYaoHHComprehensive analysis of aberrantly expressed profiles of lncRNAs, miRNAs and mRNAs with associated ceRNA network in cholangiocarcinomaCancer Biomarkers201823454955930452401
- YuanNZhangGBieFIntegrative analysis of lncRNAs and miRNAs with coding RNAs associated with ceRNA crosstalk network in triple negative breast cancerOnco Targets Ther2017105883589729276392
- ChaiNXieHHYinJPFOXM1 promotes proliferation in human hepatocellular carcinoma cells by transcriptional activation of CCNB1Biochem Biophys Res Commun2018500492492929705704
- JefferyJSinhaDSrihariSKalimuthoMKhannaKKBeyond cytokinesis: the emerging roles of CEP55 in tumorigenesisOncogene201635668369025915844
- HongJHuKYuanYCHK1 targets spleen tyrosine kinase (L) for proteolysis in hepatocellular carcinomaJ Clin Invest201212262165217522585575
- BugideSGreenMRWajapeyeeNInhibition of Enhancer of zeste homolog 2 (EZH2) induces natural killer cell-mediated eradication of hepatocellular carcinoma cellsProc Natl Acad Sci U S A201811515E3509E351829581297
- GaoCLWangGWYangGQYangHZhuangLKaryopherin subunit-α 2 expression accelerates cell cycle progression by upregulating CCNB2 and CDK1 in hepatocellular carcinomaOncol Lett20181532815282029435009
- LiYZhouBDaiJLiuRHanZGAberrant upregulation of LRRC1 contributes to human hepatocellular carcinomaMol Biol Rep20134074543455123645086
- YangYFPanYHCaoYPDZ binding kinase, regulated by FoxM1, enhances malignant phenotype via activation of β-Catenin signaling in hepatocellular carcinomaOncotarget2017829471954720528525379
- WangLHuangJJiangMRRM2 computational phosphoprotein network construction and analysis between no-tumor hepatitis/cirrhotic liver tissues and human hepatocellular carcinoma (HCC)Cell Physiol Biochem201026330331020798514
- ZhangLHuangYLingJOverexpression of SLC7A11: a novel oncogene and an indicator of unfavorable prognosis for liver carcinomaFuture Oncol2018141092793629528250
- YingHXuZChenMZhouSLiangXCaiXOverexpression of Zwint predicts poor prognosis and promotes the proliferation of hepatocellular carcinoma by regulating cell-cycle-related proteinsOnco Targets Ther20181168970229440916
- WangYCaiXZhangSHBXIP up-regulates ACSL1 through activating transcriptional factor Sp1 in breast cancerBiochem Biophys Res Commun2017484356557128132807
- YangYLuQShaoXDevelopment of a three-gene prognostic signature for hepatitis b virus associated hepatocellular carcinoma based on integrated transcriptomic analysisJ Cancer20189111989200229896284
- ZhangCWangPLiYRole of microRNAs in the development of hepatocellular carcinoma in nonalcoholic fatty liver diseaseAnat Rec (Hoboken) Epub20181012
- XuXTaoYShanLThe role of microRNAs in hepatocellular carcinomaJ Cancer20189193557356930310513
- VasuriFVisaniMAcquavivaGRole of microRNAs in the main molecular pathways of hepatocellular carcinomaWorld J Gastroenterol201824252647266029991871
- AnwarSLKrechTHasemeierBhsa-mir-183 is frequently methylated and related to poor survival in human hepatocellular carcinomaWorld J Gastroenterol20172391568157528321157
- LuJLinYLiFMiR-205 suppresses tumor growth, invasion, and epithelial–mesenchymal transition by targeting SEMA4C in hepatocellular carcinomaFaseb J2018321161236134
- ZhangMLiMLiNmiR-217 suppresses proliferation, migration, and invasion promoting apoptosis via targeting MTDH in hepatocellular carcinomaOncol Rep20173731772177828184926
- WuGWangYLuXLow mir-372 expression correlates with poor prognosis and tumor metastasis in hepatocellular carcinomaBMC Cancer201515118225880458
- WuNLiuXXuXMicroRNA-373, a new regulator of protein phosphatase 6, functions as an oncogene in hepatocellular carcinomaFebs J2011278122044205421481188
- YangHZhengWShuaiXMicroRNA-424 inhibits Akt3/E2F3 axis and tumor growth in hepatocellular carcinomaOncotarget2015629277362775026315541
- WangZSiMYangNMicroRNA-506 suppresses invasiveness and metastasis of human hepatocellular carcinoma cells by targeting IL8Am J Cancer Res2018881586159430210926
- FornariFMilazzoMChiecoPIn hepatocellular carcinoma miR-519d is up-regulated by p53 and DNA hypomethylation and targets CDKN1A/p21, PTEN, AKT3 and TIMP2J Pathol2012227327528522262409
- LiYEgranovSDYangLLinCMolecular mechanisms of long noncoding RNAs-mediated cancer metastasisGenes Chromosomes Cancer Epub20181022
- LinMTSongHJDingXYLong non-coding RNAs involved in metastasis of gastric cancerWorld J Gastroenterol201824333724373730197478
- ChenXYangYCaoYlncRNA PVT1 identified as an independent biomarker for prognosis surveillance of solid tumors based on transcriptome data and meta-analysisCancer Manag Res2018102711272730147369
- BuhlAMJurlanderJJørgensenFSIdentification of a gene on chromosome 12q22 uniquely overexpressed in chronic lymphocytic leukemiaBlood200610772904291116339396
- JosefssonPGeislerCHLeffersHCLLU1 expression analysis adds prognostic information to risk prediction in chronic lymphocytic leukemiaBlood2007109114973497917284524
- LiuYZhuJMaXceRNA network construction and comparison of gastric cancer with or without Helicobacter pylori infectionJ Cell Physiol Epub20181028
- LiSChenXLiuXComplex integrated analysis of lncRNAs-miRNAs-mRNAs in oral squamous cell carcinomaOral Oncol2017731928939059