
Abstract
Purpose
Glioma is a malignant tumor that originates in the brain and spine and is difficult to be completely removed. Though glioma patients receive active treatment, the survival rate is still poor. Therefore, it is urgent to discover a new medicine to treat glioma patients in order to improve the survival rate. In this study, we explored the anticancer effect and the potential mechanism of luteolin on glioma in vitro.
Materials and methods
Cell viability was determined by Cell Counting Kit-8 (CCK-8) assay. Fluorescent microscopy and flow cytometry analysis were used to determine the cellular apoptosis. Western blot analysis was performed to explore the changes in protein expression. Quantitative reverse transcription-PCR (qRT-PCR) analysis was utilized to evaluate the expression level of the tumor suppressor miR-124-3p.
Results
CCK-8 assays indicated that luteolin significantly inhibited glioma cell proliferation in a time- and dose-dependent manner. Fluorescent microscopy and flow cytometry analysis confirmed that luteolin induced glioma cell apoptosis. Western blot analysis showed that luteolin induced cellular apoptosis in glioma cells via MAPK activation (JNK, ERK, and p38). Luteolin stimulated the death receptor (FADD) to regulate the apoptosis proteins (Caspase-8, Caspase-3, and PARP). Luteolin increased the expression levels of LC3B II/I and downregulated the level of p62 that promotes cell autophagy. Finally, qRT-PCR confirmed that luteolin upregulated the expression levels of miR-124-3p.
Conclusion
These findings illustrate that luteolin may be a potential drug for glioma treatment.
Introduction
Glioma, the most common malignant neoplasm of the brain, accounts for 81% of brain cancers.Citation1,Citation2 Conventional therapies, including surgical resection, chemotherapy, and radiotherapy, are still unsuccessful for completely curing glioma.Citation3 However, the researchers for the current study found no additional effective drugs to treat glioblastoma, except temozolomide (TMZ).Citation4 Therefore, to improve therapeutic efficacy, the demand for development and introduction of new medicines and treatments is imminent.
In recent decades, because of the antitumor effects in brain cancers, the chemical constituents of traditional Chinese medicines have attracted great attention in the academic field.Citation5 Luteolin has considerable pharmacological value, including antitumor, antioxidative, neuroprotective, and anti-inflammatory effects.Citation6–Citation9 The anticancer effect of luteolin has been investigated in various cancers.Citation10–Citation15 For example, luteolin inhibited the proliferation of human cholangiocarcinoma cells by inducing apoptosis and interrupting the JNK/STAT3 pathway.Citation10 It also induced apoptosis in Hela cells through suppressing the expression of human papilloma virus E6 and E7 oncogenes and increasing the expression of death receptors by regulating the Fas/FasL, DR5/TRAIL, and FADD.Citation11 In the field of glioma, Souza et al reported that flavonoids mixture could inhibit cell proliferation in glioma.Citation16 Wang et al indicated that luteolin inhibited glioma cell proliferation through endoplasmic reticulum stress and mitochondrial pathway.Citation17 Anson et al mentioned that luteolin decreased cell proliferation by inhibiting the epidermal growth factor signaling pathway in glioma.Citation19 Though some efforts have been made on luteolin in glioma treatment, these in vitro results were mainly based on the glioma cell line U87, which was recently reported by Allen that this cell line was lack of representativeness of glioma.Citation20 miRNAs are small non-coding RNAs that negatively regulate mRNA translation.Citation21 miRNAs are reported to be involved in luteolin’s anticancer activity.Citation18,Citation22 Chakrabarti and Ray discovered that luteolin induced apop-tosis in glioblastoma by regulating miR-7-1-3p expression.Citation18 Yang et al found that miR-6809-5p mediated luteolin-induced anticancer effects by targeting flotillin 1 in hepatoma.Citation23 In our previous studies, we have identified several miRNAs as tumor suppressors in glioma, including miR-124-3p,Citation24 miR-137,Citation25 miR-181b-5p,Citation26 and miR-454-3p,Citation21 and we would like to examine whether these four miRNAs are involved in luteolin’s anticancer activity in glioma. In the present study, the glioma cell lines LN229 and U251 were chosen. Luteolin was found to inhibit glioma cell proliferation, induce cellular apoptosis, and promote cellular autophagy through the activation of death receptor and MAPK signaling pathways and miR-124-3p upregulation. Our results suggested the potential of luteolin as a novel therapeutic drug for glioma.
Materials and methods
Chemicals and materials
Luteolin was purchased from Aynor Medicine Technology Co. Ltd (Xi’an, China) at a purity of 98%. TMZ and 3-methyadenine (3-MA) were purchased from Sigma-Aldrich Co. (St Louis, MO, USA). Dimethyl sulfoxide (DMSO) was obtained from MP Biomedicals LLC (Santa Ana, CA, USA). Trypsin-EDTA 0.25% (1×), FBS, and DMEM were purchased from Thermo Fisher Scientific (Waltham, MA, USA). The Hoechst 33258 kit and Cell Counting Kit-8 (CCK-8) kit were obtained from the Beyotime Institute of Biotechnology (Shanghai, China). Antibodies, including β-actin, P-JNK, JNK, PARP, FADD, P-p38, p38, LC3B, p62, Caspase-3, cleaved Caspase-3, Caspase-8, and cleaved Caspase-8, were purchased from Cell Signaling Technology (Danvers, MA, USA). The antibodies of P-ERK, and ERK were purchased from Beyotime Institute of Biotechnology. The horseradish peroxidase-conjugated secondary biotinyl-ated antibodies were obtained from Jackson ImmunoResearch Laboratories (West Grove, PA, USA). All other reagents were of standard biochemical quality unless otherwise stated.
Cell culture
The human glioma cell line U251 was purchased from the Type Culture Collection of the Chinese Academy of Sciences (Shanghai, China). The human cell line HEB and glioma cell line LN229 were obtained from Nanjing Beierbo Co. Ltd (Nanjing, China). The cells were cultured in DMEM containing 10% FBS. All the cells were maintained at 37°C with 5% CO2 in a humidified atmosphere. Finally, the cells were planted at an appropriate density and in a good condition before the experiments.
CCK-8 assay
Cell survival was measured by CCK-8 assays. Cells in a good condition were digested with trypsin and plated in a 96-well plate with 8×10³ cells per well and then incubated overnight to allow attachment and growth. Luteolin or TMZ was dissolved in DMSO at indicated concentrations and then mixed with 10% FBS-DMEM to prepare solutions with different concentrations. The cells were operated under different treatments for 24 and 48 hours. Twenty microliters of CCK-8 solution was added to each well (200 µL) and incubated for 1 hour at 37°C. Afterward, ELx800 Absorbance Microplate Reader (BioTek, Winooski, VT, USA) was utilized to measure the OD at 490 nm.
Hoechst 33258 staining
A Hoechst staining kit was used to detect changes in cell nucleus apoptosis. Clean cover slips were steeped in alcohol (75%) for 30 minutes, washed three times with sterile PBS, and then incubated with cells for one night in a six-well plate. Cells were treated with luteolin at different concentrations for 24 hours. After removing the culture media, 0.5 mL of stationary liquid was added to each well for 10 minutes. The fixing solution was discarded, and PBS was used to wash the cells for 3 minutes; the process was repeated several times. The cells were stained with Hoechst 33258 (0.5 mL) for 5 minutes in the dark. After discarding Hoechst 33258 and washing the cells twice with PBS, one drop of mounting medium was added onto each of the cover slips. Then, the cells were observed under an IX71 fluorescence microscope (Olympus Corporation, Tokyo, Japan).
Flow cytometry assay
Flow cytometry was performed to detect apoptosis. The cells were treated with different concentrations of luteolin for 24 hours and then collected. Next, the cells were washed entirely with PBS, separated by trypsin digestion, and transferred into a new centrifuge tube. After centrifugal settling, 1×10⁵ cells were collected and then stained with 5 µL of Annexin V-fluorescein isothiocyanate and 10 µL of propidium iodide (Beyotime Institute of Biotechnology) for 20 minutes in the dark. The cells were immediately analyzed by a Guava EasyCyte 6HT-2L flow cytometer (EMD Millipore, Billerica, MA, USA).
RNA extraction and quantitative reverse transcription-PCR (qRT-PCR)
Twenty-four hours after treatment as described above, total RNA was extracted from cultured cells by TRIzol Reagent (Thermo Fisher Scientific) according to the guide, and RT-PCR reaction was performed immediately. Levels of mature miR-124-3p, miR-137, miR-181b-5p, and miR-454-3p were quantified using TaqMan microRNA probes (Thermo Fisher Scientific) according to the instructions. Basically, 2 µg of total RNA was transformed into cDNA by using AMV reverse transcriptase (TaKaRa, Shiga, Japan) and a stem-loop primer (Thermo Fisher Scientific). The mixture was incubated at 16°C for 15 minutes, 42°C for 60 minutes, and 85°C for 5 minutes to form a library of miRNA cDNAs. qRT-PCR was performed using a TaqMan PCR kit on a 7500 Sequence Detection System (Thermo Fisher Scientific). All the sequences were repeated three times. In addition, U6 small nuclear RNA was used as a control. The relative amount of miRNA to internal control U6 transcript was calculated using the equation, ΔCt=CtmiRNA−CtU6. Synthetic miR-124-3p mimics (124M), miR-124-3p inhibitor (124I), and negative control (NC) were purchased from GenePharma (Shanghai, China). The transfections were carried out with Lipofectamine 2000 (Thermo Fisher Scientific) according to the manufacturer’s specifications.
Western blot analysis
After different treatments for 24 hours, the cells were digested with trypsin, and single cell suspensions were obtained and washed three times with PBS. A whole-cell Lysis Assay Kit (KeyGEN Biotec, Nanjing, China) was utilized to extract the total protein. The protein concentration was determined by the bicinchoninic acid protein assays (Cell Signaling Technology). Then, the denatured protein samples were separated through SDS-PAGE. Next, the proteins were transferred onto polyvinylidene difluoride (PVDF) flat microporous membranes and blocked for 1 hour with 5% skimmed milk powder. Then, the PVDF membranes were incubated overnight at 4°C with the following primary antibodies: ERK (1:1,000), P-ERK (1:1,000), JNK (1:1,000), P-JNK (1:1,000), p38 (1:1,000), P-p38 (1:1,000), FADD (1:1,000), Caspase-8 (1:1,000), cleaved Caspase-8 (1:1,000), Caspase-3 (1:1,000), cleaved Caspase-3 (1:1,000), PARP (1:1,000), cleaved PARP (1:1,000), LC3B (1:1,000), and β-actin (1:1,000) according to the manufacturer’s instructions. After washing three times with 1× PBST, the membranes were incubated with the diluted secondary antibodies for 1 hour. After being washed three times again, the blots were detected using an enhanced chemiluminescence solution (Thermo Fisher Scientific). The films were processed using a medical X-ray film processor (Taixing Suxing Company, Jiangsu, China). The OD values of each protein were analyzed using the NIH imaging program (ImageJ).
Statistical analysis
The results were generated from at least three repetitions of independent experiments. Data were expressed as the mean ± SD and analyzed with GraphPad Prism 5.0 software. One-way ANOVA and the two-tailed Student’s t-test were employed to compare different groups. P<0.05 values were considered statistically significant.
Results
Luteolin inhibited cell proliferation
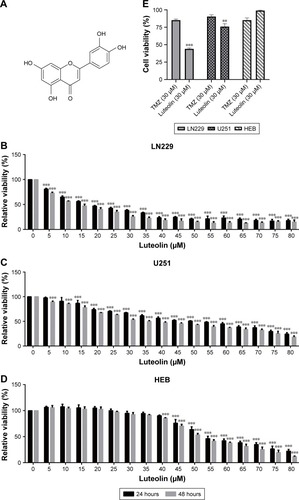
Luteolin is a flavonoid mainly extracted from the honeysuckle plant; the chemical structure is shown in . After treatments with different concentrations of luteolin for 24 and 48 hours, the cell viability was examined via CCK-8 assay. Under the same experimental conditions, we treated LN229, U251, and HEB cell lines with different concentrations of luteolin. The 50% growth inhibition (GI50) values of luteolin on LN229 cells at 24 and 48 hours were 18.2 and 12.9 µM, respectively (). The GI50 values of luteolin on U251 cells at 24 and 48 hours were 47.5 and 36.72 µM, respectively (). Meanwhile, the result showed that luteolin-treated HEB cells as normal glial cells had no massive death below 40 µM of luteolin, and the GI50 values of luteolin on HEB cells at 24 and 48 hours were 57.96 and 53.81 µM, respectively (). TMZ, the first-line treatment for glioblastoma, was selected as a positive control. As shown in , luteolin was more effective against glioma and less cytotoxic in normal cells than TMZ at the same concentration (30 µM). The results showed that luteolin treatment apparently slowed down the glioma cell proliferation rate in a concentration- and time-dependent manner, and thus, luteolin may be a safe and therapeutic agent against glioma.
Figure 1 Luteolin inhibited cell proliferation in glioma cells.
Notes: (A) The molecular structural formula of luteolin. (B) LN229 cells were incubated with different concentrations of luteolin for 24 and 48 hours, and then the cell viability was measured by CCK-8 assay. (C) U251 cells were incubated with different concentrations of luteolin for 24 and 48 hours, and then the cell viability was measured by CCK-8 assay. (D) HEB cells were incubated with different concentrations of luteolin for 24 and 48 hours, and then the cell viability was measured by CCK-8 assay. (E) LN229, U251, and HEB cell lines were incubated with luteolin and temozolomide, respectively, for 24 hours. Data are expressed as the mean ± SD of three independent experiments (**P<0.01, ***P<0.001 vs the control group; n=3).
Abbreviations: CCK-8, Cell Counting Kit-8; TMZ, temozolomide.
Luteolin induced cellular apoptosis
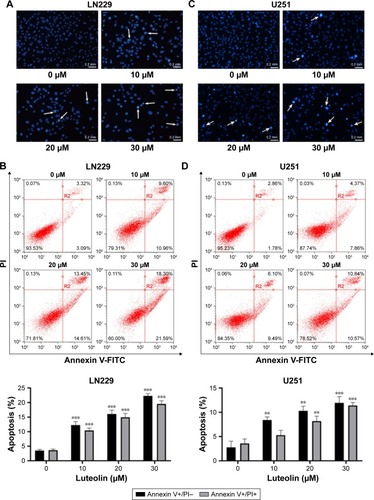
To investigate the potential mechanisms of how luteolin markedly suppresses cell proliferation in glioma cells, Hoechst 33258 staining was used to observe the morphological and biochemical features of apoptosis after treating cancer cells with varying levels of luteolin. According to the observation under fluorescence microscopy, karyorrhexis and apoptosis bodies significantly increased compared to the control group. The results indicated that luteolin caused the morphological changes in LN229 cells (). In addition, flow cytometric analysis revealed that luteolin induced apoptosis in LN229 cells: the percentages of early and late apoptotic cells significantly increased after treatment with luteolin for 24 hours. The percentage of early apoptotic cells increased from 3.09% to 21.59% after exposure to luteolin for 24 hours. The percentage of late apoptotic cells also distinctly increased with increased luteolin concentration (). The results obtained for luteolin on U251 cells were similar to those obtained on LN229 cells as shown in . However, it is worthy to note that the apoptosis rate induced by luteolin on LN229 cells was more apparent than that on U251 cells.
Figure 2 Luteolin induced apoptosis.
Notes: (A) LN229 cells were exposed to luteolin at different concentrations (0, 10, 20, and 30 µM) for 24 hours then stained with Hoechst 33258. The nuclei were observed under a fluorescence microscope. The white arrows indicate the apoptosis bodies in glioma cells. (B) LN229 cells were stained with Annexin V-FITC/PI and measured by flow cytometry. Statistical analysis was performed for apoptosis assay (***P<0.001 vs the control group; n=3). (C) U251 cells were exposed to luteolin at different concentrations (0, 10, 20, and 30 µM) for 24 hours then stained with Hoechst 33258. The nuclei were observed under a fluorescence microscope. The white arrows indicate the apoptosis bodies in glioma cells. (D) U251 cells were stained with Annexin V-FITC/PI and measured by flow cytometry. Statistical analysis was performed for apoptosis assay (**P<0.01, ***P<0.001 vs the control group; n=3).
Abbreviations: FITC, fluorescein isothiocyanate; PI, propidium iodide.
Luteolin activated the death receptor pathway
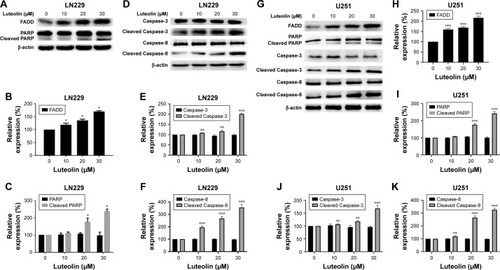
The death receptor signaling pathway is an important mechanism involved in cellular apoptosis. We performed Western blot to investigate the changes in some key proteins involved in this pathway in both LN229 and U251 cells. We first tested the expression of some key proteins in LN229 cells treated with luteolin. Our results showed that the expression of FADD was enhanced with increasing luteolin concentration (). There were no obvious changes in the expression levels of PARP in luteolin-treated cells, but cleaved PARP was significantly increased in luteolin-treated cells (). The average densitometric values of FADD, PARP, and cleaved PARP in three independent experiments are shown by the histogram in . The expression levels of Caspase-8 had no remarkable change in the luteolin-treated group compared to the control group, while cleaved Caspase-8 was markedly increased after luteolin treatment compared to that in the control group (). Similarly, there was no distinct change in the expression of Caspase-3 in glioma cells after luteolin treatment (), but the expression levels of cleaved Caspase-3 were increased in the cells treated with luteolin (). The average densitometric values of Caspase-8, cleaved Caspase-8, Caspase-3, and cleaved Caspase-3 in three independent experiments are shown in . The results were similar in U251 cells as shown in .
Figure 3 Luteolin activated the death receptor pathway.
Notes: (A) LN229 cells were exposed to luteolin (0, 10, 20, and 30 µM) for 24 hours; the levels of FADD, PARP, and cleaved PARP were then measured by Western blot analysis. (B) The expression levels of FADD in luteolin-treated LN229 cells are shown as histograms. (C) The expression levels of PARP and cleaved PARP in luteolin-treated LN229 cells are shown as histograms. (D) LN229 cells were exposed to luteolin (0, 10, 20, and 30 µM) for 24 hours; the levels of Caspase-8, cleaved Caspase-8, Caspase-3, and cleaved Caspase-3 were measured by Western blot analysis. (E) The expression levels of Caspase-3 and cleaved Caspase-3 in luteolin-treated LN229 cells are shown as histograms. (F) The expression levels of Caspase-8 and cleaved Caspase-8 in luteolin-treated LN229 cells are shown as histograms. (G) U251 cells were exposed to luteolin (0, 10, 20, and 30 µM) for 24 hours; the levels of FADD, Caspase-8, cleaved Caspase-8, Caspase-3, cleaved Caspase-3, PARP, and cleaved PARP were then measured by Western blot analysis. (H) The expression levels of FADD in luteolin-treated U251 cells are shown as histograms. (I) The expression levels of PARP and cleaved PARP in luteolin-treated U251 cells are shown as histograms. (J) The expression levels of Caspase-3 and cleaved Caspase-3 in luteolin-treated U251 cells are shown as histograms. (K) The expression levels of Caspase-8 and cleaved Caspase-8 in luteolin-treated U251 cells are shown as histograms. (*P<0.05, **P<0.01, ***P<0.001 vs the control group; n=3).
Luteolin activated the MAPK pathway
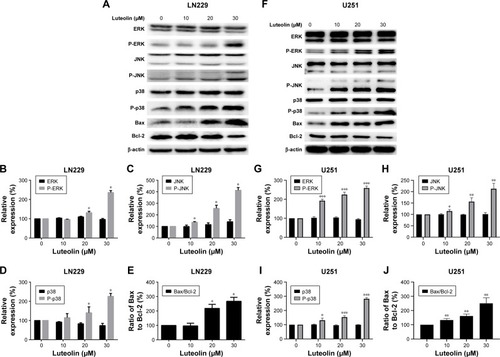
We next explored the effect of luteolin on the MAPK pathway in LN229 and U251 cells. We first detected the expression levels of ERK, P-ERK, JNK, P-JNK, p38, P-p38, Bax, and Bcl-2 in LN229 cells. We found that luteolin increased the expression levels of P-ERK, but the expression levels of ERK were unchanged in the luteolin-treated group (). The expression of P-JNK was upregulated in the luteolin-treated group compared to the control group (). Similar to ERK, the expression levels of JNK showed no remarkable changes in the luteolin-treated group (). The expression of P-p38 was markedly increased after luteolin treatment compared to that in the control group, and there were no obvious changes in the expression levels of p38 in luteolin-treated cells (). In addition, we also measured the protein expression levels of Bax and Bcl-2. The level of Bax was significantly upregulated in the luteolin-treated group compared to the control group. Conversely, the expression of Bcl-2 was significantly lower than that in the control group (). The statistical analyses of ERK, P-ERK, JNK, P-JNK, p38, and P-p38 are shown by a bar graph in . The ratio of Bax to Bcl-2 increased in a concentration-dependent manner (). The results were similar in U251 cells as shown in .
Figure 4 Luteolin activated the MAPK signaling pathway.
Notes: (A) LN229 cells were treated with luteolin (0, 10, 20, and 30 µM) for 24 hours, and Western blot analysis was performed to measure the expression levels of ERK, P-ERK, JNK, P-JNK, p38, P-p38, Bax, and Bcl-2. (B) The expression levels of ERK and P-ERK in luteolin-treated LN229 cells are shown as histograms. (C) The expression levels of JNK and P-JNK in luteolin-treated LN229 cells are shown as histograms. (D) The expression levels of p38 and P-p38 in luteolin-treated LN229 cells are shown as histograms. (E) The ratio of Bax to Bcl-2 in luteolin-treated LN229 cells is shown as a histogram. (F) U251 cells were treated with luteolin (0, 10, 20, and 30 µM) for 24 hours, and Western blot analysis was performed to measure the levels of ERK, P-ERK, JNK, P-JNK, p38, P-p38, Bax, and Bcl-2. (G) The expression levels of ERK and P-ERK in luteolin-treated U251 cells are shown as histograms. (H) The expression levels of JNK and P-JNK in luteolin-treated U251 cells are shown as histograms. (I) The expression levels of p38 and P-p38 in luteolin-treated U251 cells are shown as histograms. (J) The ratio of Bax to Bcl-2 in luteolin-treated U251 cells is shown as a histogram. (*P<0.05, **P<0.01, ***P<0.001 vs the control group; n=3).
Luteolin induced cell autophagy
We examined the effect of luteolin on cell autophagy. After the LN229 cells were treated by luteolin, there was no obvious change in the protein expression levels of LC3B I compared to the control group. However, the levels of LC3B II were obviously enhanced with increase in luteolin concentrations (). The ratio of LC3B II to LC3B I increased in a concentration-dependent manner (). LC3 is responsible for delivery of P62 into lysosomes for degradation in the processes of autophagy. We measured the protein expression levels of P62. We found that P62 was expressed at lower levels in luteolin-treated cells than in control cells (). The results were similar in U251 cells (). It is worthy to note that luteolin had a relatively stronger effect on inducing autophagy in U251 cells than in LN229 cells. 3-MA, an early-stage inhibitor of the autophagic pathway, was selected to detect the autophagic flux. As shown in , 3-MA significantly inhibited the autophagic flux induced by luteolin in LN229 cells. The statistical analysis for LC3B is shown in and for p62 in . The results were similar in U251 cells as shown in .
Figure 5 Luteolin promoted the expression of miR-124-3p and induced autophagy in glioma cells cells.
Notes: (A) The expression levels of LC3B I, LC3B II, and p62 were evaluated by Western blot analysis in luteolin-treated LN229 cells. (B) The ratio of LC3B II to LC3B I in luteolin-treated LN229 cells is shown as a histogram. (C) Relative expression of p62 in luteolin-treated LN229 cells is shown in the diagram. (D) The expression levels of LC3B I, LC3B II and p62 were evaluated by Western blot analysis in luteolin-treated U251 cells. (E) The ratio of LC3B II to LC3B I in luteolin-treated U251 cells is shown as a histogram. (F) Relative expression of p62 in luteolin-treated U251 cells is shown in the diagram. (G) The expression levels of LC3B I, LC3B II, and p62 were evaluated by Western blot analysis in LN229 cells treated with luteolin (30 µM), or luteolin (30 µM)+3-MA (1 mM). L: Luteolin. (H) The ratio of LC3B II to LC3B I in LN229 cells is shown as a histogram. (I) Relative expression of p62 in LN229 cells is shown in the diagram. (J) The expression levels of LC3B I, LC3B II, and p62 were evaluated by Western blot analysis in U251 cells treated with luteolin (30 µM), or Luteolin (30 µM)+3-MA (1 mM). L: Luteolin. (K) The ratio of LC3B II to LC3B I in U251 cells is shown as a histogram. (L) Relative expression of p62 in U251 cells is shown in the diagram. (M) The expression levels of miR-124-3p in luteolin-treated LN229 cells are shown as histograms. (N) The expression levels of miR-124-3p in luteolin-treated U251 cells are shown as histograms. (O) Effects of luteolin, luteolin + miR-124-3p mimics, and luteolin + miR-124-3p inhibitor on LN229 cells’ viability. (P) Effects of luteolin, luteolin + miR-124-3p mimics, and luteolin + miR-124-3p inhibitor on U251 cells’ viability. (Q) Western blot analysis of the expression of Caspase-3 and cleaved Caspase-3 under different treatment conditions in LN229 cells: L +124M, luteolin + miR-124-3p mimics; L +124 I, luteolin + miR-124-3p inhibitor. (R) Western blot analysis of the expression of Caspase-3 and cleaved Caspase-3 under different treatment conditions in U251 cells: L +124M, luteolin + miR-124-3p mimics; L +124 I, luteolin + miR-124-3p inhibitor. (*P<0.05, **P<0.01, ***P<0.001 vs the control group; n=3).
Abbreviation: 3-MA, 3-methyadenine.
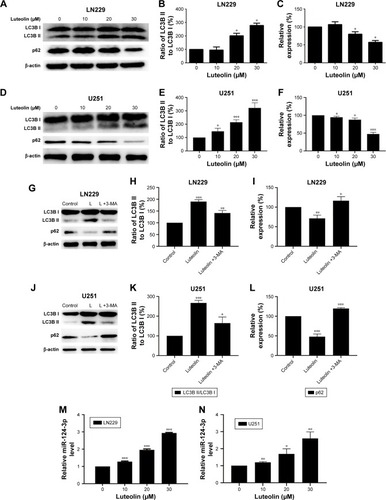
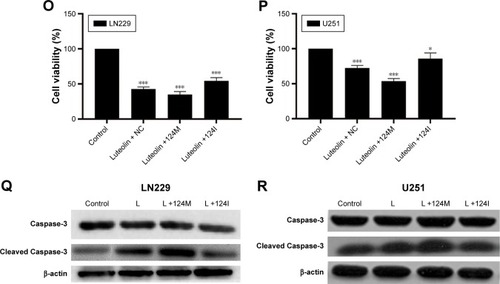
Luteolin increased the expression of miR-124-3p
We first detected the expression levels of the four miRNAs after luteolin treatment in LN229 cells. As shown in , only the expression levels of miR-124-3p were significantly upregulated in the luteolin-treated group when compared to the control group, while the other three miRNAs were unchanged in both LN229 and U251 cells (data not shown). Next, we investigated the relationship of miR-124-3p with the effect of luteolin on cell proliferation. As shown in , miR-124-3p overexpression could significantly increase cellular cytotoxicity, while miR-124-3p downregulation could decrease cellular cytotoxicity in LN229 cells. It was similar in U251 cells (). Finally, we investigated the relationship of miR-124-3p with the effect of luteolin on apoptosis. As shown in , miR-124-3p overexpression could significantly increase cleaved Caspase-3, while miR-124-3p downregulation could decrease cleaved Caspase-3 in LN229 cells. It was similar in U251 cells ().
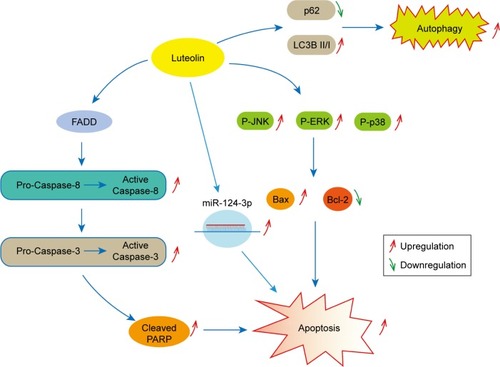
In summary, our results showed that luteolin suppresses tumor proliferation through inducing apoptosis via MAPK and death receptor pathway activation in glioma. We also found that luteolin treatment could induce autophagy and promote the expression of miR-124-3p in glioma cells ().
Figure 6 Experimental mechanism diagram.
Note: Luteolin suppresses tumor proliferation through inducing apoptosis and autophagy via MAPK activation in glioma.
Discussion
Luteolin is a compound of flavones that is used in various traditional Chinese herbal medicines.Citation27 In the present study, we mainly explored the effect of luteolin on human glioma cells. We found that luteolin showed inhibition of glioma cell proliferation and induction of apoptosis. Further studies of the molecular mechanism showed that luteolin could activate MAPK and FADD to induce apoptosis, and could induce autophagy and upregulate the tumor suppressor gene miR-124-3p. These results provide a basis for developing luteolin into a new anti-glioma medicine.
The apoptotic pathway is divided into the extrinsic death receptor pathway and the intrinsic mitochondrial pathway.Citation28 The extrinsic death receptor pathway involves some related proteins, such as FADD, Caspase-8, and Caspase-3, which can be activated to improve the expression of PARP.Citation29 During drug-induced apoptosis, PARP is cleaved into fragments, and cleaved PARP is usually used as a marker of apoptosis.Citation30 MAPK pathway activates especially the transmitted signals to activate several regulatory molecules to initiate cellular processes.Citation31 For example, activating the MAPK pathway can induce apoptosis, which is an approach utilized in various kinds of chemotherapeutic drugs as an anticancer mechanism.Citation32–Citation34 The MAPK pathway is shared by three main groups of mammalian MAPKs: ERK, JNK, and p38, which are involved in cell apoptosis.Citation35,Citation36 The activation of ERK, JNK, and p38 is most frequently associated with the induction of apoptosis in multiple tumor cells.Citation37,Citation38 In particular, the activated JNK can regulate mitochondrial proteins such as Bcl-2 to trigger a plethora of cellular processes, such as cell proliferation and apoptosis.Citation39 Although Souza et al found that luteolin could inhibit cell proliferation in glioma, the inherent mechanism had not been discussed.Citation16 Wang et al found that luteolin could induce apoptosis in glioma cells through ROS/ER stress and mitochondrial dysfunction.Citation17 Chakrabarti et al found that luteolin could stimulate cell apoptosis via regulating several apoptosis-related proteins and miR-7-1-3p upregulation in glioma.Citation18 Anson et al reported that luteolin decreased the expression of EGFR mRNA to inhibit glioma cell proliferation.Citation19 However, all these studies chose the U87MG cell line, which has been reported to lack representativeness of glioma.Citation20 This issue may weaken the conclusion obtained from their experiments. In our research, two glioma cell lines LN229 and U251 were chosen. Our results indicated that luteolin not only increased the number of apoptotic bodies, but also activated FADD, Caspase-3, Caspase-8, and PARP, all of which participate in the regulation of the extrinsic death receptor pathway. Our results also revealed that luteolin induced the activation and phosphorylation of p38, JNK, and ERK. Based on these results, we believed that luteolin could induce apoptosis to achieve antitumor effect via the death receptor pathway and MAPK activation in human glioblastoma.
Autophagy is a catabolic process whereby damaged organelles, aged proteins, and damaged proteins are sequestered and degraded to maintain cellular homeostasis.Citation40 During autophagy, LC3 is responsible for the delivery of p62 into lysosomes for degradation.Citation41 In recent studies, it was reported that autophagy not only protects cells from cellular metabolic stress, but can also function as a tumor suppressor.Citation42,Citation43 The antitumor function is supported by the observations in other physiological processes.Citation44–Citation47 In the human HCC cell line SMMC-7721, luteolin can inhibit cancer growth through inducing autophagy.Citation44 In addition, luteolin treatment can induce autophagy in NCI-H460 lung carcinoma cells and human osteosarcoma U2OS cells, as well as H9C2 cells.Citation45 In glioma, Chakrabarti et al showed that luteolin decreased the expression of PKCα in the Rapamycin-pretreated glioma cells. They also found that luteolin could inhibit autophagy in RAPA-pretreated glioma cells through regulating some autophagy-related proteins such as Beclin-1, LC3B I, LC3B II, mTOR, and p62.Citation18 However, in our study, we observed a significant increase in the ratio of LC3B II to LC3B I. Conversely, the expression of p62 tapered with increase of luteolin concentration. These results demonstrated that luteolin treatment induced autophagy. Based on the differences between the two studies, we found that Chakrabarti et al used RAPA to pretreat glioma cells, whereas we only used luteolin to treat glioma without any pretreatment. Furthermore, we found that luteolin could increase LC3B II level and decrease p62 level, while the addition of 3-MA could inhibit the induction. This indicated that luteolin may promote autophagosome initiation. Therefore, we believe our study is more convincing with respect to the effect of luteolin on autophagy in glioma cells. Additionally, we found that the cell lines used in the two studies were different. This difference may be an important reason for the different results obtained.
miR-124-3p could promote apoptosis to inhibit cell proliferation, invasion, and bioenergetics by targeting PIM1, which is a key control protein in cell proliferation, cell cycle, apoptosis, and metabolism.Citation48 We found that luteolin distinctly promoted the expression of miR-124-3p. In addition, miR-124-3p mimics significantly enhanced cellular cytotoxicity and apoptosis induced by luteolin, while miR-124-3p inhibitor partially reduced cellular cytotoxicity and apoptosis induced by luteolin. These results established the relationship of miR-124-3p with the effect of luteolin in glioma. We believe that the antitumor effect of luteolin may be associated with regulation of miR-124-3p expression.
Conclusion
Our results indicated that luteolin could suppress cell viability, induce cellular apoptosis and autophagy, and increase the expression of miR-124-3p. These results confirmed that luteolin has an antitumor effect on glioma. Our results will promote further research into the use of luteolin in glioma treatment.
Ethical approval
This article does not contain any study with human participants or animals performed by any of the authors.
Acknowledgments
This study was funded by the National Natural Science Foundation of China (81302197), Changzhou High-Level Medical Talents Training Project (2016CZBJ006), and Changzhou Municipal Commissions of Health and Family Planning Major Scientific and Technological Project (ZD201620).
Disclosure
The authors report no conflicts of interest in this work.
References
- JiangYUhrbomLOn the origin of gliomaUps J Med Sci2012117211312122348397
- OstromQTBauchetLDavisFGThe epidemiology of glioma in adults: a “state of the science” reviewNeuro Oncol201416789691324842956
- de GrootJFHigh-grade gliomasNeuro Oncol201521332344
- ShiLSunGDMC is not better than TMZ on intracranial anti-glioma effectsJ Cell Biochem201811976057606429575236
- ZhangFYHuYQueZYShikonin inhibits the migration and invasion of human glioblastoma cells by targeting phosphorylated β-catenin and phosphorylated PI3K/Akt: a potential mechanism for the anti-glioma efficacy of a traditional Chinese herbal medicineInt J Mol Sci20151610238232384826473829
- MajumdarDJungKHZhangHLuteolin nanoparticle in chemoprevention: in vitro and in vivo anticancer activityCancer Prev Res (Phila)201471657324403290
- JiaZNallasamyPLiuDLuteolin protects against vascular inflammation in mice and TNF-alpha-induced monocyte adhesion to endothelial cells via suppressing IKBα/NF-κB signaling pathwayJ Nutr Biochem201526329330225577468
- XuJWangHDingKLuteolin provides neuroprotection in models of traumatic brain injury via the Nrf2–ARE pathwayFree Radic Biol Med201471618619524642087
- CaoZDingYKeZLuteoloside acts as 3C protease inhibitor of enterovirus 71 in vitroPLoS One2016112e014869326870944
- AneknanPKukongviriyapanVPrawanAKongpetchSSripaBSenggunpraiLLuteolin arrests cell cycling, induces apoptosis and inhibits the JAK/STAT3 pathway in human cholangiocarcinoma cellsAsian Pac J Cancer Prev201415125071507624998588
- HamSKimKHKwonTHLuteolin induces intrinsic apoptosis via inhibition of E6/E7 oncogenes and activation of extrinsic and intrinsic signaling pathways in HPV-18-associated cellsOncol Rep20143162683269124789165
- WuHHuangMLiuYShuYLiuPLuteolin induces apoptosis by up-regulating miR-34a in human gastric cancer cellsTechnol Cancer Res Treat201514674775524988056
- KrifaMLeloupLGhediraKMousliMChekir-GhediraLLuteolin induces apoptosis in Be colorectal cancer cells by downregulating calpain, UHRF1, and DNMT1 expressionsNutr Cancer20146671220122725207720
- LipingMAPengHLiKLuteolin exerts an anticancer effect on NCI-H460 human non-small cell lung cancer cells through the induction of SIRT1-mediated apoptosisMol Med Rep20151234196420226096576
- YangMYWangCJChenNFHoWHLuFJTsengTHLuteolin enhances paclitaxel-induced apoptosis in human breast cancer MDA-MB-231 cells by blocking STAT3Chem Biol Interact20142131606824525192
- SouzaPOBianchiSEFigueiróFAnticancer activity of flavonoids isolated from Achyrocline satureioides in gliomas cell linesToxicol In Vitro201851233329730415
- WangQWangHJiaYPanHDingHLuteolin induces apoptosis by ROS/ER stress and mitochondrial dysfunction in gliomablastomaCancer Chemother Pharmacol20177951031104128393257
- ChakrabartiMRaySKAnti-tumor activities of luteolin and silibinin in glioblastoma cells: overexpression of miR-7-1-3p augmented luteolin and silibinin to inhibit autophagy and induce apoptosis in glioblastoma in vivoApoptosis201621331232826573275
- AnsonDMWilcoxRMHusemanEDLuteolin decreases epidermal growth factor receptor-mediated cell proliferation and induces apoptosis in glioblastoma cell linesBasic Clin Pharmacol Toxicol2018123667868629935053
- AllenMBjerkeMEdlundHNelanderSWestermarkBOrigin of the U87MG glioma cell line: good news and bad newsSci Transl Med20168354354re3
- ShaoNXueLWangRLuoKZhiFLanQmiR-454-3p is an exo-somal biomarker and functions as a tumor suppressor in gliomaMol Cancer Ther201918245946930413650
- SunDWZhangHDMaoLLuteolin inhibits breast cancer development and progression in vitro and in vivo by suppressing Notch signaling and regulating miRNAsCell Physiol Biochem20153751693171126545287
- YangPWLuZYPanQMicroRNA-6809-5p mediates luteolin-induced anticancer effects against hepatoma by targeting flotillin 1Phytomedicine2019571829
- DengDWangLChenYMicroRNA-124-3p regulates cell proliferation, invasion, apoptosis, and bioenergetics by targeting PIM1 in astrocytomaCancer Sci2016107789990727088547
- DengDXueLShaoNmiR-137 acts as a tumor suppressor in astrocytoma by targeting RASGRF1Tumour Biol20163733331334026440052
- ZhiFWangQDengDMiR-181b-5p downregulates NOVA1 to suppress proliferation, migration and invasion and promote apoptosis in astrocytomaPLoS One2014910e10912425299073
- LinYShiRWangXShenHMLuteolin, a flavonoid with potentials for cancer prevention and therapyCurr Cancer Drug Targets20088763464618991571
- TeocchiMAD’Souza-LiLApoptosis through death receptors in temporal lobe epilepsy-associated hippocampal sclerosisMediators Inflamm201620166112
- SartoriusUSchmitzIKrammerPHMolecular mechanisms of death-receptor-mediated apoptosisChembiochem200121202911828422
- BoularesAHYakovlevAGIvanovaVRole of poly(ADP-ribose) polymerase (PARP) cleavage in apoptosis Caspase 3-resistant PARP mutant increases rates of apoptosis in transfected cellsJ Biol Chem199927433229322294010438458
- SegerRKrebsEGWexlerSThe MAPK signaling cascadeFASEB J1995997267357601337
- PangHCaiLYangYChenXSuiGZhaoCKnockdown of osteo-pontin chemosensitizes MDA-MB-231 cells to cyclophosphamide by enhancing apoptosis through activating p38 MAPK pathwayCancer Biother Radiopharm201126216517321539449
- ChiuSJChaoJILeeYJHsuTSRegulation of gamma-H2AX and securin contribute to apoptosis by oxaliplatin via a p38 mitogen-activated protein kinase-dependent pathway in human colorectal cancer cellsToxicol Lett20081792637018499365
- ShinDYLeeWSLuJNInduction of apoptosis in human colon cancer HCT-116 cells by anthocyanins through suppression of Akt and activation of p38-MAPKInt J Oncol20093561499150419885574
- ChangLKarinMMammalian MAP kinase signalling cascadesNature20014106824374011242034
- BoutrosTChevetEMetrakosPMitogen-activated protein (MAP) kinase/MAP kinase phosphatase regulation: roles in cell growth, death, and cancerPharmacol Rev200860326131018922965
- WangXMartindaleJLHolbrookNJRequirement for ERK activation in cisplatin-induced apoptosisJ Biol Chem200027550394353944310993883
- XiaZDickensMRaingeaudJDavisRJGreenbergMEOpposing effects of ERK and JNK-p38 MAP kinases on apoptosisScience19952705240132613317481820
- SuiXKongNYeLp38 and JNK MAPK pathways control the balance of apoptosis and autophagy in response to chemotherapeutic agentsCancer Lett2014344217417924333738
- El-KhattoutiASelimovicDHaikelYHassanMCrosstalk between apoptosis and autophagy: molecular mechanisms and therapeutic strategies in cancerJ Cell Death20136375525278778
- ShvetsEFassEScherz-ShouvalRElazarZThe N-terminus and Phe52 residue of LC3 recruit p62/SQSTM1 into autophagosomesJ Cell Sci2008121162685269518653543
- LamyLNgoVNEmreNCTControl of autophagic cell death by caspase-10 in multiple myelomaCancer Cell201323443544923541952
- LuoYHWuSBWeiYHCadmium-based quantum dot induced autophagy formation for cell survival via oxidative stressChem Res Toxicol201326566267323617821
- CaoZZhangHCaiXLuteolin promotes cell apoptosis by inducing autophagy in hepatocellular carcinomaCell Physiol Biochem20174351803181229049999
- ZhangBYuXXiaHThe flavonoid luteolin enhances doxorubicin-induced autophagy in human osteosarcoma U2OS cellsInt J Clin Exp Med2015891519026629003
- YaoHZhouLTangLProtective effects of luteolin-7-O-glucoside against starvation-induced injury through upregulation of autophagy in H9c2 cellsBiosci Trends201711555756429033400
- ParkSHParkHSLeeJHInduction of endoplasmic reticulum stress-mediated apoptosis and non-canonical autophagy by luteolin in NCI-H460 lung carcinoma cellsFood Chem Toxicol201356210010923454208
- DengDWangLChenYMicroRNA-124-3p regulates cell proliferation, invasion, apoptosis, and bioenergetics by targeting PIM1 in astrocytomaCancer Sci2016107789990727088547