
Abstract
Background
Stanniocalcin 2 (STC2) is a glycoprotein hormone involved in many biological processes and a secretory protein that regulates malignant tumor progression. The aim of the present study was to further explore the clinicopathological significance and prognostic role of STC2 in colorectal cancer (CRC).
Methods
In this study, STC2 expression was first investigated in Gene Expression Omnibus and The Cancer Genome Atlas, and then validated with the data from our medical center. Univariate and multivariate analyses were performed to assess the association between prognostic factors and survival outcome.
Results
In Gene Expression Omnibus and The Cancer Genome Atlas databases, bioinformatics analysis confirmed that STC2 was significantly increased in CRC compared with that in normal tissues (P<0.01), and CRC patients with high STC2 expression had a shorter overall survival. By analyzing data from our medical center, the results also showed that STC2 expression of CRC tissues was higher than that in normal tissues, whether the transcriptional or protein levels. In the CRC tissues, high STC2 expression was significantly correlated with lymph node metastasis (P=0.047), distant metastasis (P=0.040), and advanced clinical stage (P=0.047). Moreover, Kaplan–Meier analyses indicated that high STC2 expression predicted a worse prognosis, and multivariate Cox regression analysis revealed that STC2 was an independent prognostic factor for overall survival (HR =1.976, 95% CI: 1.092–3.576, P=0.024) in patients with CRC.
Conclusion
Our results suggested that STC2 played an important role in CRC progression and prognosis, and could be a useful biomarker for survival prediction.
Introduction
Colorectal cancer (CRC) has been the fourth leading cause of cancer death worldwide for several decades.Citation1 The 5-year survival rate for localized stage CRC is 90%, whereas as CRC spreads to the regional lymph nodes or distant parts of the body, the 5-year survival rate plunges from 71% to 14%.Citation2 Although improvements in treatment protocols, including the discovery of targeted therapies, have substantially improved the clinical outcomes, most CRC patients fail treatment due to local recurrence and distant metastasis.Citation1 Therefore, predicting the risk of distant metastasis and poor prognosis is essential to improve clinical management of CRC. Unfortunately, most of the current medical standard tumor markers lack sensitivity and specificity for the detection of CRC. For the advances of the diagnostic methods, molecular-based diagnostics have been studied and proposed by many groups. Proteomic or genomic approach, based on profiling differentially expressed proteins or genes, has been used for novel biomarker discovery.Citation3–Citation5
We had analyzed differently expressed genes (DEGs) between CRC and paired adjacent normal tissues (PANT) by gene expression microarray and found high expression of the stanniocalcin 2 (STC2) gene in CRC.Citation6 STC2 is a glycoprotein hormone first known to be involved in calcium and phosphate homeostasis.Citation7–Citation9 In addition, STC2 was involved in glutamine or glucose deprivation, and it also had been found to be upregulated under hypoxia, endoplasmic reticulum stress, and radiation.Citation10–Citation13 Microenvironment characterized by hypoxia and low glucose and glutamine supply facilitated the process of solid tumors. STC2 overexpression contributes to tumor cells’ adaptation to such stress conditions, thus promoting tumor progression.Citation10 Recent studies demonstrated that STC2 expression was upregulated in various tumors, including lung cancer,Citation14 breast cancer,Citation15 hepatocellular carcinoma,Citation16 gastric cancer,Citation17 esophageal carcinoma,Citation18 and nasopharyngeal carcinoma.Citation19 Clinical and pathological studies reveal that STC2 overexpression correlates with advanced tumor grade, tumor invasiveness, metastasis, and poor prognosis.Citation16–Citation19 On the other hand, STC2 expression was also upregulated in breast cancer patients; however, the prognosis for these cases was good.Citation20,Citation21 The clinical significance of STC2 in cancer is disputed and depends on cancer type. Furthermore, clinicopathological significance of STC2 gene expression in CRC had been reported in 2009.Citation22 However, its clinical significance and molecular mechanism in carcinogenesis are still not completely understood. Therefore, to further explore the precise role of STC2 for CRC diagnosis and prognosis is essential.
In order to draw a solid conclusion, we first studied STC2 expression in the publicly available Gene Expression Omnibus (GEO) and The Cancer Genome Atlas (TCGA) databases, and then validated it with the data from our medical center. We evaluated the expression of STC2 in several CRC specimens and investigated its association with clinicopathological parameters and overall survival (OS).
Materials and methods
Microarray data processing
The microarray datasets of CRC, including GSE21510, GSE32323, GSE39582, and GSE41328, were downloaded from the public GEO databases (http://www.ncbi.nlm.nih. gov/geo/). Robust Multichip Average, an algorithm used to create an expression matrix from Affymetrix data, was used to adjust the raw files of background. Median levels of transcript expressions were calculated. Gene-level data were then filtered to include only those probe sets with annotations. Probe set annotation mainly reference the new version annotation files that can be download on Affymetrix official website (http://www.affymetrix.com/support/technical/byproduct.affx).
Differentially expressed genes mining
The limma package (http://bioconductor.org/packages/ release/bioc/html/limma.html) was used for selection of DEGs.Citation23 The limma package was a correct and popular method for gene selection through differential expression analyses of microarray. Genes that met the cutoff criteria of adjusted P<0.01 and |log2fold change (FC)| ≥2.0 were screened out as DEGs. Among DEGs, STC2 gene was highly expressed in CRC tissues, similar to the result of our microarray data.Citation6 Based on the previous research foundation, the STC2 gene would be further explored.
Validation and survival analysis
To further validate our results, we employed the TCGA database. Expression of the STC2 mRNA in CRC tissues and normal tissues was compared. Kaplan–Meier plotting data of OS of patients with CRC were generated. The patients were classified into high and low STC2 expression groups according to the median STC2 expression level.
Tissue collection
All tissues were acquired from patients who had been diagnosed with CRC by pathological assessment and undergone surgeries at the Zhongnan Hospital of Wuhan University. The study was approved by the Research Ethics Committee of Zhongnan Hospital of Wuhan University. All patients had been adequately informed and written consent was obtained. This was conducted in accordance with the Declaration of Helsinki.
Six CRC tissues and PANT (distance to cancer >5 cm), obtained from patients after surgery between June 2012 and November 2012, made into tissue microarray.Citation6 None of the patients received preoperative radiotherapy or chemotherapy. One-hundred fifteen CRC paraffin-embedded tissues were obtained from the Department of Pathology. The patients received surgical treatment between January 2014 and May 2015 with complete clinicopathological and prognostic information. STC2 protein expression was assessed in these tissues using immunohistochemical staining. Follow-ups were terminated by August 2018.
Immunohistochemical staining
Immunohistochemistry (IHC) of the tissues was performed as described previously.Citation24 Briefly, deparaffinized sections were pretreated with 10 mM sodium citrate buffer for antigen unmasking (pH 6.0, boiling temperature, 30 minutes), blocked in normal serum, incubated with primary antibody of STC2 (1:100, ab63057; Abcam, Cambridge, UK) at 4°C overnight, rinsed, and incubated with secondary antibody (MaxVision™ HRP-Polymer IHC Kit, Maixin-Bio, Fuzhou, China). Signals were amplified using the kit per the manufacturer’s instructions. The positive brown staining was visualized and then photographed using a light microscope at 200× magnification (BX51; Olympus Corporation, Tokyo, Japan).
The IHC evaluation was performed by two independent observers (Xiang Ma and Xiang Shu, the co-authors) who were blinded to the clinical and pathological characteristics associated with the specimens. The extent of STC2 staining was scored by a semiquantitative method in which staining of >10% of the tumor cells was considered positive. The staining intensity was scored as 0 (negative,−), 1 (weak positive, +), 2 (moderated positive, ++), and 3 (strong positive, +++). For analysis, the STC2 protein expression levels were divided into two groups: low expression level (score value <2) and high expression level (score value ≥2).
Western blot
Western blot was completed as described formerly.Citation25 Total protein was extracted with cell lysis buffer (Beyotime, Shanghai, China), and the protein concentration was quantified using an Enhanced BCA Protein Assay Kit (Beyotime). Protein was separated by 10% SDS-PAGE and transferred by semidry electroblotting to polyvinylidene difluoride membranes (Millipore, Billerica, MA, USA). The membrane was blocked for 1 hour with 5% BSA in TBS-T, and probed with corresponding primary antibodies overnight at 4°C, followed by incubation with rabbit or mouse horseradish peroxidase-coupled secondary antibodies for 1 hour. Specific bands were detected using Clarity™ Western ECL Substrate (Bio-Rad, Richmond, CA, USA) on an autoradiographic film. The primary antibodies used were as follows: anti-STC2 (Abcam) and anti-GAPDH (Proteintech, Wuhan, China).
Quantitative real-time polymerase chain reaction
RNA extraction and quantitative real-time polymerase chain reaction (qRT-PCR) were carried out as previously described.Citation25 Total RNA was isolated using RNA plus reagent (Vazyme, Nanjing, China). Complementary DNA was prepared using oligodT primers according to the protocol supplied with the HiScript II Q RT SuperMix for qPCR (Vazyme). Expression of STC2 was determined by qRT-PCR using AceQqPCR SYBR Green Master Mix (Vazyme). Oligonucleotide sequences of the primer sets used were as follows: STC2 forward (5′-TGAAATGTAAGGCCCACGCT-3′) and reverse (5′-CGAGGTGCAGAAGCTCAAGA-3′) and ACTIN forward (5′-CACCCAGCACAATGAAGATCAAGAT-3′) and reverse (5′-CCAGTTTTTAAATCCTGAGTCAAGC-3′).
Statistical analyses
R 3.5.0 was used for microarray analysis. Statistical analyses were performed with the IBM SPSS 22.0 statistical software package (IBM Inc.). The relationship between STC2 expression and clinicopathological features was analyzed using the Chi-square tests. Kaplan–Meier survival curves were constructed, and the log-rank test was carried out using univariate analysis. Multivariate analysis was performed using Cox’s proportional hazards model. P<0.05 was considered statistically significant.
Results
Microarray datasets
The mRNA expression profile datasets, GSE21510, GSE32323, GSE39582, and GSE41328, were generated using the GPL570 microarray platform. One hundred thirty-two samples, consisting of 69 normal tissues and 63 CRC tissues, were employed (Table S1).
Differentially expressed genes
Using R 3.5.0, we identified 1,627, 1,236, 1,607, and 762 DEGs between CRC and normal tissues from the GSE21510, GSE32323, GSE39582, and GSE41328 datasets, respectively (P<0.01, and S1). We found that 381 genes were differentially expressed in all four datasets (). Among the DEGs, STC2 gene was highly expressed in CRC tissue, similar to the result of our microarray data (). Based on the previous research foundation, the STC2 gene underwent further evaluation.Citation6
Figure 1 Increase of STC2 expression in GEO and TCGA databases in CRC.
Notes: (A) DEGs in CRC vs normal tissues across each independent dataset. Each column represents a sample and each row represents the expression level of a given mRNA. The color scale represents the raw Z score ranging from blue (low expression) to red (high expression). (B) Venn diagrams of overlapping DEGs between GSE21510, GSE32323, GSE39582, and GSE41328. (C) Analysis of STC2 expression in unpaired CRC (N=349) and normal tissues (N=41) in TCGA (P<0.001). (D) Analysis of STC2 expression in CRC and PANT (N=41) in TCGA (P<0.001). (E) High STC2 expression was associated with poor OS in CRC patients in TCGA.
Abbreviations: CRC, colorectal cancer; DEGs, differently expressed genes; GEO, Gene Expression Omnibus; OS, overall survival; PANT, paired adjacent normal tissues; STC2, stanniocalcin 2; TCGA, The Cancer Genome Atlas.
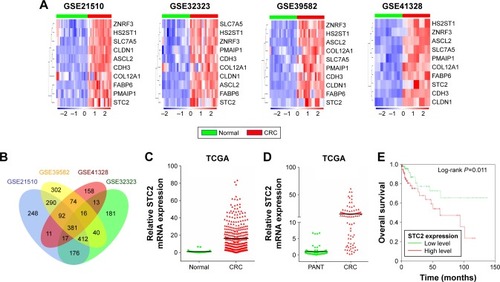
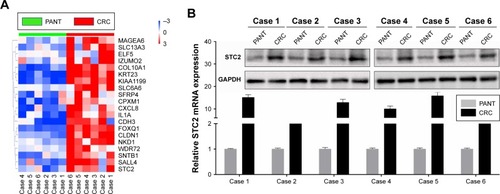
Figure 2 High expression of STC2 validated by our own database in CRC.
Notes: (A) DEGs in six pairs of CRC and PANT. (B) STC2 protein and mRNA levels were measured in CRC and PANT by Western blotting and qRT-PCR, respectively.
Abbreviations: CRC, colorectal cancer; DEGs, differently expressed genes; PANT, paired adjacent normal tissues; qRT-PCR, quantitative real-time polymerase chain reaction; STC2, stanniocalcin 2.
Validation and survival analyses
To evaluate the expression of STC2 in CRC, we further analyzed STC2 expression in TCGA datasets. The mRNA level of STC2 in the CRC tissues (N=349) and normal tissues (N=41) from TCGA showed that STC2 mRNA expression was significantly upregulated in cancer tissues (P<0.001, ). Meanwhile, in 41 paired tissues, the expression of STC2 mRNA was dramatically higher in cancer tissues than that in the PANT (P<0.001, ). To further investigate whether the deregulated STC2 correlates with the survivals of the CRC patients, we performed Kaplan–Meier and Cox’s proportional hazards regression model analysis, and found that high STC2 was significantly correlated with poor OS (; ).
Table 1 Univariate and multivariate analyses of clinicopathological characteristics and STC2 with overall survival in TCGA
STC2 is overexpressed in colorectal cancer
As STC2 showed a consistent pattern of overexpression in GEO and TCGA datasets, our next research direction was to explore the expression pattern of STC2 in the CRC patients of our medical center. In six pairs of specimens, microarray data showed that STC2 gene was significantly upregulated in CRC tissues (). STC2 protein expression was also obviously increased in CRC tissues as determined by Western blot (). Similarly, according to the results of qRT-PCR, STC2 mRNA expression was significantly upregulated in CRC tissues, compared with that in the PANT ().
Associations of STC2 expression with clinicopathological parameters in CRC
The expression of STC2 protein in archived CRC tissue samples was detected by IHC assay. We firstly evaluated STC2 protein expression in 15 pairs of CRC tissues and PANT. STC2 protein was mainly distributed in the cytoplasm and partially in the nucleus. The protein expression of STC2 was significantly increased in CRC compared with that in PANT tissues ().
Figure 3 Detection of STC2 protein expression in tissues by IHC staining, and high STC2 expression in tumors predicted poor prognosis in CRC patients.
Notes: (A) Representative images of STC2 protein expression in CRC and PANT. STC2 protein expression was significantly increased in tumor specimens compared with PANT. (B) IHC staining of STC2 protein in CRC tissues. The staining intensity was scored as 0 (negative), 1 (weak positive), 2 (moderated positive), and 3 (strong positive). (C) High expression of STC2 had a worse OS for CRC patients.
Abbreviations: CRC, colorectal cancer; IHC, immunohistochemistry; OS, overall survival; PANT, paired adjacent normal tissues; STC2, stanniocalcin 2.
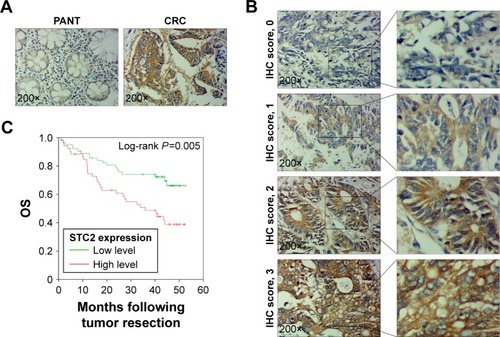
The association of STC2 expression and clinicopathological features including outcome was analyzed in 115 cases of CRC patients in our medical center. Of the 115 CRC patients, 28 patients (24.35%) had negative STC2 staining (IHC score, 0), 35 patients (30.43%) had weak staining (IHC score, 1), 39 patients (33.91%) had moderated staining (IHC score, 2), and 13 patients (10.43%) had strong staining (IHC score, 3; ). Negative and weak stainings were defined as low STC2 expression, whereas moderate and strong stainings were defined as high STC2 expression. The correlations between STC2 expression level and clinicopathological features of CRC were calculated by the chi-squared test and are summarized in . As shown in , high STC2 expression in CRC tissues was significantly correlated with lymph node metastasis (P=0.047), distant metastasis (P=0.040), and clinical stage (P=0.047). However, there were no statistically significant relationships between STC2 expression and other clinicopathological variables, such as gender (P=0.595), age (P=0.932), tumor location (P=0.136), tumor size (P=0.105), serum CEA (P=0.904), and tumor infiltration (P=0.205).
Table 2 Correlations between STC2 expression level and clinicopathological variables of 115 CRC patients
High STC2 expression indicated a worse prognosis in colorectal cancer
For all the study subjects, the follow-up period ranged from 1 to 52 months, with a median survival time of 42.8 months. The OS rate was 53.0%, and in patients with high STC2 expression level and those with low level, it was 38.5% and 65.1%, respectively. Additionally, Kaplan–Meier and Cox’s proportional hazards regression model survival analysis revealed that CRC patients with high STC2 expression had a shorter OS ().
To determine whether STC2 expression was an independent prognostic predictor for CRC patients, univariate and multivariate analyses were performed to compare the impact of STC2 expression and other clinicopathological factors on the prognosis. Univariate analysis revealed that clinical variables, including vascular invasion (HR =2.311, 95% CI: 1.302–4.100, P=0.004), lymphatic invasion (HR =1.876, 95% CI: 1.054–3.341, P=0.033), lymph node metastasis (HR =2.391, 95% CI: 1.337–4.275, P=0.003), distant metastasis (HR =5.057, 95% CI: 2.647–9.662, P<0.001), clinical stage (HR =3.015, 95% CI: 1.650–5.508, P<0.001), and STC2 (HR =2.273, 95% CI: 1.278–4.042, P=0.005), were significantly associated with OS of CRC patients (). Furthermore, in multivariate Cox regression analysis, only distant metastasis (HR =3.742, 95% CI: 1.633–8.575, P=0.002) and STC2 expression (HR =1.976, 95% CI: 1.092–3.576, P=0.024) were independent prognostic factors for CRC (). The high expression of STC2 had been consistently observed in the CRC patients with poor OS, indicating that STC2 may be functionally important in CRC pathogenesis.
Table 3 Univariate and multivariate analyses of clinicopathological characteristics and STC2 with overall survival in 115 CRC patients
Discussion
CRC local recurrence and distant metastasis leads to the death of 50,260 patients annually in the United States in 2017.Citation1 Therefore, it is critical to distinguish the high risk of recurrence and metastasis to improve the survival of patients with CRC. Based on our previous microarray data, we identified that STC2 could be a potential new biomarker to diagnose and evaluate prognosis of CRC patients in the present study, which represented the association of STC2 expression with clinicopathological features and prognosis in CRC. By analyzing the data from the GEO and TCGA databases, we confirmed that STC2 mRNA level was significantly upregulated in CRC tissues compared with that in normal tissues. The data from our medical center also demonstrated a higher STC2 level in CRC tissue. Similar to the cellular location of STC2 in other types of carcinoma, STC2 protein was located mainly in the cytoplasm and partially in the nucleus. Additionally, STC2 expression was significantly correlated with lymph node metastasis, distant metastasis, and clinical stage. Moreover, high STC2 expression was associated with worse prognosis in patients undergoing surgery for CRC. These findings suggested that STC2 may be involved in CRC progression, and serve as a useful predictor of prognosis.
STC2 belongs to stanniocalcin gene family, which is a family of secreted glycoprotein hormones that was initially discovered in the corpuscles of stannius, an endocrine gland of bony fish.Citation26,Citation27 STC2 and its homologues STC1, are reported to be involved in calcium and phosphate homeostasis, metabolism, reproduction, stress response, and development.Citation27,Citation28 The human STC2 gene encoding 302 amino acid long protein is widely expressed in the kidney, heart, pancreas, and spleen.Citation29 Emerging evidence has revealed abnormal expression of STC2 in tumor tissues, which might be used as a new biomarker to evaluate prognosis of patients with malignant tumors.Citation16–Citation19,Citation30,Citation31 Previous studies have reported that elevated expression of STC2 in gastric cancer tissues was significantly correlated with depth of tumor invasion, lymph node metastasis, venous invasion, and clinical stage, and predicted a worse outcome.Citation17,Citation32 Similarly, aberrant STC2 expression was also correlated with advanced tumor progression in esophageal squamous-cell cancer, hepatocellular carcinoma, nasopharyngeal cancer, lung cancer, and ovarian cancer.Citation14,Citation18,Citation19,Citation33,Citation34 Ieta et al reported that high STC2 expression in CRC tissue was significantly associated with lymph node metastasis, lymphatic invasion, tumor depth, clinical stage, and worse OS.Citation22 Compared with this study, our study employed 596 CRC samples, 132 from GEO, 349 from TCGA, and 115 from our medical center. We accessed more cases from the public database. Furthermore, we first identified STC2 gene was highly expressed in CRC than in normal tissue and high STC2 in cancer tissue was significantly correlated with poor OS by bioinformatics analysis. Subsequently, data from our medical center further confirmed this result. More cases and secondary validation ensured the reliability of our results. Hence, we proved that STC2 may serve as a useful prognosis biomarker in CRC patients.
The impact of STC2 on malignant biological properties has been preliminarily studied. It is reported that knockdown of STC2 in H460 lung cancer cells suppressed growth, migration, invasion, and G0/G1 cell cycle progression, and attenuated the H2O2-induced oxidative stress on cell viability with a subsequent increase in intracellular ROS levels.Citation14 In ovarian cancer, overexpressed STC2 promoted epithelial– mesenchymal transition, as revealed by the increase of N-cadherin/vimentin but a decrease of E-cadherin levels, and enhanced degree of invasiveness under hypoxic condition, mediated by increasing MMP2 and MMP9 expressions and activating ERK1/2 levels.Citation13 Mechanistically, STC2 could trigger the activation of MMP2, Mus81, PI3K/AKT/Snail, and MAPK signaling pathway in neuroblastoma, hepatocellular carcinoma, head and neck squamous cell carcinoma, and cervical cancer.Citation16,Citation35–Citation37 Interestingly, STC2 acts as an oncogene in many kinds of cancers, but it has been reported to be a polite gene in breast cancer. Studies had reported that STC2 overexpression could suppresses breast cancer cell migration and invasion via the PKC/Claudin-1-mediated signaling, and be associated with favorable prognosis, particularly ER-positive breast cancers.Citation21,Citation38 ER-positive breast cancers are usually low-grade malignancies and can be effectively treated with hormonotherapy, which may explain the good prognosis.Citation39,Citation40 Moreover, STC2 could promote growth and migration under hypoxic conditions, and stimulate P-glycoprotein via the PI3K/Akt signaling pathway to influence oxaliplatin resistance in CRC.Citation41,Citation42 There is little research paper for the molecular mechanism of STC2 on CRC behaviors. Therefore, future studies need to elucidate the molecular mechanisms of STC2 in CRC.
Conclusion
Our results revealed that STC2 is an independent prognostic factor for OS in CRC patients. High STC2 expression is strongly correlated with lymph node metastasis, distant metastasis, advanced clinical stage, and worse clinical outcome. Our findings suggested that STC2 could be a potential new biomarker to diagnose and evaluate prognosis of patients with CRC.
Author contributions
CZ and SC contributed equally to this work. CZ, SC, WX, MF, and BX were responsible for conception and design of the study. CZ, SC, QY, and FS did the experiments, data collection, statistical analyses, and writing of the manuscript. XM and XS participated in data collection and provided statistical expertise. All authors contributed to data analysis, drafting and revising the article, gave final approval of the version to be published, and agree to be accountable for all aspects of the work.
Acknowledgments
This work was supported by the National Natural Science Foundation of China (81072152, 81770283), Natural Science Foundation of Hubei Province (2015CFA027), Research Foundation of Health and Family Planning Commission of Hubei Province (WJ2015MA010, WJ2017M249), and Clinical Medical Research Center of Peritoneal Cancer of Wuhan (2015060911020462).
Supplementary materials
Figure S1 Differentially expressed genes in CRC vs normal tissues across each independent dataset. Each column represents a sample and each row represents the expression level of a given mRNA. The color scale represents the raw Z score ranging from blue (low expression) to red (high expression).
Abbreviation: CRC, colorectal cancer.
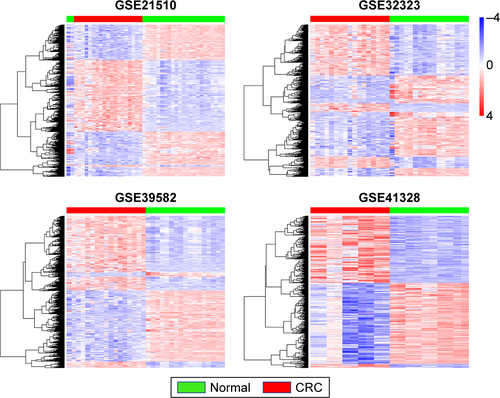
Table S1 Microarray datasets of mRNA expression profiles
References
- TsukamotoSIshikawaTIidaSClinical significance of osteoprotegerin expression in human colorectal cancerClin Cancer Res20111782444245021270110
- KhamasAIshikawaTShimokawaKScreening for epigenetically masked genes in colorectal cancer Using 5-Aza-2′-deoxycytidine, microarray and gene expression profileCancer Genom Proteom2012926775
- MarisaLReynièsADDuvalAGene expression classification of colon cancer into molecular subtypes: characterization, validation, and prognostic valuePLoS Med2013105e100145323700391
- LinGHeXJiHReproducibility probability score – incorporating measurement variability across laboratories for gene selectionNat Biotechnol200624121476147717160039
Disclosure
The authors report no conflicts of interest in this work.
References
- SiegelRLMillerKDFedewaSAColorectal cancer statistics, 2017CA Cancer J Clin201767317719328248415
- SiegelRLMillerKDJemalACancer statistics, 2018CA Cancer J Clin201868173029313949
- KulasingamVDiamandisEPStrategies for discovering novel cancer biomarkers through utilization of emerging technologiesNat Clin Pract Oncol200851058859918695711
- MakridakisMVlahouASecretome proteomics for discovery of cancer biomarkersJ Proteomics201073122291230520637910
- AlnabulsiAMurrayGIProteomics for early detection of colorectal cancer: recent updatesExpert Rev Proteomics2018151556329064727
- YangQFengMMaXLiHXieWGene expression profile comparison between colorectal cancer and adjacent normal tissuesOncol Lett20171456071607829113248
- FlikGLabedzTNeelissenJAHanssenRGBongaSWPangPKTRainbow trout corpuscles of Stannius: stanniocalcin synthesis in vitroAm J Physiol Regul Integr Comp Physiol19902585R1157R1164
- LuMWagnerGFRenfroJLStanniocalcin stimulates phosphate reabsorption by flounder renal proximal tubule in primary cultureAm J Physiol Regul Integr Comp Physiol19942675R1356R1362
- WagnerGFJaworskiEMHaddadMStanniocalcin in the seawater salmon: structure, function, and regulationAm J Physiol Regul Integr Comp Physiol19982744R1177R1185
- QieSLiangDYinCGlutamine depletion and glucose depletion trigger growth inhibition via distinctive gene expression reprogrammingCell Cycle201211193679369022935705
- ItoDWalkerJRThompsonCSCharacterization of stanniocalcin 2, a novel target of the mammalian unfolded protein response with cytoprotective propertiesMol Cell Biol200424219456946915485913
- LawAYSWongCKCStanniocalcin-2 is a HIF-1 target gene that promotes cell proliferation in hypoxiaExp Cell Res2010316346647619786016
- LawAYWongCKStanniocalcin-2 promotes epithelial-mesenchymal transition and invasiveness in hypoxic human ovarian cancer cellsExp Cell Res2010316203425343420619259
- NaSAldonzaMBSungHJStanniocalcin-2 (STC2): a potential lung cancer biomarker promotes lung cancer metastasis and progressionBiochem Biophys Acta20151854666867625463045
- BourasTSoutheyMCChangACStanniocalcin 2 is an estrogen-responsive gene coexpressed with the estrogen receptor in human breast cancerCancer Res20026251289129511888893
- WuFLiTYSuSCSTC2 as a novel mediator for Mus81-dependent proliferation and survival in hepatocellular carcinomaCancer Lett201738817718627939696
- YokoboriTMimoriKIshiiHClinical significance of stanniocalcin 2 as a prognostic marker in gastric cancerAnn Surg Oncol201017102601260720422456
- KitaYMimoriKIwatsukiMSTC2: a predictive marker for lymph node metastasis in esophageal squamous-cell carcinomaAnn Surg Oncol201118126127220734150
- LinSGuoQWenJSurvival analyses correlate stanniocalcin 2 overexpression to poor prognosis of nasopharyngeal carcinomasJ Exp Clin Cancer Res20143312624606961
- EsseghirSKennedyASeedharPIdentification of NTN4, Tra1, and STC2 as prognostic markers in breast cancer in a screen for signal sequence encoding proteinsClin Cancer Res200713113164317317545519
- ToddJRRyallKAVyseSSystematic analysis of tumour cell-extracellular matrix adhesion identifies independent prognostic factors in breast cancerOncotarget2016739629396295327556857
- IetaKTanakaFYokoboriTClinicopathological significance of stanniocalcin 2 gene expression in colorectal cancerInt J Cancer2009125492693119415750
- RitchieMEPhipsonBWuDLimma powers differential expression analyses for RNA-sequencing and microarray studiesNucleic Acids Res2015437e4725605792
- TongZYangXOYanHA protective role by interleukin-17F in colon tumorigenesisPLoS One201274e3495922509371
- SunMSongHWangSIntegrated analysis identifies microRNA-195 as a suppressor of Hippo-YAP pathway in colorectal cancerJ Hematol Oncol20171017928356122
- SterbaTWagnerGFSchroedterICFriesenHGIn situ detection and distribution of stanniocalcin mRNA in the corpuscles of Stannius of sockeye salmon, Oncorhynchus nerkaMol Cell Endocrinol19939021791858495799
- YeungBHLawAYWongCKEvolution and roles of stanniocalcinMol Cell Endocrinol2012349227228022115958
- HondaSKashiwagiMOokataKTojoAHiroseSRegulation by 1α,25-dihydroxyvitamin D3 of expression of stanniocalcin messages in the rat kidney and ovaryFEBS Lett1999459111912210508929
- ChangACJellinekDAReddelRRMammalian stanniocalcins and cancerEndocr Relat Cancer200310335937314503913
- ZhouHLiYYZhangWQLinDZhangWMDongWDExpression of stanniocalcin-1 and stanniocalcin-2 in laryngeal squamous cell carcinoma and correlations with clinical and pathological parametersPLoS One201494e9546624743310
- ShenXJGuKShiJPYaoJQWuJCIncreased expression of stanniocalcin 2 is associated with tumor progression after radiotherapy in patients with cervical carcinomaInt J Clin Exp Pathol2014712877025674244
- ArigamiTUenosonoYIshigamiSClinical significance of stanniocalcin 2 expression as a predictor of tumor progression in gastric cancerOncol Rep20133062838284424100594
- WangHWuKSunYSTC2 is upregulated in hepatocellular carcinoma and promotes cell proliferation and migration in vitroBMB Rep2012451162963423187001
- WuJLaiMShaoCWangJWeiJJSTC2 overexpression mediated by HMGA2 is a biomarker for aggressiveness of high-grade serous ovarian cancerOncol Rep20153431494150226165228
- VollandSKuglerWSchweigererLWiltingJBeckerJStanniocalcin 2 promotes invasion and is associated with metastatic stages in neuroblastomaInt J Cancer200912592049205719582875
- YangSJiQChangBSTC2 promotes head and neck squamous cell carcinoma metastasis through modulating the PI3K/AKT/Snail signalingOncotarget2017845976599127863406
- WangYGaoYChengHYangGTanWStanniocalcin 2 promotes cell proliferation and cisplatin resistance in cervical cancerBiochem Biophys Res Commun2015466336236826361149
- HouJWangZXuHStanniocalcin 2 suppresses breast cancer cell migration and invasion via the PKC/claudin-1-mediated signalingPLoS One2015104e012217925830567
- KaufmannMMorrowMvon MinckwitzGHarrisJRBiedenkopf Expert Panel Members. Locoregional treatment of primary breast cancer: consensus recommendations from an international expert panelCancer201011651184119120087962
- LeeSParkIHParkSMeeting highlights: the second consensus conference for breast cancer treatment in KoreaJ Breast Cancer201720322823328970847
- MiyazakiSKikuchiHIinoIAnti-VEGF antibody therapy induces tumor hypoxia and stanniocalcin 2 expression and potentiates growth of human colon cancer xenograftsInt J Cancer2014135229530724375080
- YuanQZhanLZhangLLStanniocalcin 2 induces oxaliplatin resistance in colorectal cancer cells by upregulating P-glycoproteinCan J Physiol Pharmacol201694992993527245421