Abstract
Despite significant progress made in the overall cure rate, the prognosis for relapsed and refractory malignancies in children remains extremely poor. Hence, there is an urgent need for studies that enable the timely selection of appropriate agents for Phase I clinical studies. The Pediatric Oncology Experimental Therapeutics Investigators’ Consortium (POETIC) is systematically evaluating libraries of known and novel compounds for activity against subsets of high-risk pediatric malignancies with defined molecular aberrations for future clinical development. In this report, we describe the in-vitro activity of a diverse panel of approved oncology drugs against MLL-rearranged pediatric leukemia cell lines. Agents in the Approved Oncology Drug Set II (National Cancer Institute/National Institutes of Health Developmental Therapeutics Program) were evaluated by in-vitro cytotoxicity assays in pediatric acute lymphoblastic leukemia and acute myeloid leukemia cell lines with MLL gene rearrangements. Validation studies were carried out with patient leukemia cells in culture. Comparative analysis for toxicity against nonmalignant cells was evaluated in normal bone marrow stromal cells and normal human lymphocytes. Results from this study show that 42 of the 89 agents tested have measurable cytotoxicity against leukemia cells, and among these, 12 were effective against all five MLL-rearranged cell lines (IC50 [half maximal inhibitory concentration] < 1 μM). These 12 agents include cladribine, dactinomycin, daunorubicin, docetaxel, etoposide, gemcitabine, mitomycin C, mitoxantrone, teniposide, topotecan, triethylenemelamine, and vinblastine. We show that the Approved Oncology Drug Set II contains a number of agents with potent antileukemic activity in the tested cell lines. As approved drugs, these agents have been used in clinical settings for many years for other malignancies, thus their toxicity profile, pharmacokinetics, and other properties are readily available. Further evaluation of their use in future clinical trials for pediatric leukemia with MLL abnormalities should be considered.
Keywords:
Introduction
Survival rates for acute lymphoblastic leukemia (ALL) have increased dramatically over the last 20 years. Up to 80% of children diagnosed with ALL can be cured with the current treatment regimens.Citation1 The improvement in cure rate is due to systematic clinical trials with risk stratification of patients during treatment, the institution of intrathecal therapy, the intensification of treatment with existing drugs, and the identification of better and combinations of chemotherapeutics.Citation2 However, the remaining 20% of pediatric patients with leukemia have very poor outcomes with current treatment strategies; these patients often have relapsed or refractory leukemias with distinct molecular abnormalities that categorize them as high-risk. Citation3 The identification of effective therapeutic strategies for these high-risk subgroups remains an important goal for improving survival rates in children with leukemia.
Rearrangement of chromosome band 11q23 at the MLL gene (mixed-lineage-leukemia) is common and associated with a particularly poor prognosis for all pediatric age groups presenting with ALL.Citation4 The most aggressive forms of MLL-rearranged ALL involve balanced translocations at t(4;11), t(11;19), or t(9;11).Citation4,Citation5 MLL gene rearrangements occur in 80% of children with ALL diagnosed before 1 year of age.Citation2,Citation6,Citation7 The t(4;11) or t(11;19) translocations are the most common 11q23 abnormality in infants.Citation5 These patients are most often categorized as high- or very high-risk and often experience early treatment failure.Citation5–Citation8 The presence of any MLL-rearrangement is associated with a significantly poorer prognosis for infants compared with patients whose leukemias possess germ line MLL.Citation5–Citation7 This also holds true for children who are 1–9 years of age; the presence of t(4;11) or t(9;11) translocations is associated with a poor prognosis compared with other 11q23 abnormalities, such as deletion of 11q23 or different translocations,Citation5 or compared with patients with germ line MLL.Citation4,Citation6 MLL gene rearrangements also occur in up to 20% of acute myeloid leukemia (AML) cases and, in general, portend a poor outcome.Citation9,Citation10
Currently, intense strategies such as stem-cell transplantation are needed to treat MLL-rearranged acute leukemias, and the outcome still remains poor. Hence, novel therapeutic approaches are urgently needed to improve the outcome in these patients.Citation11 Cell lines derived from leukemia specimens have been instrumental in advancing current knowledge and treatment options in a number of hematological malignancies. Drexler and colleagues have described the utility of cell lines as experimental models for the study of MLL gene alterations. Citation12 It has been hypothesized that such cell lines will help to understand the role of the MLL genetic aberration on the pathogenic process of the disease and will enable the effective identification of agents on a proximate model of the human disease.Citation12 The Pediatric Oncology Experimental Therapeutics Investigators’ Consortium (POETIC) has established a program to screen cell lines that represent functionally crucial molecular alterations with relevance to currently difficult to cure pediatric malignancies for the purpose of designing future clinical trials. These studies are aimed to provide initial preclinical data to identify drugs with potential that can be further evaluated in mechanistic, drug combination and xenograft studies to facilitate timely development of Phase I studies. In this manuscript, we describe the evaluation of current and novel chemotherapeutic agents using drug panels provided by the National Cancer Institute/National Institutes of Health (NCI/NIH) Developmental Therapeutics Program (DTP). In comparison to currently used chemotherapeutic agents, this screen resulted in the identification of many active agents not typically used in the treatment of pediatric leukemia, providing important data for further studies.
Methods
Tissue culture and cell lines
All cell lines were maintained in OptiMEM I Reduced Serum Media (31985-070, Invitrogen, Carlsbad, CA), supplemented with 10% fetal calf serum and 100 units/mL each of penicillin and streptomycin. Cells were incubated at 37°C with 5% CO2 buffering. Characteristics of the cell lines are shown in .
Table 1 Characteristics of human leukemia cell lines
Reagents
The Approved Oncology Drug Set II was obtained from the NCI/NIH DTP Open Chemical Repository.Citation13 All agents were solubilized in dimethylsulfoxide (DMSO) (D5879, Sigma Aldrich, Oakville, ON, Canada) at 10 mM stock concentration and stored at −20°C.
Drug screen
The Approved Oncology Drug Set II was screened using KOPN8, SEM, B1, MOLT-3, and TIB-202 cell lines at 10.00, 1.00, 0.10, and 0.01 μM concentrations in duplicate wells of 96-well plates (655180, Greiner Bio-One, Monroe, NC). Control wells contained an equivalent amount of DMSO. Cells were plated at 5 × 10³ cells/well in the presence of drug treatment and incubated at 37°C with 5% CO2 buffering. After 96 hours, cell numbers were measured by direct cell counting with brightfield analysis using the Celigo™ cytometerCitation14 (Cyntellect Inc, San Diego, CA). Validity of the single round of screening was confirmed by random selection of 11 drugs from the Approved Oncology Drug Set II. These were re-screened as above. The repeated samples closely confirmed the half maximal inhibitory concentration (IC50) values calculated from the first round of screening.
Cell survival assays
A subset of drugs from the Approved Oncology Drug Set II was selected for follow-up analysis. Criteria for selection of these drugs included an IC50 < 1 μM in four cell lines and limited use in current pediatric leukemia treatment protocols. Methotrexate (MTX) and cytarabine (AraC) were also included for comparison. Cells were treated with the drugs as described above, except that triplicate wells were used with 1:10 serial dilutions ranging from 10 μM down to 1 × 10⁻¹⁰ μM. After 96 hours, viable cell numbers were measured by direct cell counting using the Celigo cytometer. Additionally, cell numbers were measured at 24, 48, 72, and 96-hour time points using the Celigo cytometer. The survival percentage was calculated by comparing the number of viable cells in treated wells to control (DMSO)-treated wells.
Normal human samples
Bone marrow stromal (BMS) cells were isolated as previously describedCitation15 and used to evaluate the drug effects on nonleukemic cells. Normal human lymphocytes (NHL) were isolated by Ficoll gradient from whole blood of a healthy volunteer. Cells were treated with the selected Approved Oncology Drug Set II as described above, except that duplicate wells were used with 1:10 serial dilutions ranging from 10 μM down to 1 × 10⁻⁶ μM. The characteristics of the NHL and BMS (small size and very flat, respectively) prevented the software for the Celigo cytometer from directly counting these samples. Instead, 5 μL of alamarBlue® (DAL1100, Invitrogen) was added to each well after 96 hours. The cells were incubated an additional 24 hours and then measured at 570 nm and 620 nm using an Opsys MR™ plate reader (Dynex Technologies, Chantilly, VA). Viability data from the alamarBlue assay closely agrees with direct counting by Celigo (Supplemental Figure 1).
Patient samples
Leukemia cells were obtained from samples collected for new therapies for pediatric leukemia research (DC study) following local Institutional Review Board approval and parental consent. Leukemia cells were collected from a 3-month-old male diagnosed with precursor B-ALL (patient 17577; t(11;19) (q23;p13)), an 8-month-old male with precursor B-ALL (patient 87781; t(11;19)(q23;p13)), and a 5-year-old male with T-ALL (patient 41304). Details of the treatment and leukemia cell isolation procedures for patient 17577 are described elsewhere.Citation16 Isolation procedures for patients 87781 and 41304 were the same as for patient 17577. Patient cells were treated with the selected drugs from the Approved Oncology Drug Set II as described for the BMS cells, except that after 96 hours, cells were counted using the Celigo cytometer.
Calculations and software
All IC50 values were calculated using Microsoft Excel® for Mac 2008 (version 12.2.6) (Microsoft Corporation, Redmond, WA). Heat maps were generated using Mayday computer software (version 1.0).Citation17
Rationale for model leukemia cell lines
Five different cell lines, all harboring MLL-gene rearrangements () were tested. The validity of using these cell lines to represent patient samples is confirmed by previous literature where gene expression profiles of ALL cell lines were compared with ALL patient samples.Citation18 ALL cell lines and patient samples with MLL gene rearrangements clustered closely together, demonstrating that cell lines display gene expression profiles comparable to patient samples.Citation18 The distinguishing feature of cell lines compared with patient samples was higher levels of proliferation-related genes in the cell lines.Citation18 In addition, other gene expression studies have shown that patient samples with MLL gene rearrangements cluster together, further suggesting the similarities of leukemias of this subset.Citation19–Citation22 This similar separation of MLL-rearranged subsets was also seen in AML.Citation23 Based upon these previous reports, we performed in-vitro drug screening on the ALL and AML cell lines using the Approved Oncology Drug Set II.
Results
In-vitro activity of microtubule-interfering drugs
All five leukemia cell lines were initially screened with the entire Approved Oncology Drug Set II, which includes most current United States Food and Drug Administration (FDA)-approved anticancer drugs. For clarity, we have categorized these drugs into the following groups: microtubule-interfering drugs, nucleic acid-targeting drugs, enzyme-inhibitory drugs, receptor- or immuno-modulatory drugs, and miscellaneous drugs.
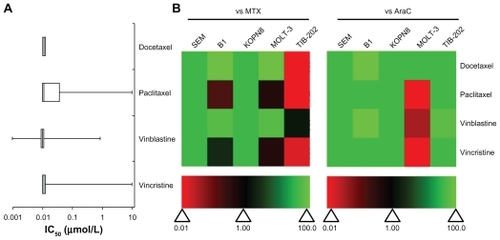
Drugs that both stabilized and destabilized microtubules had high activity against most of the leukemia cell lines (). Studies have shown that the preclinical activity of a drug is correlated to higher Phase II overall response rates of that drug.Citation23 This means that the greater the potency of a drug (ie, cytotoxicity at low concentrations), the stronger the predictive value for success in Phase II trials.Citation24 High activity is defined as having an IC50 less than 1 μM, which indicates the clinical potential for the drug to effectively inhibit leukemia cell growth at low doses and with few side effects in patients. In TIB-202, KOPN8, SEM, and B1 cells, the IC50 values for all four microtubule-interfering drugs (docetaxel, paclitaxel, vinblastine, and vincristine) were less than 0.1 μM ( and Supplemental Table 1). In the T-ALL cell line MOLT-3, there was greater variation in the activity of these microtubule-interfering drugs: paclitaxel and vincristine had no effect (IC50 = 10 μM), whereas docetaxel (IC50 < 0.01 μM) and vinblastine (IC50 = 0.851 μM) were more cytotoxic (Supplemental Table 1). The activity of each drug was compared with MTX or AraC, which are commonly used as therapeutics for pediatric leukemia, by calculating the ratio of the IC50 of MTX or AraC to the IC50 of each drug, within one cell line. The ratios were plotted as a heat map, wherein green indicates higher activity compared with MTX or AraC, and red indicates lower activity. illustrates the variable sensitivity of MOLT-3 to different microtubule-interfering drugs, and highlights the overall potency of these drugs in the leukemia cells tested. In general, the microtubule-interfering drugs had higher activity than MTX and AraC, although in TIB-202 cells, these drugs were not better than MTX.
Figure 1 IC50 and relative effectiveness of microtubule-interfering drugs. (A) The IC50 (μmol/L) from five leukemia cell lines are shown in a box-whisker plot. For each drug treatment, the vertical lines in each box represent the 25th, 50th, and 75th percentiles, and the horizontal lines represent the minimum and maximum values. IC50 values above or below the tested concentration ranges were rounded to the highest or lowest concentration tested, respectively. (B) Heat map of drug effectiveness compared with MTX or AraC. Values are a ratio of the IC50 of MTX or AraC to the IC50 of each drug. Green, black, and red represent superior, equivalent, and inferior activity, respectively, to MTX or AraC.
In-vitro activity of nucleic acid targeting drugs
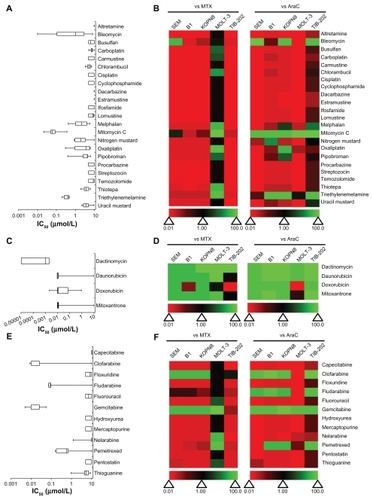
The leukemia cell lines were treated with nucleic acid targeting drugs that were further categorized as deoxyribonucleic acid (DNA) damaging agents, DNA intercalating agents or nucleic acid synthesis inhibitors ( and Supplemental Table 1). None of the DNA damaging agents was particularly active in more than one cell line, as seen by the dominant red coloring of the heat maps (). Mitomycin C, bleomycin, and triethylenemelamine showed moderate activity in some cell lines. Mitomycin C had an IC50 value less than 0.5 μM in all cell lines ( and Supplemental Table 1). In contrast, all of the DNA intercalating agents (mitoxantrone, daunorubicin, doxorubicin, and dactinomycin) had high activity for inhibiting the growth of leukemia cell lines and were, in general, more active than MTX and AraC (); the IC50 for the majority of these agents was <0.01 μM ( and Supplemental Table 1). Drugs that inhibit nucleic acid synthesis had a wide range of activity against the leukemia cell lines tested. Most of these drugs had little activity, with IC50 values above the tested concentration range (IC50 > 10 μM) (). The exceptions were clofarabine (IC50 < 0.1 μM for four of five cell lines), fludarabine (IC50 < 1 μM for four of five cell lines), pemetrexed (IC50 < 1 μM for four of five cell lines), and gemcitabine (IC50 < 0.05 μM). Additionally, clofarabine and gemcitabine were more active than MTX and AraC in the respective cell lines ().
Figure 2 IC50 and relative effectiveness of nucleic-acid targeting drugs. (A and B) DNA damaging agents. (C and D) DNA intercalating agents. (E and F) Nucleic acid synthesis inhibitors. (A, C and E) The IC50 (μmol/L) from five leukemia cell lines are shown in a box-whisker plot. (B, D and F) Heat map of drug effectiveness compared with MTX or AraC. Values are a ratio of the IC50 of MTX or AraC to the IC50 of each drug. Green, black, and red represent superior, equivalent, and inferior activity, respectively, to MTX or AraC.
In-vitro activity of enzyme-inhibitory drugs
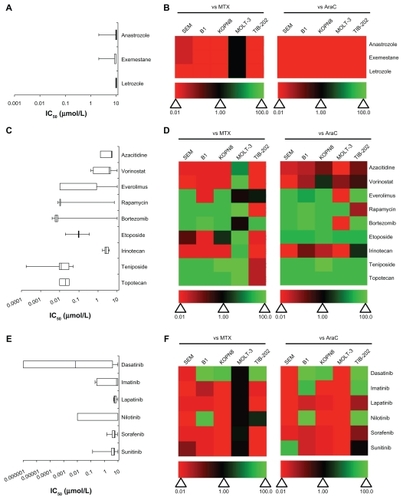
A variety of enzyme-inhibitory drugs from the Approved Oncology Drug Set II were used to treat the leukemia cell lines. These drugs were further categorized based on their enzymatic targets: aromatase, DNA methyltransferase, histone deacetylase, mammalian target of rapamycin (mTOR), proteasome, topoisomerases, or tyrosine kinases ( and Supplemental Table 1). Aromatase inhibitors had little effect on the leukemia cell lines. Not only were the IC50 values around 10 μM (), they were less cytotoxic than MTX and AraC (). The DNA methyltransferase inhibitor azacitidine and the histone deacetylase inhibitor vorinostat had weak activity in most of the cell lines (). However, vorinostat had slightly better activity compared with AraC in KOPN8 and both had superior activity compared with MTX in MOLT-3 (). In contrast, the mTOR inhibitors (everolimus, rapamycin), proteasome inhibitor (bortezomib), and topoisomerase inhibitors (topotecan, etoposide, teniposide) were more potent at inhibiting the leukemia cell lines (). Irinotecan was the exception, which demonstrated lower activity compared with MTX or AraC (). Everolimus, rapamycin, and bortezomib showed greater variation in IC50 between cell lines (); however, most of the drugs in these categories were more active than MTX and AraC (). The tyrosine kinase inhibitors appeared to have more cell-specific effects, rather than global effects like some other chemotherapeutic agents (). For example, dasatinib, imatinib, and nilotinib showed large variation in the IC50 values between the cell lines (). Overall, this category of drugs was less active than MTX and AraC, with some exceptions including dasatinib (). Lapatinib, sorafenib, and sunitinib had limited potency and were less cytotoxic compared with MTX and AraC ().
Figure 3 IC50 and relative effectiveness of enzyme inhibitory drugs. (A and B) Aromatase inhibitors. (C and D) DNA methyltransferase, histone deacetylase, mTOR, proteasome, and topoisomase inhibitors. (E and F) Tyrosine kinase inhibitors. (A, C and E) The IC50 (μmol/L) from five leukemia cell lines are shown in a box-whisker plot. (B, D and F) Heat map of drug effectiveness compared with MTX or AraC. Values are a ratio of the IC50 of MTX or AraC to the IC50 of each drug. Green, black, and red represent superior, equivalent, and inferior activity, respectively, to MTX or AraC.
In-vitro activity of receptoror immuno-modulatory drugs
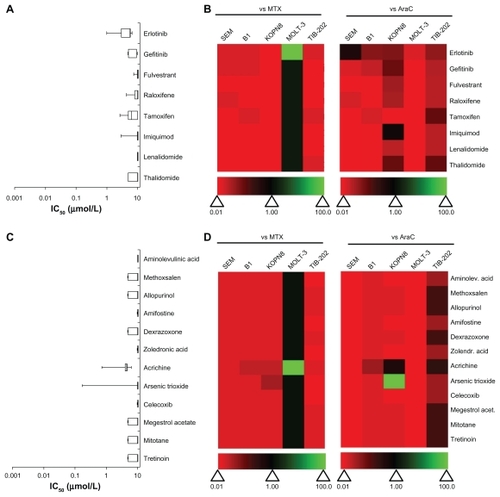
Drugs that modulate receptors (epidermal growth factor receptor, estrogen receptor) or the immune response were tested in all five leukemia cell lines (). These drugs had little effect on leukemia cell lines, with IC50 values ~10 μM ( and Supplemental Table 1). All of these drugs had less activity compared with MTX and AraC, with the exception of MOLT-3 cells, in which these drugs performed equivalently, and erlotinib, which was more active in MOLT-3 cells only ().
Figure 4 IC50 and relative effectiveness of receptor-modulatory, immuno-modulatory and miscellaneous drugs. (A and B) Receptor- and immuno-modulatory drugs. (C and D) Miscellaneous drugs. (A and C) The IC50 (μmol/L) from five leukemia cell lines are shown in a box-whisker plot. (B and D) Heat map of drug effectiveness compared with MTX or AraC. Values are a ratio of the IC50 of MTX or AraC to the IC50 of each drug. Green, black, and red represent superior, equivalent, and inferior activity, respectively, to MTX or AraC.
In-vitro activity of miscellaneous drugs
A number of drugs from the Approved Oncology Drug Set II that are photo-activated, protective adjuvants or have miscellaneous function were tested in the leukemia cell lines (). None of the photo-activated agents or the protective adjuvant drugs had any effect on leukemia cell survival rates (IC50 = 10 μM) ( and Supplemental Table 1). Only two drugs in the miscellaneous category, arsenic trioxide and acrichine, had any activity for inhibiting leukemia cell growth. These drugs were cytotoxic only in KOPN8 cells, with IC50 values equal to 0.169 μM and 0.722 μM, respectively (). However, none of these drugs showed higher cytotoxicity compared with MTX or AraC in more than one cell line ().
In-vitro activity of selected candidate drugs in leukemia cell lines
To investigate the possibility that drugs from the Approved Oncology Drug Set II could be translated into therapies for MLL-rearranged leukemias, we focused on a subset of drugs from the Approved Oncology Drug Set II for in-depth study. These drugs were included in the initial screen of the Approved Oncology Drug Set II, and were selected due to early indications of potency and diversity of mechanism of action. Additionally, we included in the analyses two drugs commonly used in pediatric oncology (MTX and AraC) for comparison with the selected drugs. The selected drugs were cladribine (nucleic acid synthesis inhibitor), decitabine (DNA methyltransferase inhibitor), ixabepilone (microtubule stabilizer), plicamycin (DNA intercalating agent), valrubicin (DNA intercalating agent and PKC inhibitor), and vinorelbine (microtubule destabilizer). The mean IC50 (± standard error) for each drug in SEM, B1, KOPN8, MOLT-3, and TIB-202 cell lines were calculated from two to four experiments with two or three replicate wells per experiment ().
Table 2 Mean IC50 values after incubation with selected drugs from the Approved Oncology Drug Set II
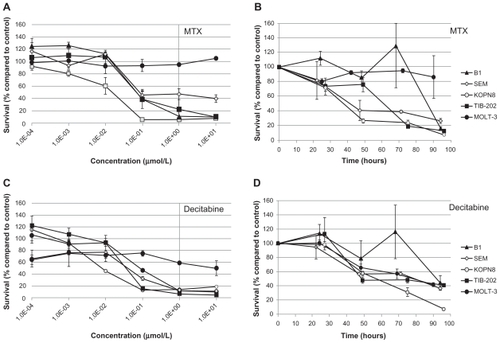
All of the selected candidate drugs showed significant cytotoxic activity against the leukemia cells lines, although several were less active in MOLT-3 cells than the other four cell lines (). As was seen for microtubule-interfering drugs (), both vinorelbine () and ixabepilone () were effective at inhibiting the growth of the leukemia cell lines at low doses. The IC50 values were less than 0.425 μM for all the cell lines except MOLT-3, which was resistant to both of these drugs (IC50 > 10 μM) (). The nucleic acid-related drugs cladribine (), plicamycin (), valrubicin (), and AraC () all showed cytotoxicity against leukemia cells. All cell lines tested were sensitive to cladribine, including MOLT-3; however, TIB-202 cells were not sensitive to AraC, and MOLT-3 cells were not sensitive to plicamycin and valrubicin (). Decitabine () exhibited the greatest variation in activity across the cell lines: KOPN8 cells were the most sensitive (0.00842 μM), followed by B1 cells (0.233 μM), MOLT-3 cells (0.319 μM), and TIB-202 cells (0.513 μM). However, SEM cells appeared to be refractory to this drug (IC50 > 10 μM) ().
Figure 5 Dose response and growth curves of selected microtubule-interfering drugs. Leukemia cell lines were incubated with vinorelbine (A and B) or ixabepilone (C and D). (A and C) Cells were incubated with varying concentrations of drugs and assessed after 96 hours for survival compared with DMSO-treated cells. (B and D) Cells were incubated with 1 μM of drug and assessed every 24 hours for cell survival compared with DMSO-treated cells.
Abbreviation: DMSO, dimethylsulfoxide.
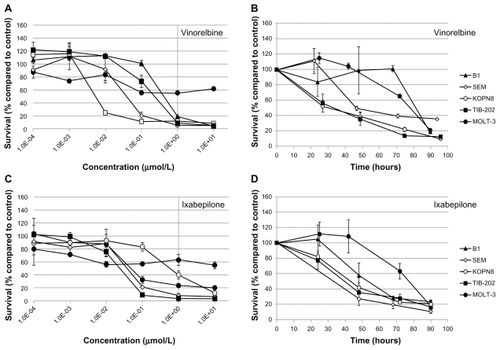
Figure 6 Dose response and growth curves of selected nucleic acid-related drugs. Leukemia cell lines were incubated with cladribine (A and B), plicamycin (C and D), valrubicin (E and F), or AraC (G and H). (A, C, E and G) Cells were incubated with varying concentrations of drugs and assessed after 96 hours for survival compared with control DMSO-treated cells. (B, D, F and H) Cells were incubated with 1 μM of drug and assessed every 24 hours for cell survival compared with control DMSO-treated cells.
Abbreviations: AraC, cytarabine; DMSO, dimethylsulfoxide.
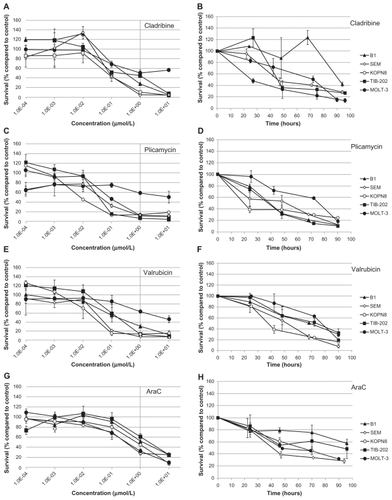
Figure 7 Dose response and growth curves of selected enzyme-inhibitory drugs. Leukemia cell lines were incubated with MTX (A and B) or decitabine (C and D). (A and C) Cells were incubated with varying concentrations of drugs and assessed after 96 hours for survival compared with control DMSO-treated cells. (B and D) Cells were incubated with 1 μM of drug and assessed every 24 hours for cell survival compared with control DMSO-treated cells.
Abbreviations: DMSO, dimethylsulfoxide; MTX, methotrexate.
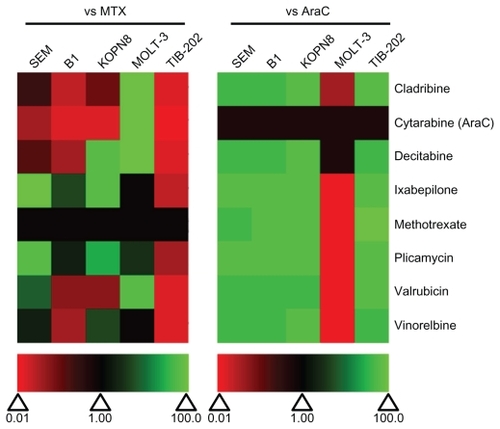
We compared the IC50 of each selected drug to MTX and AraC (). All of the drugs showed superior activity compared with AraC in all cell lines except MOLT-3 cells. Plicamycin and ixabepilone showed the greatest degree of cytotoxicity compared with MTX in four out of five cell lines (ie, IC50 values were lower than or equivalent to the IC50 of MTX). Vinorelbine was more active than MTX in three of the cell lines, and decitabine and valrubicin were more active than both MTX in two of the cell lines (). Cladribine was less active than MTX in all but one cell line (MOLT-3). All of the selected drugs were less potent than MTX in TIB-202 cells, which showed good sensitivity to MTX alone ( and ).
Figure 8 Relative effectiveness of selected drugs from the Approved Oncology Drug Set II on leukemia cell lines. Heat map of drug effectiveness compared with MTX or AraC. Values are a ratio of the IC50 of MTX or AraC to the IC50 of each drug. Green, black, and red represent superior, equivalent, and inferior activity, respectively, to MTX or AraC.
Leukemia cell growth rates in the presence of selected candidate drugs
To further characterize the impact of the selected candidate drugs on leukemia cells, we monitored leukemia cell growth over time in the presence of the drugs. As suggested by the IC50 values of the microtubule-interfering drugs, vinorelbine () and ixabepilone () dramatically inhibited cell growth compared with control-treated cells. After 24 hours exposure to vinorelbine, KOPN8 and TIB-202 cells had half the viable cell numbers (52.3% and 56.3%, respectively) compared with control (). By 96 hours, these values dropped to 10.4% and 12.5% of control, respectively. MOLT-3 cells had a slower decrease in cell numbers, which reached as low as 20.9% by 90 hours. Ixabepilone decreased cell numbers down to 10.8%–23.5% of control numbers after 90 hours (). Similar trends in cell growth were seen for cladribine (), plicamycin (), valrubicin (), AraC (), MTX (), and decitabine ().
In-vitro activity of selected candidate drugs in patient cells
To determine off-target toxicity effects and the ability of the selected drugs to kill patient leukemia cells, the candidate drugs were also tested on normal bone marrow stromal (BMS) cells, NHL and leukemia cells from infants with MLL-rearranged ALL (). None of the tested drugs had any toxicity effects on NHL or BMS cells and were equivalent in potency as MTX and AraC (). Patient 17577 was quite sensitive to a number of the drugs in the selected panel (). Cladribine, ixabepilone, plicamycin, valrubicin, and vinorelbine all had IC50 values under 1 μM ( and ), and were more potent than both MTX and AraC (). Ixabepilone was particularly potent against cells from patient 17577, as cell survival dropped to only 32.9% of control-treated cells after 48 hours (). Plicamycin, cladribine, and valrubicin demonstrated similar decreases in cell survival (39.2%, 47.2%, and 46.8%, respectively) after 48 hours (). In contrast, patients 87781 and 41304 were less sensitive to all of the drugs, although some of the drugs did show better performance compared with MTX and AraC ().
Figure 9 Relative effectiveness of selected drugs from the Approved Oncology Drug Set II on normal and patient samples. Heat map of drug effectiveness compared with MTX or AraC. Values are a ratio of the IC50 of MTX or AraC to the IC50 of each drug. Green, black, and red represent superior, equivalent, and inferior activity, respectively, to MTX or AraC. 17577, 87781, and 41304 represent the patient samples.
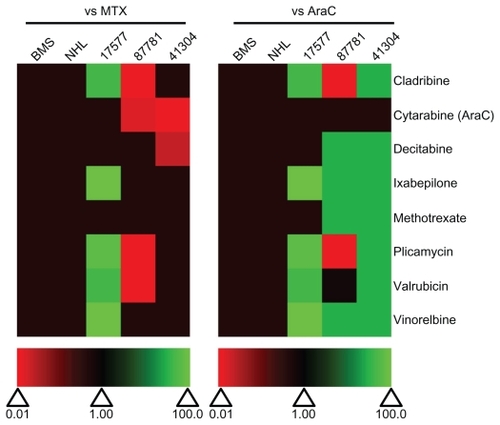
Figure 10 Dose response and growth curves of selected drugs with patient 17577 leukemia cells. Cells isolated from patient 17577 were incubated with the indicated drugs. (A and C) Cells were incubated with varying concentrations of drugs and assessed after 96 hours for survival compared with control DMSO-treated cells. (B and D) Cells were incubated with 1 μM of drug and assessed every 24 hours for cell survival compared with control DMSO-treated cells.
Abbreviations: AraC, cytarabin; DMSO, dimethylsulfoxide; MTX, methotrexate.
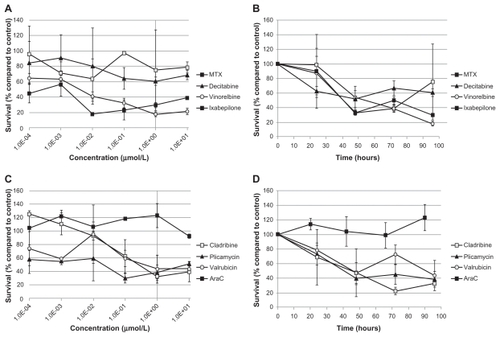
Table 3 IC50 values after incubation with selected drugs from the Approved Oncology Drug Set II
Discussion
These data suggest that a number of FDA-approved chemotherapeutic agents have considerable activity against MLL-rearranged ALL and AML cell lines and some patient samples. This paper forms part of key pre-clinical groundwork for analysis of these agents as therapy for MLL- rearranged leukemia. We suggest that the data found herein form a basis for considering new treatment options for patients with MLL-rearranged leukemia following therapy with standard regimens.
We have identified a number of categories of drugs, as well as specific drugs, that are cytotoxic to MLL-rearranged cell lines. These include microtubule-interfering drugs, DNA intercalating agents, topoisomerase poisons, mTOR inhibitors, and proteasome inhibitors. In addition to these categories of drugs, some specific agents, such as mitomycin C, gemcitabine, clofarabine, and dasatinib, showed better efficacy than MTX and AraC. Overall, 42 out of the 89 agents tested were potent in at least one leukemia cell line. A total of 12 and 15 of these were potent in five or four cell lines, respectively, with an IC50 less than 1 μM. The twelve agents that were potent in all five cell lines include cladribine, docetaxel, vinblastine, mitomycin C, triethylenemelamine, mitoxantrone, daunorubicin, dactinomycin, gemcitabine, topotecan, etoposide, and teniposide. Some of the drugs, such as cladribine, ixabepilone, valrubicin, plicamycin, and vinorelbine, also performed well in the MLL-rearranged patient sample. Overall, this suggests there are a number of agents within the Approved Oncology Drug Set II that could be further evaluated for future clinical trials for MLL-rearranged pediatric leukemia.
The most active drugs against the patient sample in this study were cladribine, ixabepilone, valrubicin, plicamycin, and vinorelbine. Cladribine has historically been used for treatment of hairy cell leukemia.Citation25 However, it has also been used to treat several refractory hematological malignancies, including AML.Citation26,Citation27 Complete and partial remission (CR and PR) rates were 27% and 32%, respectively, in pediatric AML patients pretreated with cladribine prior to induction therapy.Citation27 Combination therapy of cladribine with AraC in adult AML patients who had relapsed or failed to respond to initial therapy enhanced the effective dose of AraC in the blood by 40% in seven out of nine patients.Citation28 However, cladribine should be used cautiously in patients with renal dysfunction, as demonstrated by a case study of a pediatric AML patient treated with cladribine for 5 days.Citation29 These previous studies, along with the data in this paper, suggest some potential for cladribine during treatment of MLL-rearranged pediatric leukemia, as has been used anecdotally for a number of years, often when combined with etoposide.
The microtubule-interfering drugs produced promising results in this study. Vinorelbine, in combination with topotecan, thiotepa, dexamethasone, and gemcitabine, has been used to treat patients with relapsed or refractory acute leukemia.Citation30 In one study, 36% of pediatric patients achieved CR and 11% achieved PR on this regimen.Citation30 In another study, 37% of adult patients with refractory ALL achieved CR with a similar regimen.Citation31 Ixabepilone is a new generation microtubule stabilizer that has mainly been used for metastatic breast cancer therapy in patients with few treatment options.Citation32 It has also been used in a Phase II trial of patients with a variety of treatment- refractory sarcomas, malignant peripheral nerve sheath tumors, neuroblastoma, and Wilms tumors.Citation33 Considering the potency of the microtubule-interfering agents in this study and others,Citation34 and the prominent use of vincristine in current leukemia treatment protocols, vinorelbine and ixabepilone are reasonable candidates for further consideration in MLL-rearranged leukemias.
Valrubicin is a derivative of doxorubicin, an anthracyline antibiotic with DNA intercalation abilities. Valrubicin has only been used for treatment of bladder cancerCitation35 and topical application of developing skin tumors.Citation36 Although, not previously used in leukemia patients, the effectiveness of valrubicin in cell lines and the patient sample suggest it for further analysis as a new therapeutic for MLL-rearranged leukemia.
Some of the agents tested in these experiments have been used for leukemia or lymphoma treatment already, although they are not part of typical frontline treatment regimens. For example, decitabine has gained increasing attention in leukemia and myelodysplastic syndrome settings.Citation37,Citation38 In Phase II studies of decitabine in combination with clofarabine and low-dose AraC, 59% of elderly patients with AML achieved CR with manageable toxicity profiles.Citation39 In adult patients with refractory AML, CR was achieved in 34% of patients who received decitabine therapy.Citation40 POETIC is currently conducting a Phase I study of decitabine in combination with AraC, daunorubicin, and etoposide chemotherapy for newly diagnosed patients with AML. Plicamycin has also been used, in combination with interferon-α or hydroxyurea, to treat patients with chronic myeloid leukemia (CML) and myeloid blast crisis.Citation41 This treatment regimen has had limited success in CML or AML therapy. Three of thirteen patients with CML had PR or CR, while two became stabilized on treatment.Citation41 The median survival of these patients increased to 24 months from previously reported 6-month median survival.Citation41 A Phase II study of plicamycin and hydroxurea in patients with high-risk, relapsed, or refractory AML resulted in no patients with CR or PR, and considerable toxicity.Citation42 These data suggest some caution against selecting plicamycin for clinical trial evaluation in pediatric patients with MLL-rearranged leukemia.
In this report, we have attempted to identify agents that show effective in-vitro cytotoxicty against malignant cells and cell lines derived from patients with refractory leukemia. However, the spectrum of effective agents includes drugs that have acceptable toxicities, as well as those that carry the potential to induce molecular abnormalities with increased risk of secondary malignancies in the future. In deciding future clinical application of any selected agent, the benefit of inducing remission in a highly refractory malignancy should be carefully considered against the risk of such possibilities. Similarly, we have based their activity profiles largely on IC50 values. Although lower IC50 values are generally considered to suggest effectiveness against neoplastic cells, it does not necessarily mean it would be the most applicable clinically because of untested toxicity in the patient. Utilization of the information presented in this paper should take into consideration, particularly in heavily pretreated children, the potential adverse effects such as neurotoxicity, hepatotoxicity, and nephrotoxicity. Taken together, the results from this study highlight potential alternative therapeutic options for MLL-rearranged leukemias. The data presented herein demonstrate the need for further characterization of these drugs, either as single agents or in effective combination with novel targeted agents, for possible future clinical trials.
Acknowledgments
This work was supported by grants from the Kids Cancer Care Foundation of Alberta and the Alberta Children’s Hospital Foundation. RJA was funded in part through an endowed King Fahd Chair.
Supplementary material
Figure S1 Comparison of cell survival measurements by the Celigo™ cytometer and alamarBlue®. W1 leukemia cells were incubated with imatinib (A), gefitinib (B), sorafenib (C), or sunitinib (D) for 96 hours then measured using the Celigo cytometer, followed by alamarBlue. Survival compared with control DMSO-treated cells is shown, with data points and error bars representing the mean and standard error, respectively.
Abbreviation: DMSO, dimethylsulfoxide.
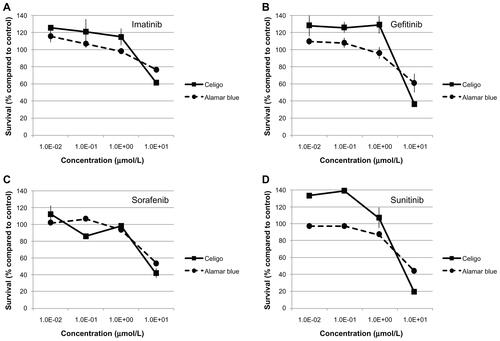
Table S1 IC50 values after incubation with drugs from the Approved Oncology Drug Set II
Disclosure
The authors have no conflicts of interest to declare.
References
- PuiC-HEvansWEAcute lymphoblastic leukemiaN Engl J Med19983396056159718381
- PietersRCarrollWLBiology and treatment of acute lymphoblastic leukemiaHematol Oncol Clin North Am20102411820113893
- BiondiACiminoGPietersRPuiC-HBiological and therapeutic aspects of infant leukemiaBlood200096243310891426
- BehmFGRaimondiSCFrestedtJLRearrangement of the MLL gene confers a poor prognosis in childhood acute lymphoblastic leukemia, regardless of presenting ageBlood199687287028778639906
- PuiC-HGaynonPSBoyettJMOutcome of treatment in childhood acute lymphoblastic leukaemia with rearrangements of the 11q23 chromosomal regionLancet20023591909191512057554
- ChenCSSorensenPHReamanGHMolecular rearrangements on chromosome 11q23 predominate in infant acute lymphoblastic leukemia and are associated with specific biologic variables and poor outcomesBlood199381238623938481519
- RubnitzJELinkMPShusterJJFrequency and prognostic significance of HRX rearrangements in infant acute lymphoblastic leukemia: a Pediatric Oncology Group studyBlood1994845705738025282
- HildenJMDinndorfPAMeerbaumSOAnalysis of prognostic factors of acute lymphoblastic leukemia in infants: report on CCG 1953 from the Children’s Oncology GroupBlood200610844145116556894
- RubnitzJEGibsonBSmithFOAcute myeloid leukemiaHematol Oncol Clin North Am201024356320113895
- MartensJHAStunnenbergHGThe molecular signature of oncofusion proteins in acute myeloid leukemiaFEBS Lett20105842662266920388510
- TamaiHInokuchiK11q23/MLL acute leukemia: update of clinical aspectsJ Clin Exp2010509198
- DrexlerHGQuentmeierHMacLeodRAMalignant hematopoietic cell lines: in vitro models for the study if MLL gene alterationsLeukemia20041822723214671638
- Development Therapeutics Program [homepage on the Internet]NCI/NIH Available from: http://dtp.cancer.govAccessed July 23, 2011
- NabzdykCSChunMPradhanLLoGerfoFWHigh throughput RNAi assay optimization using adherent cell cytometryJ Transl Med20119485621518450
- NarendranAGanjaviHMorsonNMutant p53 in bone marrow stromal cells increases VEGF expression and supports leukemia cell growthExp Hematol20033169370112901974
- JayanthanAIncoronatoASinghACytotoxicity, drug combinability, and biological correlates of ABT-737 against acute lymphoblastic leukemia cells with MLL rearrangementsPediatr Blood Cancer20115635336021225911
- BattkeFSymonsSNieseltKMayday – integrative analytics for expression dataBMC Bioinformatics20101112113020214778
- FineBMStanullaMSchrappeMGene expression patterns associated with recurrent chromosomal translocations in acute lymphoblastic leukemiaBlood20041031043104914525776
- ArmstrongSAStauntonJESilvermanLBMLL translocations specify a distinct gene expression profile that distinguishes a unique leukemiaNat Genet200230414711731795
- YeohE-JRossMEShurtleffSAClassification, subtype discovery, and prediction of outcome in pediatric acute lymphoblastic leukemia by gene expression profilingCancer Cell2002113314312086872
- RossMEZhouXSongGClassification of pediatric acute lymphoblastic leukemia by gene expression profilingBlood20031022951295912730115
- AnderssenAEdenPOlofssonTGene expression signatures in childhood acute leukemias are largely unique and distinct from those of normal tissues and other malignanciesBMC Med Genomics2010361420211010
- RossMEMahfouzROnciuMGene expression profiling of pediatric acute myelogenous leukemiaBlood20041043679368715226186
- Voskoglou-NomikosTPaterJLSeymourLClinical predictive value of the in vitro cell line, human xenograft, and mouse allograft preclinical cancer modelsClin Cancer Res200394227423914519650
- SigalDSMillerHJSchramEDSavenABeyond hairy cell: the activity of cladribine in other hematologic malignanciesBlood20101162884289620634380
- SantanaVMHurwitzCaBlakelyRLComplete hematologic remissions induced by 2-chlorodeoxyadenosine in children with newly diagnosed acute myeloid leukemiaBlood199484123712427914104
- SantanaVMMirroJJrKeamsCSchellMJCromWBlakleyRL2-chlorodeoxyadenosine produces a high rate of complete hematologic remission in relapsed acute myeloid leukemiaJ Clin Oncol1992103643701346800
- GandhiVEsteyEKeatingMJChucrallahAPlunkettWChlorodeoxyadenosine and arabinosylcytosine in patients with acute myelogenous leukemia: pharmacokinetic, pharmacodynamic, and molecular interactionsBlood1996872562648547650
- CrewsKRWimmerPSHudsonJQHowardSCRibeiroRCRazzoukBIPharmacokinetics of 2-chlorodeoxyadenosine in a child undergoing hemofiltration and hemodialysis for acute renal failureJ Pediat Hematol Onc200224677680
- KolbEASteinherzPGA new multidrug induction protocol with topotecan, vinorelbine, thiotepa, dexamethasone and gemcitabine for relapsed or refractory acute leukemiaLeukemia2003171967197214513046
- HiwarkarPArkenauH-TTreleavenJMorganGPotterMEthellMThe feasibility of using topotecan, vinorelbine, thiotepa and gemcitabine (TVTG) in adult patients with relapsed/refractory acute lymphoblastic leukaemia/lymphomaLeukemia2008221627162918305560
- EgertonNOptimizing ixabepilone treatment schedules in patients with advanced or metastatic breast cancerCancer Chemoth Pharm20106610051012
- JacobsSFoxEKrailoMPhase II trial of ixabepilone administered daily for five days in children and young adults with refractory solid tumors: a report from the Children’s Oncology GroupClin Cancer Res20101675075420068084
- KangMHSmithMAMortonCLKeshelavaNHoughtonPJReynoldsCPNational Cancer Institute pediatric preclinical testing program: model description for in vitro cytotoxicity testingPediatr Blood Cancer20115623924920922763
- LammDLMcGeeWRHaleKBladder cancer: current optimal intravesical treatmentUrol Nurs20052532333216294610
- AndersenSMRosadaCDagnaes-HansenFTopical application of valrubicin has a beneficial effect on developing skin tumorsCarcinogenesis2010311483149020554745
- RavandiFIssaJ-PGarcia-ManeroGSuperior outcome with hypomethylating therapy in patients with acute myeloid leukemia and high-risk myelodysplastic syndrome and chromosome 5 and 7 abnormalitiesCancer20091155746575119795507
- BryanJJabbourEPrescottHGarcia-ManeroGIssaJPKantarjianHCurrent and future management options for myelodysplastic syndromesDrugs2010701381139420614946
- ParikhSAHagopKGarcia-ManeroGClofarabine plus low-dose cytarabine induction followed by consolidation with clofarabine plus low-dose cytarabine alternating with decitabine as frontline therapy for patients (pts) with acute myeloid leukemia (AML) = 60 years (yrs)Blood2009114Abstract 2058
- RitchieEKArnasonJFeldmanEJDecitabine-based salvage therapy in adults with acute myeloid leukemiaBlood2009l114Abstract 2063
- DutcherJPColettiDPaiettaEWiernikPHA pilot study of alpha-interferon and plicamycin for accelerated phase of chronic myeloid leukemiaLeuk Res1997213753429225062
- ArchimbaudETroncyJSebbanCPhase II trial of plicamycin and hydroxyurea in acute myelogenous leukemiaCancer Chemoth Pharm198925223225
- GreilJGramatzkiMBurgerRThe acute lymphoblastic leukemia cell line SEM with t(4;11) chromosomal rearrangement is biphenotypic and responsive to interleukin-7Br J Haematol1994862752838199015
- CohenABrunbergerTVanekWConstitutive expression and role in growth regulation of interleukin-1 and multiple cytokine receptors in a biphenotypic leukemic cell lineBlood199178941021648979
- MatsuoYDrexlerHGEstablishment and characterization of human B cell precursor-leukemia cell linesLeuk Res1998225675799680106
- MinowadaJOhnumaTMooreGERosette-forming human lymphoid cell lines. I. Establishment and evidence for origin of thymus-derived lymphocytesJ Natl Cancer I197249891894
- TsuchiyaSYamabeMYamaguchiYKobayashiYKonnoTTadaKEstablishment and characterization of a human acute monocytic leukemia cell line (THP-1)Int J Cancer1980261711766970727
- AdatiNHuangM-CSuzukiTSuzukiHKojimaTHigh-resolution analysis of aberrant regions in autosomal chromosomes in human leukemia THP-1 cell lineBMC Res Notes2009215315919635138