
Abstract
Background
Gallbladder cancer (GBC) is the most common biliary tract malignant cancer worldwide. It has been reported that microRNA-575 (miR-575) was involved in the tumorigenesis of many cancers. However, the role of miR-575 during the progression of GBC remains largely unknown.
Methods
The expression of miR-575 in GBC cells was detected by quantitative real-time polymerase chain reaction. The proliferation of GBC cells was examined by CCK-8 assay and Ki-67 staining. Apoptosis of GBC cells was measured by flow cytometry, and cell invasion was tested by transwell assay. Moreover, protein expressions in GBC cells were evaluated using Western blot. The target gene of miR-575 was predicted using Targetscan and miRDB. Finally, xenograft tumor model was established to verify the function of miR-575 in GBC in vivo.
Results
Our findings indicated that miR-575 antagonist decreased the proliferation and invasion of GBC cells. In addition, miR-575 antagonist significantly induced apoptosis of GBC cells via inducing G1 arrest. Meanwhile, p27 Kip1 was found to be a direct target of miR-575 with luciferase reporter assay. Moreover, miR-575 antagonist significantly decreased the expressions of CDK1 and cyclin E1 and upregulated the levels of cleaved caspase3 and p27 Kip1 in GBC cells. Finally, miR-575 antagonist notably suppressed GBC tumor growth in vivo.
Conclusion
Downregulation of miR-575 significantly inhibited the tumorigenesis of GBC via targeting p27 Kip1. Thus, miR-575 might be a potential novel target for the treatment of GBC.
Keywords:
Introduction
Gallbladder cancer is the most common biliary tract malignant cancer worldwide.Citation1 Patients with GBC are always been diagnosed at an advanced stage due to the ignorance of early symptoms.Citation2 Nowadays, surgery or chemotherapy is regarded as the major treatment of GBC, while only 10% patients with GBC have good prognosis.Citation3 Moreover, large number of patients with GBC have suffered from severe side effects after chemotherapy and surgical operation.Citation4 Therefore, it is necessary to explore novel therapeutic methods for the treatment of GBC.
MicroRNAs (miRNAs) are endogenic noncoding small RNAs which are generous in body. Aberrant miRNA expression has found to be related with the progression of multiple diseases recently.Citation5 In addition, it has been confirmed that miRNAs play key roles in the tumorigenesis of malignancy.Citation6 MiR-575 is one of the miRNAs which has been firstly reported in 2009.Citation7 MiR-575 was involved in the progression of Kawasaki disease.Citation8 Meanwhile, a previous study has indicated that BH3-like motif-containing protein (BLID) was a direct target of miRNA-575 in the tumorigenesis of non-small cell lung cancer (NSCLC) in vitro,Citation9 indicating its key role during the progression of malignancies. Yao et al revealed that miR-575 together with the other miRNAs were significantly overexpressed in tumor tissues of patients with GC.Citation7 However, the role of miR-575 during the progression of GBC remains unclear.
Cyclin-dependent kinase (CDK) inhibitor p27 Kip1 was found to be a member of the CIP/KIP family.Citation10 In addition, p27 Kip1 has been mostly studied for its roles in inhibiting G1 progression and maintaining cell quiescence in response to anti-proliferative signals or terminal differentiation.Citation11–Citation13 It can be regarded that p27 Kip1 may act as an important regulator in the growth of malignant tumors by regulation of CDK2 and cyclin E1.Citation14 Besides, downregulation of p27 Kip1 has been regarded as an independent prognostic factor in GBC.Citation15 In the current study, we aimed to investigate the function of miR-575 during the tumorigenesis of GBC and explore the correction between miR-575 and p27 Kip1.
Materials and Methods
Cell Culture
GBC-SD and G415 cell lines were purchased from Cell Bank of the Chinese Academy of Science (Shanghai, China) and RIKEN Cell Engineering Division-Cell Bank (Tokyo, Japan), respectively. All GBC cells were cultured in Dulbecco’s Modified Eagle’s Medium (DMEM, Thermo Fisher Scientific) with 10% FBS (Thermo Fischer Scientific), 1% penicillin and streptomycin (Thermo Fisher Scientific) at 37°C, 5% CO2.
Quantitative Real-Time Polymerase Chain Reaction (qRT-PCR)
Total RNA was extracted from GBC-SD or G415 cell lines using TRIzol reagent (TaKaRa, Tokyo, Japan) according to the manufacturer’s protocol. cDNA was synthesized using the reverse transcription kit (TaKaRa, Ver.3.0). Real-Time qPCRs were performed in triplicate under the following protocol: 2 min at 94°C, followed by 35 cycles (30 s at 94°C and 45 s at 55°C). The primers for miR-575 and U6 were obtained from GeneCreate Biological Engineering Co., Ltd (Wuhan, China). miR-575: forward, 5ʹ-GTCCACCGCAAATGCTTCTA-3ʹ and reverse 5ʹ- CCATCAGTCCCGTCTTGAAAC-3ʹ. U6: forward, 5ʹ- CTCGCTTCGGCAGCACAT-3ʹ and reverse 5ʹ- AACGCTTCACGAATTTGCGT-3ʹ. The relative fold changes were calculated using the 2−ΔΔCt method by the formula: 2−(sample ΔCt – control ΔCt), where ΔCt is the difference between the amplification fluorescent thresholds of the gene of interest and the internal reference gene (U6) used for normalization.
MiR-575 Transfection
MiR-575 agonist, miR-575 antagonist, or negative control RNAs (all at 10 nM) were transfected into GBC cells using Lipofectamine 2000 (Invitrogen, Carlsbad, CA).Citation16 MiR-575 agonist, antagonist, and negative control RNAs were purchased from GenePharma (Shanghai, China). The sequences of miR-575 agonist/antagonist were as follows: miR-575 agonist, GAGCCAGUUGGACAGGAGC and miR-575 antagonist, CUCGGUCAACCUGUCCUCG.
CCK-8 Assay
GBC cells were seeded in 96-well plates (5×10³ per well) overnight. Then, cells were treated with negative control (NC) or miR-575 antagonist for 0, 24, 48, and 72 h, respectively. Ten microliters of CCK-8 reagent (Beyotime, Shanghai, China) were added to each well and further incubated for 2 h at 37°C. Finally, the absorbance of GBC cells was measured at 450 nm using a microplate reader (Thermo Fisher Scientific).
Immunofluorescence
GBC-SD cells were seeded in 24-well plates overnight. Then, cells were treated with NC or miR-575 antagonist for 72 h. Next, cells were blocked with 10% goat serum for 30 min at room temperature and then incubated with anti-Ki67 antibody (Abcam, Cambridge, MA, USA; 1:1000) at 4°C overnight, followed by incubation with goat anti-rabbit IgG (Abcam; 1:5000) at 37°C for 1 h. Then, the nuclei were stained with DAPI (Beyotime, Shanghai, China) for 5 min. Finally, cells were observed under a fluorescence microscope (Olympus CX23, Tokyo, Japan).
Cell Apoptosis Analysis
GBC-SD cells were trypsinized, washed with phosphate-buffered saline and resuspended in Annexin V Binding Buffer, followed by staining with 5 μL FITC and 5 μL propidium (PI) in the system for 15 min. Cells were analyzed using flow cytometer (BD, Franklin Lake, NJ, USA) to test the cell apoptosis rate.
Cell Cycle Detection
GBC-SD cells were treated with NC or miR-575 antagonist for 72 h, respectively. Then, the cell cycle distribution was detected by flow cytometry (BD) as previously described.Citation17 Briefly, cell cycle detection was performed using Cycletest Plus DNA Reagent Kit (BD, NJ, USA). GBC-SD cells were harvested by accutase treatment and counted with a hemocytometer. A total of 5×10⁵ cells were fixed, permeabilized, and stained in accordance with the manufacturers’ instructions, and the sample was analyzed by flow cytometry using a FACSCalibur measuring FL2 area versus total counts. The data were analyzed using ModFit (http://mycyte.org/) and FlowJo (http://mycyte.org/) softwares to generate the percentages of cells in G1, S, and G2 to M phases of the cell cycle.
Transwell Assay
For cell invasion analysis, transwell assay was performed in this study. The upper chamber is pre-treated with 100 μL of Matrigel. GBC-SD cells were seeded into the upper chamber in media with 1% FBS, and the density was adjusted to about 1.0×10⁶ cells per chamber. DMEM with 10% FBS was added in the lower chamber. After 48 h of incubation at 37°C, the non-invading cells in the upper chamber were removed with a cotton swab. Then, cells in the lower chamber were stained with 0.1% crystal violet and counted at 3 different fields under a microscope (LEICADMLB2, Frankfurt, Germany).
Western-Blot Detection
Total protein was isolated from tissue or cell lysates by using RIPA buffer and quantified by BCA protein assay kit (Beyotime, Shanghai, China). Proteins were resolved on 10% SDS-PAGE and transferred to PVDF (Bio-Rad) membranes. After blocking with 5% skim milk, the membranes were incubated with primary antibodies at 4°C overnight. Then, the membranes were incubated with secondary anti-rabbit antibody (Abcam; 1:5000) at room temperature for 1 h. After that, membranes were scanned by using an Odyssey Imaging System and analyzed with Odyssey v2.0 software (LICOR Biosciences, Lincoln, NE, USA). The primary antibodies used in this study: anti-CDK2 (Abcam, Cambridge, MA, USA; 1:1000), anti-cyclin E1 (Abcam; 1:1000), anti-p27 Kip1 (Abcam; 1:1000), anti-cleaved caspase3 (Abcam; 1:1000) and anti-β-actin (Abcam; 1:1000). β-actin was used as an internal control.
Luciferase Reporter Assay
MiR-575 targeted gene prediction was performed using 2 publicly available programs (miRDB and TargetScan). The results were selected for further analysis. Then, the wild type (wt) or mutate type (mt) of p27 3ʹ-UTR was built based on pmiRGLO vector (Promega, Fitchburg, WI, USA) and named as wt-p27 or mt-p27. Cells were co-transfected with synthetic miRNAs and wt or mt-p27 using Lipofectamine 2000. After 48 h of transfection, luciferase activity was measured using dual-luciferase reporter assay system (Promega).
In vivo Experiments
Eighteen BALB/c nude mice (6–8 weeks old) were purchased from Vital River (Beijing, China). The mice were housed within a dedicated SPF facility (six mice per group). GBC-SD cells were subcutaneously transplanted into mouse according to the previous reference.Citation18 When the tumor volume reached about 150 mm3, vector-control or miR-575 antagonist (50 nM) was injected intra-tumor twice weekly. The tumor volume was measured weekly according to the formula: Length×Width×Width/2.Citation19 At the end of the experiments, mice were sacrificed and the tumors were collected and weighted. All in vivo experiments were performed in accordance with National Institutes of Health guide for the care and use of laboratory animals, following a protocol approved by the Ethics Committees of Clinical Medical College, Jiangsu Vocational College of Medicine (No. 20190516030).
Statistical Analysis
Each group were performed at least three independent experiments and all data were expressed as the mean ± standard deviation (SD). Differences were analyzed using Student’s t-test (only 2 groups) or one-way analysis of variance (ANOVA) followed by Tukey’s test (more than 2 groups, Graphpad Prism7). P<0.05 was considered to indicate a statistically significant difference.
Results
Downregulation of miR-575 Promoted the Proliferation of GBC Cells
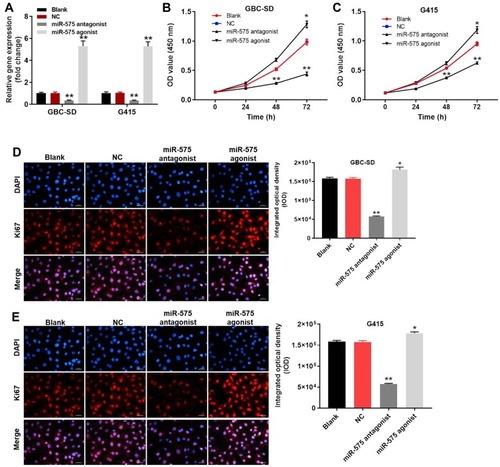
To detect the efficacy of transfections, the expressions of miR-575 in GBC cells were measured with qRT-PCR. As indicated in , the level of miR-575 in GBC cells was significantly increased in the presence of miR-575 agonist. In contrast, miR-575 antagonist notably downregulated the expression of miR-575 in GBC cells. This data revealed that GBC cells were stably transfected with miR-575 agonist or antagonist. Next, to explore the role of miR-575 during the tumorigenesis of GBC, CCK-8 assay was performed. As revealed in , the OD value of GBC cells was significantly decreased by miR-575 antagonist but increased in the presence of miR-575 agonist. In Ki-67 immunofluorescence assay, downregulation of miR-575 obviously inhibited the proliferation ability of GBC cells compared with control. However, overexpression of miR-575 significantly promoted the proliferation of GBC cells (). Thus, these results revealed that downregulation of miR-575 could inhibit the proliferation of GBC cells, while upregulation of miR-575 exhibited the opposite effect.
Figure 1 Downregulation of miR-575 significantly upregulated the proliferation of GBC cells. GBC-SD or G415 cells were transfected with miR-575 agonist, miR-575 antagonist, negative control (NC) or nothing (Blank) for 24 h. (A) The expression of miR-575 in GBC-SD or G415 cells was detected by using qRT-PCR. (B) After 0, 24, 48, or 72 h of incubation, the OD value of GBC-SD cells was determined using CCK-8 assay. (C) After 0, 24, 48, or 72 h of incubation, the OD value of G415 cells was determined using CCK-8 assay. (D) After 48 h of incubation, the expression of Ki-67 in GBC-SD cells was detected by immunofluorescence staining. The expression of Ki-67 in GBC-SD cells was quantified by integrated optical density (IOD). (E) After 48 h of incubation, the expression of Ki-67 in G415 cells was detected by immunofluorescence staining. The expression of Ki-67 in G415 cells was quantified by integrated optical density (IOD). Each group were performed at least three independent experiments. *P<0.01 vs control group; **P<0.01 vs control group.
Downregulation of miR-575 Significantly Induced Apoptosis of GBC Cells
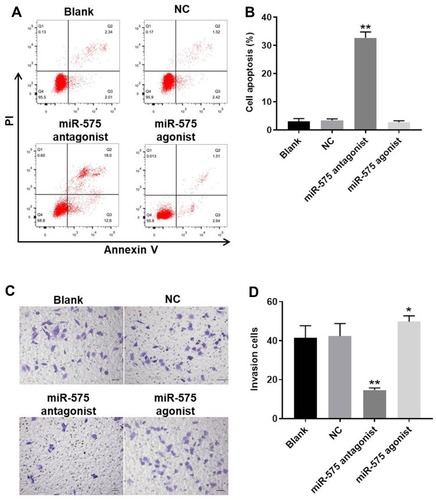
Next, to assess the effect of miR-575 on cell apoptosis of GBC-SD, flow cytometry was performed. As showed in , miR-575 antagonist notably induced apoptosis of GBC-SD cells. As expected, upregulation of miR-575 had no effect on cell apoptosis. Consistently, as showed in Supplementary Figure 1A and B, downregulation of miR-575 notably induced the apoptosis of G415 cells. These data suggested that downregulation of miR-575 could induce apoptosis of GBC cells.
Figure 2 Downregulation of miR-575 significantly induced the apoptosis and inhibited the invasion in GBC-SD cells. GBC-SD cells were transfected with miR-575 antagonist, miR-575 agonist, or NC for 24 h. Then, cells were incubated for another 48 h. (A, B) The rate of apoptotic cells was detected by FACS after double staining with Annexin V and PI. X-axis: the level of Annexin-V FITC fluorescence; Y-axis: the PI fluorescence. (C, D) The invasion of GBC-SD cells was detected with transwell assay. Each group were performed at least three independent experiments. *P<0.01 vs control group; **P<0.01 vs control group.
Downregulation of miR-575 Notably Inhibited the Invasion of GBC Cells
To examine the effect of miR-575 on invasion of GBC cells, transwell was performed. As expected, downregulation of miR-575 significantly inhibited the invasion of GBC-SD cells, while miR-575 agonist promoted cell invasion (). Similarly, miR-575 antagonist significantly inhibited the invasion of G415 cells (Supplementary Figure 1C and D). These data revealed that downregulation of miR-575 significantly downregulated the invasion of GBC cells, while upregulation of miR-575 exhibited the opposite effect in vitro.
p27 Kip1 Was a Direct Binding Target of miR‑575
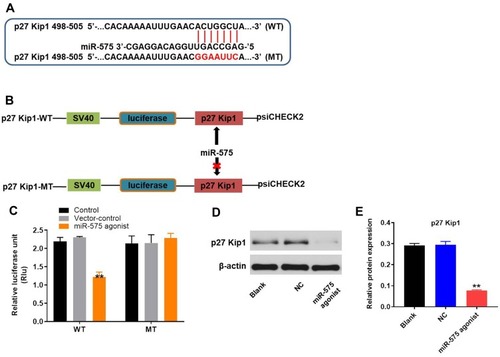
TargetScan and miRDB were used to search target genes of miR-575. The result suggested that p27 Kip1 might be a potential target of miR-575 ( and B). In addition, we applied dual-luciferase reporter assay to evaluate whether p27 Kip1 was a binding target for miR-575. The results demonstrated that miR-575 agonist inhibited the luciferase activity of psiCHECK-2-p27 Kip1-WT; however, it did not affect the luciferase activity of psiCHECK-2-p27 Kip1-MT (). Additionally, the result of Western blot showed that the protein expression of p27 Kip1 in GBC-SD cells was notably decreased in the presence of miR-575 agonist (). All these data suggested that p27 Kip1 was a direct downstream target of miR‑575.
Figure 3 MiR-575 directly targeted p27 Kip1. (A, B) Gene structure of p27 Kip1 at the position of 498–505 indicates the predicted target site of miR-575 in its 3ʹUTR, with a sequence of GGAAUUC. (C) The luciferase activity was measured after co-transfecting with WT/MT p27 Kip1 3′-UTR plasmid and miR-575 agonist in GBC-SD cells using the dual-luciferase reporter assay. The results were normalized to Renilla luciferase. (D) GBC-SD cells were transfected with miR-575 agonist, NC, or nothing (Blank) for 24 h and the cells were incubated for another 48 h. Protein expression of p27 Kip1 in GBC-SD cells was detected with Western blotting. (E) The relative expression of p27 Kip1 was quantified via normalization to β-actin. Each group were performed at least three independent experiments. **P<0.01 vs control group.
Downregulation of miR-575 Obviously Induced G1 Arrest in GBC Cells
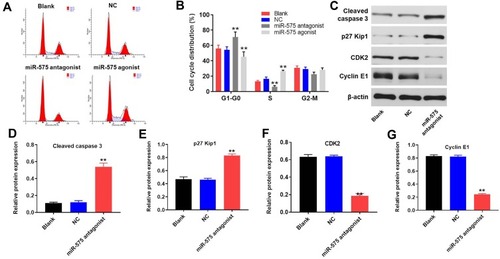
Next, flow-cytometry was applied to detect the cell cycle distribution in GBC-SD. As illustrated in , downregulation of miR-575 notably induced G1 arrest in GBC-SD cells, while miR-575 agonist exhibited the opposite effect. Since miR-575 antagonist exhibited significantly regulatory effect on cell apoptosis and cycle of GBC-SD, apoptosis and cell cycle-related proteins were detected by Western blot. The results indicated that miR-575 antagonist markedly enhanced the expressions of cleaved caspase3 and p27 Kip1 and decreased the expressions of CDK2 and cyclin E1 in GBC cells (–). Moreover, miR-575 antagonist greatly induced G1-arrest in G415 cells (Supplementary Figure 1E and F). Taken together, downregulation of miR-575 could significantly induce G1 arrest in GBC-SD cells.
Figure 4 Downregulation of miR-575 induced G1 arrest in GBC-SD cells. GBC-SD cells were transfected with miR-575 antagonist, miR-575 agonist, nothing, or miR-NC (NC) for 24 h. Then, cells were incubated for another 48 h. After transfection (A, B) the cell cycle distribution in G0/G1, S, and G2 phase after propidium iodide staining of GBC cells were determined by FACS. (C) Expressions of cleaved caspase3, p27 Kip1, CDK2, and cyclin E1 in GBC-SD cells were detected with Western blotting. (D–G) The relative expressions of cleaved caspase3, p27 Kip1, CDK2, and cyclin E1 in GBC-SD cells were quantified via normalization to β-actin. Each group were performed at least three independent experiments. **P<0.01 vs control group.
MiR-575 Antagonist Significantly Inhibited GBC Tumor Growth in vivo
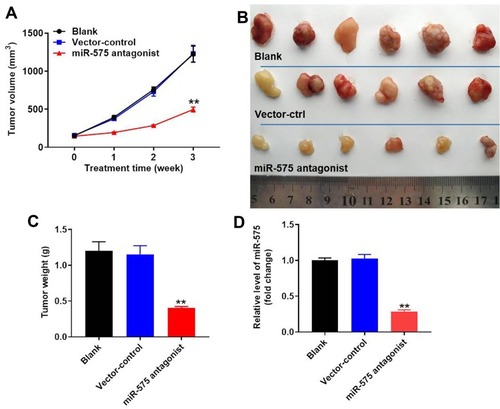
To further evaluate the effect of miR-575 on tumor growth of GBC in vivo, xenograft model was established. As indicated in , downregulation of miR-575 markedly inhibited the tumor sizes in mice. In addition, miR-575 antagonist significantly decreased the weight of tumors, compared with control (). Meanwhile, the expression of miR-575 was significantly downregulated in tumor tissues after miR-575 antagonist injection (). All these data revealed that miR-575 antagonist could inhibit tumor growth of GBC in vivo.
Figure 5 Downregulation of miR-575 inhibited tumor growth of GBC in vivo. GBC-SD cells were subcutaneously injected into nude mice to establish tumor xenograft model. MiR-575 antagonist or vector control was directly injected into the tumors twice a week. (A) Tumor volumes of mice were measured weekly. (B) At the end of the study, tumor tissues of mice were collected and pictured. (C) Tumor weights in each group of mice were calculated. (D) The level of p27 Kip1 in tumor tissues was detected using qRT-PCR. Each group were performed at least three independent experiments. **P<0.01 vs control group.
Downregulation of miR-575 Significantly Decreased the Expression of Cell Cycle-Related Proteins in vivo
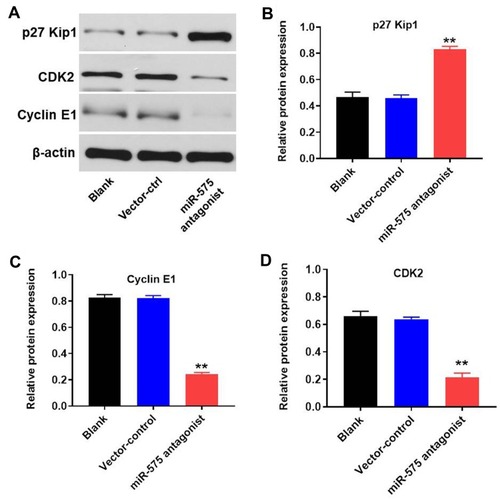
To investigate the effect of miR-575 on the expression of cycle-related proteins in tumor tissues, Western blot assay was performed. As indicated in –, miR-575 antagonist notably increased the level of p27 Kip1 and decreased the expressions of cyclin E1 and CDK2 in tumor tissues. These data were consistent with in vitro result and further revealed that miR-575 antagonist inhibited GBC tumor growth via modulating the expression of cell cycle-related proteins.
Figure 6 Downregulation of miR-575 inhibited tumor growth of GBC via modulating the expression of cycle-related and pro-apoptosis proteins. (A) The protein expressions of p27 Kip1, CDK2, and cyclin E1 in tumor tissues were detected using Western-blot. (B–D) The relative expressions of p27 Kip1, CDK2, and cyclin E1 in tumor tissues were quantified via normalization to β-actin. Each group were performed at least three independent experiments. **P<0.01 vs control group.
Discussion
Recent studies have reported that the miRNA was involved in the growth of GBC, and dysregulation of miRNAs plays a critical role during the tumorigenesis of GBC.Citation20–Citation22 In this research, we found that the cell growth of GBC was significantly inhibited by miR-575 antagonist. Our study firstly found the effect of miR-575 on GBC, indicating that miR-575 could function as an oncogene in GBC. A previous study found that miR-575 knockdown significantly downregulated the progression of gastric cancer cells.Citation23 Additionally, miR-575 was notably upregulated in hepatic carcinoma.Citation24 Our finding was consistent with these data suggesting that miR-575 might act as an oncogene.
It has been confirmed that miRNAs exert their biological functions due to their target genes.Citation25,Citation26 In this study, luciferase reporter assay indicated that p27 Kip1 was identified as a downstream target of miR-575 in GBC. P27 Kip1 is a cell cycle regulator firstly regarded as a cyclin-dependent kinase antagonist.Citation27 It has been reported that Rooibos decreased the proliferation of castration-resistant prostate cancer cells via upregulation of p27 Kip1.Citation28 Additionally, Higd-1a inhibited the progression of pancreatic cancer cells through a pERK/p27 Kip1/pRB pathway.Citation29 In our research, downregulation of miR-575 significantly increased the protein level of p27 Kip1. Our findings were consistent with the previous studies. Collectively, our findings revealed that miR-575 exhibited an oncogenic effect on GBC cells via targeting p27 Kip1. Otherwise, a previous report has suggested that miR-575 could mediate the progression of gastric cancer via targeting PTEN.Citation23 This difference may be due to the different tumor types.
Additionally, in vitro experiments indicated that downregulation of miR-575 significantly induced G1 arrest in GBC cells via downregulating the expression of CDK2 and cyclin E1. CDK2 and cyclin E1 have been regarded to be cell cycle regulators in malignant tumors.Citation30–Citation33 Moreover, Liu et al found that NF-κB induced cell cycle arrest in laryngeal squamous cell cancer via downregulation of CDK2.Citation34 Overexpression of p38γ could promote the progression of human colorectal cancer via upregulation of cyclin E1.Citation35 Our research was consistent with these data, revealing that miR-575 antagonist notably induced G1 arrest in GBC cells through inactivating CDK2 and cyclin E1. On the other hand, this study found that downregulation of miR-575 notably activated cleaved caspase 3 in GBC cells. It has been confirmed that cleaved caspase3 is a pro-apoptotic protein.Citation36 Our result further confirmed the role of cleaved caspase 3, indicating that miR-575 antagonist induced the apoptosis of GBC cells through upregulation of cleaved caspase 3. Frankly speaking, we only focused on the effect of miR-575 on cell cycle-related proteins so far. Since Lupeol inhibited the tumorigenesis of GBC via suppression of EGFR/MMP-9 signaling pathway,Citation37 we will further investigate the effect of miR-575 on EGFR/MMP-9 signaling.
Taken together, downregulation of miR-575 significantly suppressed the tumorigenesis of GBC via targeting p27 Kip1, which may be used as a potential target for the treatment of GBC.
Acknowledgment
This research was supported by National Natural Science Foundation of China (81702422 and 81871995), Project of Jiangsu Provincial Commission of Education (17KJB320024), Project of Jiangsu Provincial Commission of Health and Family Planning (H2017086) and Technology Research Projects of Henan Science and Technology Department (182107000054).
Disclosure
The authors declare no competing interests in this research.
References
- Zhong Y, Wu X, Li Q, et al. Long noncoding RNAs as potential biomarkers and therapeutic targets in gallbladder cancer: a systematic review and meta-analysis. Cancer Cell Int. 2019;19:169. doi:10.1186/s12935-019-0891-131297033
- Wang JW, Peng SY, Li JT, et al. Identification of metastasis-associated proteins involved in gallbladder carcinoma metastasis by proteomic analysis and functional exploration of chloride intracellular channel 1. Cancer Lett. 2009;281(1):71–81. doi:10.1016/j.canlet.2009.02.02019299076
- Hoyos S, Navas MC, Restrepo JC, Botero RC. Current controversies in cholangiocarcinoma. Biochim Biophys Acta Mol Basis Dis. 2018;1864(4 Pt B):1461–1467. doi:10.1016/j.bbadis.2017.07.02728756216
- Liu TY, Tan ZJ, Jiang L, et al. Curcumin induces apoptosis in gallbladder carcinoma cell line GBC-SD cells. Cancer Cell Int. 2013;13(1):64. doi:10.1186/1475-2867-13-6423802572
- Pu M, Chen J, Tao Z, et al. Regulatory network of miRNA on its target: coordination between transcriptional and post-transcriptional regulation of gene expression. Cell Mol Life Sci. 2019;76(3):441–451. doi:10.1007/s00018-018-2940-730374521
- Rupaimoole R, Slack FJ. MicroRNA therapeutics: towards a new era for the management of cancer and other diseases. Nat Rev Drug Discov. 2017;16(3):203–222. doi:10.1038/nrd.2016.24628209991
- Yao Y, Suo AL, Li ZF, et al. MicroRNA profiling of human gastric cancer. Mol Med Rep. 2009;2(6):963–970. doi:10.3892/mmr_0000019921475928
- Zhang X, Xin G, Sun D. Serum exosomal miR-328, miR-575, miR-134 and miR-671-5p as potential biomarkers for the diagnosis of Kawasaki disease and the prediction of therapeutic outcomes of intravenous immunoglobulin therapy. Exp Ther Med. 2018;16(3):2420–2432. doi:10.3892/etm.2018.645830186482
- Wang H, Yan C, Shi X, et al. MicroRNA-575 targets BLID to promote growth and invasion of non-small cell lung cancer cells. FEBS Lett. 2015;589(7):805–811. doi:10.1016/j.febslet.2015.02.01325728273
- Roskoski R Jr. Cyclin-dependent protein serine/threonine kinase inhibitors as anticancer drugs. Pharmacol Res. 2019;139:471–488. doi:10.1016/j.phrs.2018.11.03530508677
- Barbacid M, Ortega S, Sotillo R, et al. Cell cycle and cancer: genetic analysis of the role of cyclin-dependent kinases. Cold Spring Harb Symp Quant Biol. 2005;70:233–240. doi:10.1101/sqb.2005.70.00516869759
- Denicourt C, Dowdy SF. Cip/Kip proteins: more than just CDKs inhibitors. Genes Dev. 2004;18(8):851–855. doi:10.1101/gad.120530415107401
- Jasinski S, Perennes C, Bergounioux C, Glab N. Comparative molecular and functional analyses of the tobacco cyclin-dependent kinase inhibitor NtKIS1a and its spliced variant NtKIS1b. Plant Physiol. 2002;130(4):1871–1882. doi:10.1104/pp.00857312481070
- Zhou N, Huang Q, Cheng W, et al. p27kip1 haploinsufficiency preserves myocardial function in the early stages of myocardial infarction via Atg5mediated autophagy flux restoration. Mol Med Rep. 2019;20(4):3840–3848. doi:10.3892/mmr.2019.1063231485654
- Filipits M, Puhalla H, Wrba F. Low p27Kip1 expression is an independent prognostic factor in gallbladder carcinoma. Anticancer Res. 2003;23(1B):675–679.12680166
- Rippa E, La Monica G, Allocca R, et al. Overexpression of gastrokine 1 in gastric cancer cells induces Fas-mediated apoptosis. J Cell Physiol. 2011;226(10):2571–2578. doi:10.1002/jcp.2260121792914
- Menbari MN, Rahimi K, Ahmadi A, et al. miR-483-3p suppresses the proliferation and progression of human triple negative breast cancer cells by targeting the HDAC8 oncogene. J Cell Physiol. 2019.
- Zhang X, Zhang L, Chen M, Liu D. miR-324-5p inhibits gallbladder carcinoma cell metastatic behaviours by downregulation of transforming growth factor beta 2 expression. Artif Cells Nanomed Biotechnol. 2020;48(1):315–324. doi:10.1080/21691401.2019.170372431858815
- Zhou T, Yu L, Huang J, et al. GDF10 inhibits proliferation and epithelial-mesenchymal transition in triple-negative breast cancer via upregulation of Smad7. Aging (Albany NY). 2019;11(10):3298–3314. doi:10.18632/aging.10198331147529
- Wu XS, Wang F, Li HF, et al. LncRNA-PAGBC acts as a microRNA sponge and promotes gallbladder tumorigenesis. EMBO Rep. 2017;18(10):1837–1853. doi:10.15252/embr.20174414728887321
- Chandra V, Kim JJ, Mittal B, Rai R. MicroRNA aberrations: an emerging field for gallbladder cancer management. World J Gastroenterol. 2016;22(5):1787–1799. doi:10.3748/wjg.v22.i5.178726855538
- Ma Q, Zhang Y, Liang H, et al. EMP3, which is regulated by miR-663a, suppresses gallbladder cancer progression via interference with the MAPK/ERK pathway. Cancer Lett. 2018;430:97–108. doi:10.1016/j.canlet.2018.05.02229778567
- Wang YN, Xu F, Zhang P, et al. MicroRNA-575 regulates development of gastric cancer by targeting PTEN. Biomed Pharmacother. 2019;113:108716. doi:10.1016/j.biopha.2019.10871630844657
- Yan S, Tang Z, Chen K, et al. Long noncoding RNA MIR31HG inhibits hepatocellular carcinoma proliferation and metastasis by sponging microRNA-575 to modulate ST7L expression. J Exp Clin Cancer Res. 2018;37(1):214. doi:10.1186/s13046-018-0853-930176933
- Backes C, Meese E, Keller A. Specific miRNA disease biomarkers in blood, serum and plasma: challenges and prospects. Mol Diagn Ther. 2016;20(6):509–518. doi:10.1007/s40291-016-0221-427378479
- Bernardo BC, Ooi JY, Lin RC, McMullen JR. miRNA therapeutics: a new class of drugs with potential therapeutic applications in the heart. Future Med Chem. 2015;7(13):1771–1792. doi:10.4155/fmc.15.10726399457
- Bencivenga D, Caldarelli I, Stampone E, et al. p27(Kip1) and human cancers: A reappraisal of a still enigmatic protein. Cancer Lett. 2017;403:354–365. doi:10.1016/j.canlet.2017.06.03128687353
- Huang SH, Tseng JC, Lin CY, et al. Rooibos suppresses proliferation of castration-resistant prostate cancer cells via inhibition of Akt signaling. Phytomedicine. 2019;64:153068. doi:10.1016/j.phymed.2019.15306831419729
- An HJ, Ryu M, Jeong HJ, et al. Higd-1a regulates the proliferation of pancreatic cancer cells through a pERK/p27(KIP1)/pRB pathway. Cancer Lett. 2019;461:78–89. doi:10.1016/j.canlet.2019.07.00731310799
- Bo L, Wei B, Wang Z, et al. Bioinformatics analysis of the CDK2 functions in neuroblastoma. Mol Med Rep. 2018;17(3):3951–3959. doi:10.3892/mmr.2017.836829328425
- Ji X, Humenik J, Yang D, Liebhaber SA. PolyC-binding proteins enhance expression of the CDK2 cell cycle regulatory protein via alternative splicing. Nucleic Acids Res. 2018;46(4):2030–2044. doi:10.1093/nar/gkx125529253178
- Pellerano M, Tcherniuk S, Perals C, et al. Targeting conformational activation of CDK2 kinase. Biotechnol J. 2017;12(8). doi:10.1002/biot.201600531.
- Karst AM, Jones PM, Vena N, et al. Cyclin E1 deregulation occurs early in secretory cell transformation to promote formation of fallopian tube-derived high-grade serous ovarian cancers. Cancer Res. 2014;74(4):1141–1152. doi:10.1158/0008-5472.CAN-13-224724366882
- Liu JL, Ma HP, Lu XL, et al. NF-kappaB induces abnormal centrosome amplification by upregulation of CDK2 in laryngeal squamous cell cancer. Int J Oncol. 2011;39(4):915–924. doi:10.3892/ijo.2011.112521769424
- Su C, Sun Q, Liu S, et al. Targeting p38gamma to inhibit human colorectal cancer cell progression. Biochem Biophys Res Commun. 2019;517(1):172–179. doi:10.1016/j.bbrc.2019.07.03831349971
- Huang M, Zhong Y, Lin L, et al. 1,2-Dichloroethane induces cerebellum granular cell apoptosis via mitochondrial pathway in vitro and in vivo. Toxicol Lett. 2020;322:87–97. doi:10.1016/j.toxlet.2020.01.00431935479
- Liu Y, Bi T, Shen G, et al. Lupeol induces apoptosis and inhibits invasion in gallbladder carcinoma GBC-SD cells by suppression of EGFR/MMP-9 signaling pathway. Cytotechnology. 2016;68(1):123–133. doi:10.1007/s10616-014-9763-725037728