
Abstract
Aim
Resistance to neoadjuvant chemoradiotherapy (NCRT) and tumor recurrence presents a major clinical problem in locally advanced rectal cancer (LARC) patients. This study aimed to explore a genetic risk score related to NCRT response and tumor recurrence in rectal cancer after NCRT.
Materials and Methods
Weighted gene co-expression network analysis was employed to identify hub genes associated with NCRT response from the GSE93375 dataset. Prognostic hub genes were determined using Cox regression analysis and associated with disease-free survival (DFS). A risk score system was constructed and the prognostic significance of the risk score was validated in our patient cohort. A predictive nomogram for DFS was developed and validated internally.
Results
The Tan module had the highest correlations with NCRT response. Ten hub genes (COL15A1, THBS2, ITGB1, MMP2, CD34, SPARC, NOTCH3, PDGFRB, DCN, and SERPINH1) were associated with NCRT response. Immunostaining expression of four genes (NOTCH3, SPARC, DCN, and ITGB1) was found to be significantly associated with both NCRT response and DFS in our patient cohort and was selected to build a prognostic risk score for DFS as follows: risk score= (0.6188×ExpNOTCH3) + (0.6511×ExpSPARC) + (−0.2976×ExpDCN) + (1.0035×ExpITGB1). Using this risk score, patients could be separated into high- and low-risk groups for tumor recurrence. A nomogram that incorporated the risk score, ypTNM stage, and tumor regression grade (TRG) was constructed and utilized to predict DFS in LARC patients.
Conclusion
The four-gene expression-based risk score system presented here could be potentially used for predicting tumor recurrence in LARC patients after NCRT.
Introduction
Rectal cancer is one of the most common and deadly malignancies worldwide.Citation1 For locally advanced rectal cancer (LARC), neoadjuvant chemoradiotherapy (NCRT), followed by radical surgery, has become the mainstay treatment and is associated with well-established benefits.Citation2–Citation4 However, tumor response to NCRT varies greatly among patients following this treatment. Approximately 10%-30% of patients receiving NCRT will achieve a pathological complete response (pCR) and could be potential candidates for organ-preserving strategies (i.e. “wait and see” and local excision).Citation5 Conversely, 15–45% of patients will develop tumor resistance to NCRT, be exposed to NCRT-related toxicities and even observe a progression of the disease.Citation6 Therefore, the upfront identification of good or poor responders to NCRT may facilitate personalized treatment decision making in rectal cancer. Currently, the identification of reliable biomarkers for monitoring NCRT response and tumor recurrence in rectal cancer patients represents an unmet clinical challenge.
Great efforts have been devoted to identifying biomarkers associated with treatment response to NCRT in rectal cancers. Recent advancements in high-throughput microarray technology have facilitated the identification of molecular markers with the potential to predict treatment responses for rectal cancer.Citation7,Citation8 Most previous studies focused on the identification of differentially expressed genes (DEGs), without exploring the interconnection between genes. Currently, correlation networks are increasingly used to bridge the gap between individual genes and systems biology networks through bioinformatics analysis. Weighted gene co-expression network analysis (WGCNA) is a network-based approach used to explore the correlation patterns between genes.Citation9 WGCNA can identify co-expression gene modules and hub genes that are associated with clinical traitsCitation10 and, consequently, has been increasingly used to uncover novel biomarkers in various cancers.Citation11–Citation13 However, few studies have adopted the WGCNA approach to identify network-centric genes associated with NCRT response and tumor recurrence in patients with LARC.Citation14
In the present study, we identified those hub modules and genes that are significantly associated with NCRT response by using the WGCNA approach. Four genes were found to be significantly associated with both NCRT response and disease-free survival (DFS) in our patient cohort and were selected to build a prognostic risk score for DFS. Additionally, we developed a predictive nomogram for NCRT response based on this risk score.
Materials and Methods
Patients and Data Processing
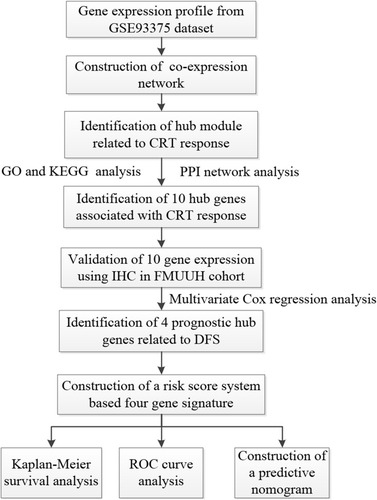
Gene expression profiles and clinical information relevant to rectal cancer were obtained from the Gene Expression Omnibus (GEO) database (https://www.ncbi.nlm.nih.gov/geo/) using dataset GSE93375, which included 42 pretreatment samples obtained from rectal cancer patients receiving NCRT (25 responders and 17 non-responders).Citation15 Data pre-processing was performed using the R software (version 3.5.1, R Foundation for Statistical Computing, Vienna, Austria, http://www.r-project.org) and complied with the human subject protection and data access policies of the GEO database. In addition, a total of 118 patients with LARC in Fujian Medical University Union Hospital (FMUUH, Fujian, China) were used as the FMUUH cohort and selected for the validation of those hub genes with a differential expression between the two groups. Patient inclusion criteria were pathologically confirmed rectal adenocarcinoma located with 12 cm from the anal verge and received NCRT and radical resection. Exclusion criteria included distant metastasis at diagnosis and incomplete follow-up data. The clinicopathological characteristics of those patients included in the FMUUH cohort are presented in Supplementary Table 1. The study protocol was approved by the ethics committee of FMUUH. All subjects gave written informed consent in accordance with the Declaration of Helsinki. A flow diagram of this study is presented in .
Figure 1 Flowchart of this study.
Abbreviations: CRT, chemoradiotherapy; GO, Gene Ontology; KEGG, Kyoto Encyclopedia of Genes and Genomes; PPI, protein–protein interaction; IHC, immunohistochemistry; FMUUH, Fujian Medical University Union Hospital; DFS, disease-free survival; ROC, receiver operating characteristics.
Co-Expression Network Construction
A scale-free co-expression network was constructed by using R software with the “WGCNA” package.Citation9 Then, a correlation matrix was constructed by calculating Pearson’s correlation coefficients for all genes and an appropriate soft-threshold power was determined by analyzing the network topology. Subsequently, the adjacency was transformed into a topological overlap matrix (TOM), using the topological overlap-based dissimilarity measure.Citation16 Finally, co-expression gene modules that were associated with the response to NCRT were identified by using the dynamic tree cut method.Citation17 A clustering dendrogram was used to display the results of a dynamic tree cut and merge.
Identification of Modules and Hub Genes Related to NCRT Response
To identify the crucial module for NCRT response, the correlations between the module eigengenes (MEs) and clinical traits were calculated by using module-trait relationship (MTR) analysis.Citation9 Gene Ontology (GO) functional enrichment and Kyoto Encyclopedia of Genes and Genomes (KEGG) pathway analysis were performed in order to explore the potential mechanisms associated with the hub module genes.Citation18 Genes with a high MM (cor.geneModuleMembership > 0.8) and GS (cor.geneTraitSignificance > 0.2) were defined as hub genes in a module. Additionally, functional interactions were investigated by submitting all genes to the online Search Tool for the Retrieval of Interacting Genes (STRING; http://string-db.org/) database.Citation19 Protein–protein interaction (PPI) network analysis was performed by using Cytoscape software, and Molecular Complex Detection (MCODE) algorithm was conducted in order to screen the hub genes in the maximum specific weight modules within the PPI network.Citation20 In order to define the hub genes, only those with the most interactions, defined by a p-value < 0.05 in WGNCA, and in the top ten in PPI screening relevance, were considered. To further verify the expression of the ten hub genes in a large number of colon and rectal cancer tissues, Gene Expression Profiling Interactive Analysis (GEPIA; http://gepia.cancer-pku.cn/), a web-based tool based on The Cancer Genome Atlas (TCGA) was used.
Immunohistochemistry
Immunohistochemistry (IHC) was performed to validate the protein expression of the hub genes in the FMUUH cohort. The immunostaining intensity was scored as follows: 0 (no staining), 1 (light yellow), 2 (yellow/brown), and 3 (deep brown). The percentage of positive cells was scored as 0 (<5%), 1 (5%-25%), 2 (25%-50%), 3 (50%-75%), and 4 (>75%). The two scores were multiplied together and a final immunohistochemical score was defined as follows: 0 score (−), 1–4 scores (+), 5–8 scores (++), 9–12 scores (+++).
Establishment of a Four-Gene Based Risk Score System
The immunostaining expression of the hub genes was put into a Cox regression model to identify particular hub genes which could predict DFS in the FMUUH cohort. Specifically, four genes which were associated wth a p-value <0.05 in the multivariate Cox regression were selected for further analysis. A prognostic risk score system was calculated based on the four-gene signature, as follows: risk score = Σ (C × EXPgene), where EXP was the immunostaining expression of the four genes, and C was the regression coefficient of the four genes in the multivariable Cox regression analysis. Patients were assigned to high-risk or low-risk groups according to the median risk score. The expression profiles of the four genes in the high- and low-risk groups were plotted and visualized as a risk heatmap. The entire patient cohort was divided into two subgroups according to patient outcomes (tumor recurrence or not). Then, receiver operating characteristic (ROC) curves were plotted based on the risk scores and the status of tumor recurrence. Survival difference between high-risk and low-risk groups was analyzed using the Kaplan-Meier method with the Log rank test.
Development of a Risk Score-Based Nomogram
By incorporating both clinical information and the risk score, Cox regression analysis was performed to identify independent determinants of DFS in rectal cancer patients in the FMUUH cohort. A predictive nomogram for individualized prediction of DFS was then built based on the significant predictors using R software with the “rms” package. The discrimination of the nomogram was measured by the Concordance index (C-index). Calibration curves were used to assess whether the actual outcomes approximately predicted outcomes for the nomogram. Statistical analyses were performed using SPSS software (version 23, SPSS Inc, Chicago, IL, USA) and the R software (version 3.5.1, R Foundation for Statistical Computing, Vienna, Austria, http://www.r-project.org). A two-sided p-value <0.05 was considered to be statistically significant.
Results
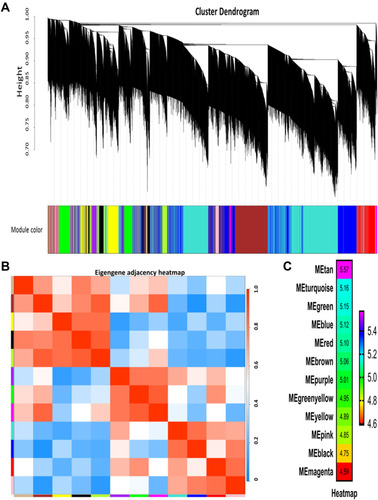
Construction of A Weighted Co-Expression Network and Identification of Key Modules Using the GSE93375 Dataset
WGCNA was performed to construct a co-expression gene network using 42 samples from the GSE93375 dataset. A total of 13 co-expressed gene modules were identified via a dynamic tree cut method, and each module was marked by a color (). Subsequently, we examined the correlation between gene modules and response to NCRT () by using Pearson’s correlation test, and resultantly, a total of twelve modules were established. Among them, the Tan module had the highest positive correlation with NCRT response among all the gene modules (). Thus, the co-expression Tan module was most significantly associated with NCRT response and was chosen for further analysis.
Figure 2 Weighted gene coexpression network analysis (WGCNA). (A) Dendrogram of all expressed genes in the top 25% of variance clustered based on a dissimilarity measure (1−TOM). (B) Heatmap plot of the adjacencies of modules. (C) Heatmap of the correlation between module eigengenes and CRT resistance.
Hub Gene Identification Using the GSE93375 Dataset
GO functional enrichment analysis was employed to explore the potential biological functions of the Tan module. The results showed that the biological process of genes in the Tan module was primarily involved in endodermal cell differentiation, collagen fibril organization, and cellular response to amino acid stimulus (). KEGG pathway analysis demonstrated that these genes were mainly related to the PI3K-Akt signaling pathway, protein digestion and absorption, and focal adhesion ().
Figure 3 Identification of ten hub genes. (A) GO functional analysis of the top ten pathways of genes in tan modules. (B) KEGG pathway analysis of the top ten pathways of genes in tan modules. (C) PPI network of genes which has the highest score in the MOCDE in the tan module. The color intensity in each node was proportional to the degree of connectivity in the weighted gene co-expression network.
Abbreviations: GO, Gene Ontology; KEGG, Kyoto Encyclopedia of Genes and Genomes; PPI, protein–protein interaction; MCODE, Molecular Complex Detection.
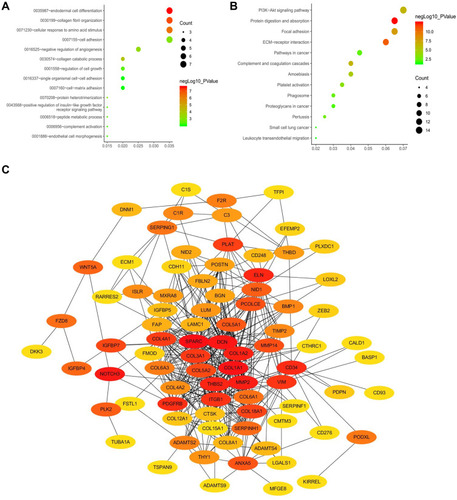
A total of 134 genes in the co-expression Tan module were identified as genes with high module connectivity (both cor. geneModuleMembership > 0.8 and cor. geneTraitSignificance > 0.2). According to the STRING database, we constructed a PPI network for all the genes in the Tan module by employing the MOCDE algorithm in Cytoscape. Finally, 10 hub genes (NOTCH3, SPARC, DCN, ITGB1, MMP2, THBS2, COL15A1, CD34, PDGFRB, and SERPINH1) from the Tan module were chosen as hub genes in both the co-expression and PPI networks (). Detailed information for the 10 hub genes is listed in Supplementary Table 2.
To further evaluate the relationship between DFS and the expression of the ten hub gens in colon and rectal cancer, we analyzed data from TCGA by using GEPIA. The results demonstrated that low expression of NOTCH3, SPARC, MMP2, COL15A1, CD34, and SERPINH1 was associated with a higher rate of DFS (P = 0.049, P = 0.032, P = 0.033, P = 0.028, P = 0.023, and P = 0.47, respectively), as shown in Supplementary Figure . S2A, 2B, 2E, 2G, 2H, and 2J. In addition, an association between a higher DFS and low expression DCN, ITGB1, THBS2, and PDGFRB was observed, but it was without statistical significance (P = 0.57, P = 0.073, P = 0.0063, and P = 0.12, respectively), as shown in Supplementary Figure . S2C, 2D, 2F, and 2I.
Verification of the Ten Hub Genes in the FMUUH Cohort
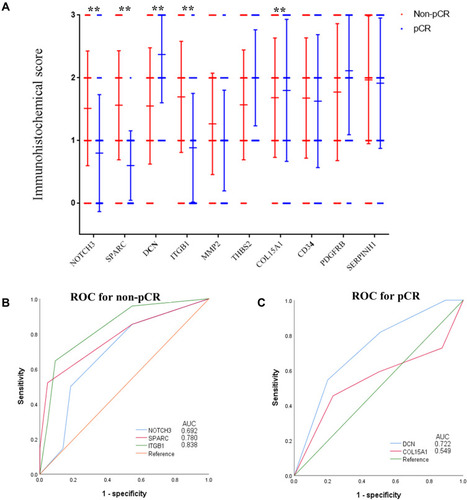
In order to independently validate the defined hub genes, we analyzed the immunostaining expression in the FMUUH cohort using immunohistochemistry (Supplementary Figure 1). As shown in , a higher immunostaining expression of DCN and COL15A1 was associated with a higher probability of pathological complete response (pCR, P=0.005, and P=0.016, respectively), while a higher immunostaining expression of NOTCH3, SPARC, and ITGB1 was associated with a higher probability of non-pCR (P=0.003, P<0.001, and P<0.001, respectively). When the over-expression of DCN and COL15A1 was correlated with pCR using ROC analysis, the AUC values were 0.722 and 0.549 (both P<0.01), respectively, and when the over-expression of DCN and COL15A1 was correlated with non-pCR, the AUC values were 0.692, 0.780, and 0.838 (all P<0.01), respectively, as shown in .
Figure 4 Association between the immunostaining expression of the ten hub genes of pCR. (A) The immunostaining expression of the ten hub genes between pCR and non-pCR groups. (B) ROC analysis of the immunostaining expression of NOTCH3, SPARC, and ITGB1 for predicting non-pCR of the training set. (C) ROC analysis of the immunostaining expression of DCN and COL15A1 for predicting pCR of the training set.
Abbreviations: ROC, receiver operating characteristic; pCR, pathological complete response.
Identification of Four Key Prognostic Hub Genes in the FMUUH Cohort
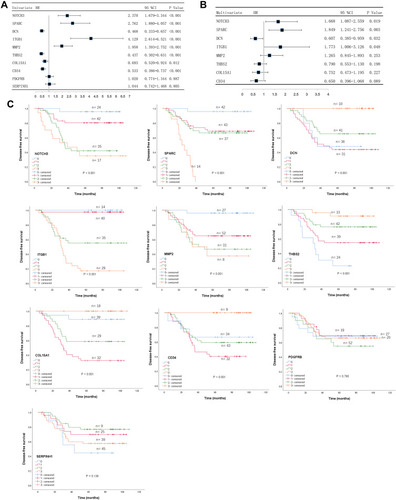
Immunostaining expression of the 10 genes was subjected to Cox regression analysis to identify the optimal prognostic hub genes for DFS. Employing univariate analysis, the immunostaining expression of NOTCH3 (P<0.001), SPARC (P<0.001), DCN (P<0.001), ITGB1 (P<0.001), MMP2 (P<0.001), THBS2 (P<0.001), COL15A1 (P=0.012), and CD34 (P<0.001) were significantly associated with DFS (), and the prognostic relevance of these genes was also demonstrated in Kaplan-Meier curves, as shown in . Multivariate Cox regression analysis revealed that the immunostaining expression of NOTCH3 (HR=1.668, 95CI=1.087–2.559, P=0.019), SPARC (HR=1.849, 95CI=1.241–2.756, P=0.003), DCN (HR=0.607, 95CI=0.385–0.959, P=0.032), and ITGB1 (HR=1.773, 95CI=1.006–3.126, P=0.048) were factors independently associated with DFS in LARC patients following NCRT, as shown in Supplementary Table 3. These four genes were selected for further analysis.
Figure 5 Identification of prognostic hub genes for DFS. (A) Univariate Cox regression analysis of predictors of DFS. (B) Multivariate Cox regression analysis of predictors of DFS. (C) Kaplan-Meier analysis of the ten hub genes.
Abbreviation: DFS, disease-free survival.
Construction of a Four-Gene Based Risk Score in the FMUUH Cohort
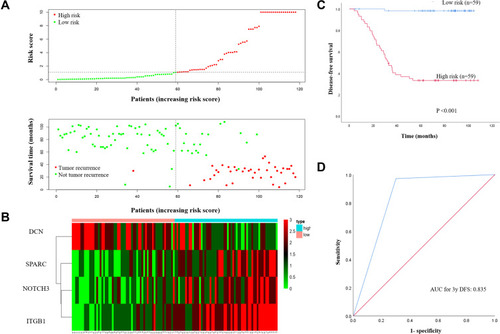
A risk score for predicting DFS was constructed based on the immunostaining expression levels of the four genes and their coefficients in the multivariate Cox regression model as follows: risk score = (0.6188 × ExpNOTCH3) + (0.6511 × ExpSPARC) + (−0.2976 × ExpDCN) + (1.0035 × ExpITGB1). A dot plot showing the risk scores and tumor recurrence status of patients was then generated, as depicted in , and highlighted that the probability of tumor recurrence for high-risk patients was higher than for low-risk patients. Additionally, a heat map was used to display the expression profiles of the four genes () and underlined the increased expression in those patients with a high probability for tumor recurrence. By using the median risk score as the cut-off value, patients were divided into high-risk (n=59) and low-risk (n=59) groups. Kaplan-Meier curves demonstrated that patients in the high-risk group had a significantly poorer DFS compared to those in the low-risk group (P<0.001, ). ROC analysis showed a good prognostic value for the risk score when predicting 3-year DFS (AUC=0.835, ).
Figure 6 (A) The 4-gene-based risk score distribution, patient survival status; (B) Heatmap of the 4-gene expression profiles in the high-risk and low-risk subgroups for the training set. (C) Kaplan-Meier analysis of patients’ DFS in the high-risk (n = 59) and low-risk (n = 59) subgroups of the training set; (D) ROC analysis of the risk score for prediction the DFS of the training set.
Abbreviations: DFS, disease-free survival; ROC, receiver operating characteristic.
Association Between the Four-Gene Risk Score and Clinicopathological Characteristics in the FMUUH Cohort
As shown in Supplementary Table 4, the risk score assigned to the four-gene signature was not associated with clinical parameters, such as gender (P=0.566), age (P=0.731), body mass index (BMI, P=0.979), tumor histopathology (P=0.499), and tumor differentiation (P=0.151). Noticeably, a higher risk score was correlated with a worse tumor regression grade (TRG) after NCRT (P<0.001). In addition, we found that a higher risk score was associated with a more advanced ypTNM stage (P<0.001).
Construction of a Predictive Nomogram for DFS in the FMUUH Cohort
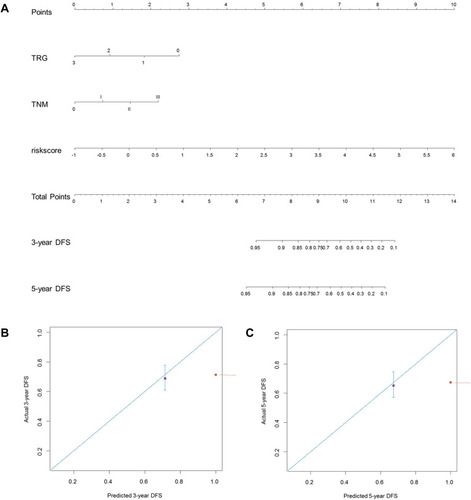
We next evaluated the prognostic value of the risk score in predicting DFS in LARC patients who underwent NCRT. Univariate Cox regression analysis demonstrated that TRG (HR=1.587, 95% CI=1.123–2.244, P=0.009), ypTNM stage (HR=2.323, 95% CI=1.582–3.409, P<0.001), inferior mesenteric artery (IMA) nodal metastasis (HR=5.504, 95% CI=1.679–18.044, P=0.005), circumferential resection margin (CRM) involvement (HR=4.751, 95% CI=1.118–20.182, P=0.035), and risk score (HR=2.661, 95% CI=1.999–3.542, P<0.001) were associated with DFS in LARC patients who underwent NCRT. Multivariate Cox regression analysis showed that TRG (HR=0.515, 95% CI=0.311–0.853, P=0.010), ypTNM stage (HR=1.682, 95% CI=1.035–2.730, P=0.036), and the risk score (HR=2.855, 95% CI=2.038–4.000, P<0.001) were independent prognostic factors associated with DFS in those LARC patients who underwent NRCT, as shown in Supplementary Table 5.
Finally, a predictive nomogram for DFS in LARC patients was constructed based upon the three independent determinants highlighted in the multivariate Cox regression analysis. As shown in , patients with a higher total score tended to be associated with lower DFS rates. The performance of the nomograms was validated internally, and the C-index for DFS prediction was 0.857 (95% CI 0.832–0.882). The calibration curves highlighted the good predictive capability of the nomogram for both the 3- and 5-year DFS ().
Figure 7 Construction of a predictive nomogram for DFS. (A) The predictive nomogram consisted of the risk score, TRG and ypTNM stage. (B) Calibration curve of the nomogram for estimation of DFS rates at 3-year. (C) Calibration curve of the nomogram for estimation of DFS rates at 5-year. DFS disease-free survival.
Discussion
Resistance to NCRT poses a major clinical problem in LARC patients and has become an obstacle that must be overcome in order to ensure optimal treatment efficacy. In the present study, by applying the WGCNA algorithm to the GSE93375 dataset, we identified ten hub genes (NOTCH3, SPARC, DCN, ITGB1, MMP2, THBS2, COL15A1, CD34, PDGFRB, and SERPINH1) associated with the response to NCRT in rectal cancer patients. Four genes (NOTCH3, SPARC, DCN, and ITGB1) were found to be significantly associated with both NCRT response and DFS and selected to build a prognostic risk score for DFS in LARC patients. Then, the clinical relevance and prognostic significance of the risk score was validated in the FMUUH cohort, underlining its capability to predict DFS in LARC patients who underwent NCRT.
A better understanding of tumor response after NCRT would be an important step towards personalized treatment strategies, such as organ preservation procedures, as well as ensuring that unnecessary treatments are avoided, especially those with a high degree of toxicity. Considerable efforts have been devoted to identifying genetic biomarkers associated with NCRT response in LARC patients.Citation21,Citation22 Unlike conventional bioinformatics methods, WGCNA can facilitate network-based gene screening methods, classify genes with highly similar coexpression patterns into separate modules, and identify those modules highly associated with clinical traits.Citation9,Citation10 Currently, WGCNA has been used to identify network-centric genes in rectal cancer research;Citation14,Citation23 however, WGCNA has not been extensively utilized to explore genes associated with NCRT response. In this study, the Tan module related most significantly to NCRT response was screened by WGCNA. Genes in the Tan module were significantly enriched for the PI3K-Akt signaling pathway, protein digestion and absorption, and focal adhesion, which have already been reported to be associated with NCRT response in rectal cancer patients.Citation24–Citation26 Based on co-expression and PPI analysis, 10 hub genes (NOTCH3, SPARC, DCN, ITGB1, MMP2, THBS2, COL15A1, CD34, PDGFRB, and SERPINH1) in the Tan module were identified as hub genes. In order to verify the bioinformatics results, we validated the immunostaining expression of the ten hub genes at the translational level in rectal cancer tissues obtained from the FMUUH cohort, and these results seemed to be consistent with those obtained by WGCNA.
Tumor recurrence represents the major treatment failure of NCRT and radical surgery in LARC patients,Citation2 and risk stratification of tumor recurrence following NCRT remains an unmet clinical challenge. Herein, we performed Kaplan-Meier survival and Cox regression analyses to screen the defined hub genes for their association with DFS in LARC patients who underwent NCRT. These results narrowed the scope from ten genes to four, including NOTCH3, SPARC, DCN, and ITGB1. They were not only highly correlated with tumor response to NCRT, but also may be potential biomarkers for DFS. Additionally, previous studies have also found that these genes may be involved in the process of tumorigenesis and tumor proliferation. NOTCH3 (Notch receptor 3) was previously identified as a potential predictor of response to radiation treatment in terms of radiation-induced fibrosis.Citation27 SPARC, also known as Secreted protein acidic and cysteine rich, has been reported to be a prognostic biomarker in rectal cancer patients treated with CRT. An over-expression of SPARC was proven to be negatively associated with overall survival and progression-free survival.Citation28 DCN (Decorin), an extracellular matrix structural protein,Citation29 was proven to be down-regulated in various cancers, including prostate cancer,Citation30 breast cancer,Citation31 and colorectal cancer.Citation32 Research by Nam JM et alCitation33 suggested that the ITGB1 (Integrin beta 1) mediated signaling pathway essentially contributes to cancer cell survival and radiation resistance. To the best of our knowledge, there are few studies investigating the association between these hub genes and tumor response to NCRT in rectal cancer patients. Further studies will be required in order to better determine their roles in rectal cancer following NCRT.
Recently, gene signatures and genetic risk scores are being increasingly applied for the prediction of tumor response to NCRT in rectal cancer patients.Citation34–Citation36 Using Cox regression analysis, we developed a prognostic risk score based on the four-gene signature used for prediction of DFS in LARC patients. In the FMUUH cohort, LARC patients with high risk scores had a significantly reduced DFS compared to those with low-risk scores. Furthermore, ROC analysis demonstrated the good discriminatory capability of the four-gene signature for the purpose of recurrence risk stratification in LARC patients. Moreover, we performed univariate and multivariate Cox regression analyses to verify whether the risk score can be an independent risk determinant in predicting DFS in LARC patients who underwent NCRT. The Cox regression analysis demonstrated that the four-gene expression-based risk score, along with TRG and ypTNM stage, were significantly associated with DFS. Then, a nomogram that incorporated the risk score, TRG, and ypTNM stage was developed for the individualized prediction of DFS. These findings may contribute to the improvement of therapeutic decision-making, risk stratification and prognostic assessment for LARC patients. However, this requires further investigations that should be performed in large prospective cohorts of LARC patients.
There were several limitations in the present study. Firstly, our four-gene expression-based risk score was generated from the GEO database and our retrospective data, and, therefore, larger prospective cohorts are needed to evaluate the clinical utility of this gene signature. Secondly, there was no experimental data related to the expression and mechanisms of the four-gene signature. Consequently, the potential mechanisms of this gene signature need to be unraveled by in vivo/in vitro experimental validation if it is to be employed for clinical applications.
In conclusion, through the WGCNA approach in the GSE93375 dataset, we identified ten hub genes associated with response to NCRT in rectal cancer patients. Four genes (NOTCH3, SPARC, DCN, and ITGB1) were found to be significantly associated with CRT response and DFS in the FMUUH cohort. Then, a four-gene expression-based risk score for assessing DFS of LARC was developed and showed high potential for discriminating those patients with a high probability of tumour recurrence.
Ethics Statement
Studies relative to human in this article were approved by the ethics committee of the The Fujian Medical University Union Hospital.
Acknowledgments
We would like to express our sincere thanks for free use of data from GEO database.
Disclosure
The authors declare no conflicts of interest.
References
- Siegel RL, Miller KD, Jemal A. Cancer statistics, 2020. CA Cancer J Clin. 2020;70(1):7–30. doi:10.3322/caac.2159031912902
- van Gijn W, Marijnen CA, Nagtegaal ID, et al. Preoperative radiotherapy combined with total mesorectal excision for resectable rectal cancer: 12-year follow-up of the multicentre, randomised controlled TME trial. Lancet Oncol. 2011;12(6):575–582. doi:10.1016/S1470-2045(11)70097-321596621
- Sauer R, Liersch T, Merkel S, et al. Preoperative versus postoperative chemoradiotherapy for locally advanced rectal cancer: results of the German CAO/ARO/AIO-94 randomized Phase III trial after a median follow-up of 11 years. J Clin Oncol. 2012;39(16):1926–1933. doi:10.1200/JCO.2011.40.1836
- Bosset J, Calais G, Mineur L, et al. Fluorouracil-based adjuvant chemotherapy after preoperative chemoradiotherapy in rectal cancer: long-term results of the EORTC 22921 randomised study. Lancet Oncol. 2014;15(2):184–190. doi:10.1016/S1470-2045(13)70599-024440473
- Creavin B, Ryan E, Martin S, et al. Organ preservation with local excision or active surveillance following chemoradiotherapy for rectal cancer. Br J Cancer. 2017;116(2):169–174. doi:10.1038/bjc.2016.41727997526
- Ha Y, Tak K, Kim C, et al. PSMB8 as a candidate marker of responsiveness to preoperative radiation therapy in rectal cancer patients. Int J Radiat Oncol Biol Phys. 2017;98(5):1164–1173. doi:10.1016/j.ijrobp.2017.03.02328721901
- Chow O, Kuk D, Keskin M, et al. KRAS and Combined KRAS/TP53 mutations in locally advanced rectal cancer are independently associated with decreased response to neoadjuvant therapy. Ann Surg Oncol. 2016;23(8):2548–2555. doi:10.1245/s10434-016-5205-427020587
- Gollins S, West N, Sebag-Montefiore D, et al. Preoperative chemoradiation with capecitabine, irinotecan and cetuximab in rectal cancer: significance of pre-treatment and post-resection RAS mutations. Br J Cancer. 2017;117(9):1286–1294. doi:10.1038/bjc.2017.29428859058
- Langfelder P, Horvath S. WGCNA: an R package for weighted correlation network analysis. BMC Bioinformatics. 2008;9(1):559. doi:10.1186/1471-2105-9-55919114008
- Horvath S, Dong J. Geometric interpretation of gene coexpression network analysis. PLoS Comput Biol. 2008;4(8):e1000117. doi:10.1371/journal.pcbi.100011718704157
- Giulietti M, Occhipinti G, Principato G, Piva F. Weighted gene co-expression network analysis reveals key genes involved in pancreatic ductal adenocarcinoma development. Cell Oncol (Dordr). 2016;39(4):379–388. doi:10.1007/s13402-016-0283-727240826
- Chen P, Wang F, Feng J, et al. Co-expression network analysis identified six hub genes in association with metastasis risk and prognosis in hepatocellular carcinoma. Oncotarget. 2017;8(30):48948–48958. doi:10.18632/oncotarget.1689628430663
- Magani F, Bray E, Martinez M, et al. Identification of an oncogenic network with prognostic and therapeutic value in prostate cancer. Mol Syst Biol. 2018;14(8):e8202. doi:10.15252/msb.2018820230108134
- Wang X, Ghareeb WM, Lu X, Huang Y, Huang S, Chi P. Coexpression network analysis linked H2AFJ to chemoradiation resistance in colorectal cancer. J Cell Biochem. 2019;120(6):10351–10362. doi:10.1002/jcb.2831930565747
- Gonçalves-Ribeiro S, Sanz-Pamplona R, Vidal A, et al. Prediction of pathological response to neoadjuvant treatment in rectal cancer with a two-protein immunohistochemical score derived from stromal gene-profiling. Ann Oncol. 2017;28(9):2160–2168. doi:10.1093/annonc/mdx29328911071
- Yip A, Horvath S. Gene network interconnectedness and the generalized topological overlap measure. BMC Bioinformatics. 2007;8(1):22. doi:10.1186/1471-2105-8-2217250769
- Botía J, Vandrovcova J, Forabosco P, et al. An additional k-means clustering step improves the biological features of WGCNA gene co-expression networks. BMC Syst Biol. 2017;11(1):47. doi:10.1186/s12918-017-0420-628403906
- Huang Da W, Sherman B, Lempicki R. Systematic and integrative analysis of large gene lists using DAVID bioinformatics resources. Nat Protoc. 2009;4(1):44–57. doi:10.1038/nprot.2008.21119131956
- Szklarczyk D, Franceschini A, Kuhn M, et al. The STRING database in 2011: functional interaction networks of proteins, globally integrated and scored. Nucleic Acids Res. 2011;39:D561–D568. doi:10.1093/nar/gkq97321045058
- Su G, Morris J, Demchak B, Bader G. Biological network exploration with Cytoscape 3. Curr Protoc Bioinformatics. 2014;47(1):8–13. doi:10.1002/0471250953.bi0813s4725199793
- Lee IH, Kang K, Kang BW, et al. Genetic variations using whole-exome sequencing might predict response for neoadjuvant chemoradiotherapy in locally advanced rectal cancer. Med Oncol. 2018;35(11):145. doi:10.1007/s12032-018-1202-830206710
- Cho E, Park IJ, Yeom SS, et al. A multigene model for predicting tumor responsiveness after preoperative chemoradiotherapy for rectal cancer. Int J Radiat Oncol Biol Phys. 2019;105(4):834–842. doi:10.1016/j.ijrobp.2019.07.05831419511
- Sun M, Sun T, He Z, Xiong B. Identification of two novel biomarkers of rectal carcinoma progression and prognosis via co-expression network analysis. Oncotarget. 2017;8(41):69594–69609. doi:10.18632/oncotarget.1864629050227
- Koyama F, Lopes Ramos C, Ledesma F, et al. Effect of Akt activation and experimental pharmacological inhibition on responses to neoadjuvant chemoradiotherapy in rectal cancer. Br J Surg. 2018;105(2):e192–e203. doi:10.1002/bjs.1069529341150
- Dycka F, Bobal P, Mazanec K, Bobalova J. Rapid and efficient protein enzymatic digestion: an experimental comparison. Electrophoresis. 2012;33(2):288–295. doi:10.1002/elps.20110012322170586
- Gómez Del Pulgar T, Cebrián A, Fernández-Aceñero M, et al. Focal adhesion kinase: predictor of tumour response and risk factor for recurrence after neoadjuvant chemoradiation in rectal cancer. J Cell Mol Med. 2016;20(9):1729–1736. doi:10.1111/jcmm.1287927171907
- Forrester HB, Li J, Leong T, Mckay MJ, Sprung CN. Identification of a radiation sensitivity gene expression profile in primary fibroblasts derived from patients who developed radiotherapy-induced fibrosis. Radiother Oncol. 2014;111(2):186–193. doi:10.1016/j.radonc.2014.03.00724835153
- Kurtul N, Tasdemir EA, Unal D, Izmirli M, Eroglu C. SPARC: as a prognostic biomarker in rectal cancer patients treated with chemo-radiotherapy. Cancer Biomark. 2017;18(4):459–466. doi:10.3233/CBM-16173328009327
- Zhang W, Ge Y, Cheng Q, Zhang Q, Fang L, Zheng J. Decorin is a pivotal effector in the extracellular matrix and tumour microenvironment. Oncotarget. 2018;9(4):5480–5491. doi:10.18632/oncotarget.2386929435195
- Henke A, Grace OC, Ashley GR, et al. Stromal expression of decorin, Semaphorin6D, SPARC, Sprouty1 and Tsukushi in developing prostate and decreased levels of decorin in prostate cancer. PLoS One. 2012;7(8):e42516. doi:10.1371/journal.pone.004251622880013
- S J L, Chen DL, Zhang WB, Shen C, Che GW. Prognostic value of stromal decorin expression in patients with breast cancer: a meta-analysis. J Thorac Dis. 2015;7(11):1939–1950. doi:10.3978/j.issn.2072-1439.2015.11.2926716032
- Zlajpah M, Hauptman N, Bostjancic E, Zidar N. Differential expression of extracellular matrixrelated genes DCN, EPHA4, FN1, SPARC, SPON2 and SPP1 in colorectal carcinogenesis. Oncol Rep. 2019;42:1539–1548.
- Nam JM, Chung Y, Hsu HC, Park CC. beta1 integrin targeting to enhance radiation therapy. Int J Radiat Biol. 2009;85(11):923–928. doi:10.3109/0955300090323287619895268
- Lopes-Ramos C, Koyama FC, Habr-Gama A, et al. Comprehensive evaluation of the effectiveness of gene expression signatures to predict complete response to neoadjuvant chemoradiotherapy and guide surgical intervention in rectal cancer. Cancer Genet. 2015;208(6):319–326. doi:10.1016/j.cancergen.2015.03.01025963525
- Guo Y, Jiang W, Ao L, et al. A qualitative signature for predicting pathological response to neoadjuvant chemoradiation in locally advanced rectal cancers. Radiother Oncol. 2018;129(1):149–153. doi:10.1016/j.radonc.2018.01.01029402470
- Campayo M, Navarro A, Benitez JC, et al. miR-21, miR-99b and miR-375 combination as predictive response signature for preoperative chemoradiotherapy in rectal cancer. PLoS One. 2018;13(11):e206542. doi:10.1371/journal.pone.0206542