
Abstract
Background
MicroRNAs (miRNAs) function as important regulators of gene expression involved in tumor pathogenesis, including retinoblastoma. However, the expression profiles and potential roles in retinoblastoma are still largely unclear.
Material and Methods
Differentially expressed miRNAs (DEmiRs) and genes (DEGs) in retinoblastoma were extracted from Gene Expression Omnibus (GEO) repository. Expression levels of miR-340 and WIF1 were detected in retinoblastoma tissues and cell lines by qRT-PCR. Both gain-of-function and loss-of-function experiments were performed to explore the effects of miR-340 on cell proliferation, migration and invasion. Bioinformatics analysis and luciferase reporter assay were used to explore the interaction between miR-340 and WIF1.
Results
A total of 11 DEmiRs were identified in retinoblastoma tissue and blood samples. Among them, we validated that miR-340 was the most highly expressed miRNA and correlated with tumor size, ICRB stage and optic nerve invasion. miR-340 was observed to enhance the proliferation, migration and invasion capacity of retinoblastoma cells. We then identified 26 DEGs from 3 retinoblastoma GEO datasets and subsequently constructed a miRNA–mRNA regulatory network. Further analysis revealed that WIF1 was a direct target of miR-340. Moreover, overexpression of WIF1 could repress retinoblastoma progression induced by miR-340 in vitro and in vivo.
Conclusion
Collectively, miR-340 functioned as an oncomiRNA to promote retinoblastoma cell proliferation, migration and invasion via regulating WIF1. Our data also provided multiple miRNAs and genes that may contribute to a better understanding of retinoblastoma pathogenesis.
Introduction
Abnormally expressed microRNAs (miRNAs) have critical roles in the cancer initiation and progression through degrading or repressing target genes post-transcriptionally.Citation1,Citation2 They could serve as oncogenes or tumor suppressors to regulate various biological processes, such as tumor growth, metastasis, apoptosis, stemness, autophagy and chemoresistance.Citation3,Citation4 Hence, understanding the molecular basis of individual miRNAs will facilitate the diagnosis and targeted therapy for cancer treatment.
miR-340 was first reported to be highly expressed in gastric cancer tissues compared with non-tumorous tissues in 2009.Citation5 Later, however, Guled et al found that miR-340 was severely down-regulated in malignant mesothelioma.Citation6 Recent studies demonstrated that miR-340 suppressed proliferation, invasion and migration in gallbladder carcinoma via targeting NT5E, inhibited metastasis by targeting EphA3 in cervical cancer and blocked proliferation and promoted apoptosis through targeting DcR3 in hepatocellular carcinoma.Citation7–Citation9 The above-mentioned findings suggest that miR-340 functions as a tumor suppressor in tumorigenesis. Meanwhile, other studies had shown contrary conclusions. In thyroid cancer, miR-340 was up-regulated and promoted cell proliferation by decreasing BMP4.Citation10 miR-340 was also observed to enhance the tumor growth by reducing CCNG2 expression in gastric cancer.Citation11 Sueta et al found that miR-340 was up-regulated in breast cancer patients with recurrence.Citation12 Overall, the potential role of miR-340 is very complex in human cancer.
Retinoblastoma is a common malignant intraocular tumor among children.Citation13 Although there is great improvement in the treatment strategies, the survival rate of retinoblastoma patients remains lower than 30% in some developing countries.Citation14 Several miRNAs have been implicated in retinoblastoma, such as miR-29a, miR-98 and miR-183.Citation15–Citation17 However, the expression profile and function of miR-340 in retinoblastoma have not been elucidated.
Gene Expression Omnibus (GEO) is an international public repository that stores gene expression profiles from microarray and high-throughput sequencing genomics data.Citation18 In this study, we identified many differentially expressed miRNAs (DEmiRs) and genes (DEGs) in retinoblastoma from GEO datasets and constructed a miRNA–mRNA interaction network. We confirmed that miR-340 was highly expressed in retinoblastoma tissues and cell lines, and up-regulated miR-340 correlated with poor prognosis. Furthermore, we found that miR-340 promoted retinoblastoma cell proliferation, migration and invasion through targeting WIF1.
Materials and Methods
Cell Cultures and Patient Tissues
Human retinoblastoma cell lines WERI-RB1, SO-RB50, Y79 and human retinal pigment epithelial cell line ARPE-19 were purchased from ATCC and cultured in RPMI 1640 medium (Gibco, Carlsbad, CA, USA) supplemented with 10% FBS (Gibco) at 37 °C containing 5% CO2. Fifty-eight retinoblastoma tissue samples and twelve normal retina tissues were obtained from Cangzhou Central Hospital. All of the patients were restaged according to the 8th edition of the American Joint Committee on Cancer (AJCC). The detailed clinical pathology of retinoblastoma patients was shown as Supplementary Table 1. All protocols were approved by the institutional research committee of Cangzhou Central Hospital (NO. 20120019) and conducted in accordance with the Declaration of Helsinki. Written informed consent was obtained from each patient.
Cell Transfection
Synthesized miR-340 inhibitor, miR-340 mimics and its scrambled negative control (inhibitor NC and mimics NC), WIF1-overexpressing plasmid (pcDNA-WIF1 and pcDNA-NC) and lentiviruses containing human miR-340 (LV-miR-340 and LV-NC) were obtained from RiboBio (Guangzhou, China). Transfections were conducted using Lipofectamine 2000 (Invitrogen) according to the reagent protocol.
Cell Proliferation Analysis
Effects of miR-340 on cell proliferation were determined using cell counting kit-8 (CCK-8) assay, colony formation assay and 5-ethynyl-2′-deoxyuridine (EdU) incorporation assay. For CCK-8 assay, cells were cultured in 96-well plates at a density of 5×10³ cells/well. Cell numbers were evaluated over 5 days using CCK-8 reagent (Sigma). The absorbance at 450 nm was recorded using a microplate reader (BioTek). For EdU incorporation assay, cells were plated in 6-well plates. After 24 h incubation. Cells were treated with 50 mM EdU solution (RiboBio) for 2 h, fixed using 4% paraformaldehyde, stained with DAPI (Beyotime, Shanghai, China) and photographed under an Olympus FSX100 microscope. For colony formation assay, cells were seeded in 6-well plates at a density of 500 cells/well and cultured for 2 weeks. Then, the visible colonies were fixed and stained with 0.1% crystal violet (Sigma) for 10 min. Finally, colonies were counted under a microscope.
Wound Healing and Transwell Invasion Assay
For wound healing assay, cells were seeded in 6-well plate. Confluent cells were wounded with a 200 μL pipette tip and the detached cells were gently washed twice. Images were taken from an optical microscope system at 0 h and 24 h. For invasion assay, cells were seeded in the upper chamber with a Matrigel-coated membrane (BD Biosciences, San Jose, CA, USA). Medium supplemented with 10% FBS was added to the lower chamber. After incubation for 24 h, the cells migrated to the reverse side of inserts were stained with 0.1% crystal violet solution and imaged.
RNA Extraction and qRT-PCR
Total RNA was extracted by TRIzol (Invitrogen) method. cDNA was generated using the High-Capacity cDNA Reverse Transcription Kit (Applied Biosystems). qRT-PCR were performed using SYBR PrimeScript RT-PCR Kit (TaKaRa) on ABI 7900HT (Applied Biosystems). The relative expression levels of miR-340 and WIF1 were calculated using 2−ΔΔCT and normalized to U6 and β-actin, respectively. The following primer sequences were used for qRT-PCR:
miR-340-Forward: 5ʹ-TATAAAGCAATGAGACTGAT-3ʹ,
miR-340-Reverse: 5ʹ-GAACATGTCTGCGTATCTC-3ʹ,
WIF1-Forward: 5ʹ- GGTGCCGAAATGGAGGCTTTTG-3ʹ,
WIF1-Reverse: 5ʹ- GATGCAGAAACCAGGAGTCACAC-3ʹ
Western Blot
Cells were harvested and lysed in RIPA buffer (Beyotime). Proteins (30 µg) were separated via 10% SDS/PAGE gel and then transferred onto PVDF membranes (Millipore). The membranes were blocked in 5% nonfat milk and incubated with primary antibodies targeting WIF1 (Abcam, ab155101) overnight at 4 °C. Then, blots were incubated with horseradish peroxidase-conjugated secondary antibodies and visualized using an ECL detection system (Thermo Fisher Scientific). β-actin was used as endogenous control.
In vivo Xenograft Tumor Models
BALB/c nude mice (4–6 weeks old) were purchased from Beijing Vital River Experimental Animal Technology Co, Ltd. (Beijing, China). About 1×10⁷ LV-miR-340 and/or pcDNA-WIF1 overexpressing SO-RB50 cells were subcutaneously injected into the nude mice, respectively. The tumor volume was measured every 3 days by using digital calipers. After 4 weeks injection, mice were sacrificed and the tumors were weighted. Tumor volumes were calculated as follows: volume = (length×width2)/2. All experiments were approved by the Use Committee for Animal Care and performed in accordance with the institutional guidelines of Cangzhou Central Hospital (NO. 20190452).
Luciferase Reporter Assay
microRNA.org was used to predict miR-340 binding sites on the 3ʹUTR of WIF1. Wild type (wt) and mutant (mut) 3ʹUTR of WIF1 containing miR-340 binding sites were synthesized by GenePharma (Shanghai, China) and cloned into psicheck2 vector. Then, wt or mut luciferase vector was co-transfected with miR-340 mimics or miRNA negative control into the cells. After 48 h transfection, cells were harvested and the luciferase activity was detected with a Dual Luciferase Reporter Assay Kit (Promega).
Bioinformatics Analysis
miRNA profiles of retinoblastoma were obtained from GEO datasets GSE41321 and GSE7072.Citation19,Citation20 mRNA profiles of retinoblastoma were obtained from GEO datasets GSE97508, GSE110811 and GSE24673.Citation21 DEmiRs or DEGs were analyzed using GEO2R according to the criteria: P<0.05 and |log2 FC|>2. Heat maps were generated using MeV v4.8.1.Citation22 miRNA–mRNA interaction network was constructed using Cytoscape 3.4.0.Citation23
Statistical Analysis
All experiments were performed in triplicate. All data were expressed as the mean ± SD. Pearson correlation coefficient was used to assess the correlation between the expression level of miR-340 and WIF1. Kaplan–Meier method and Log rank test were used to construct survival curves. GraphPad Prism 5 software was used for all statistical analysis and P<0.05 was considered statistically significant.
Results
Identification of DEmiRs-Associated with Retinoblastoma
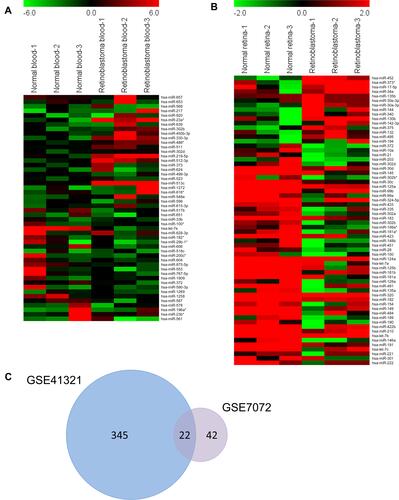
To identify the DEmiRs during retinoblastoma progression, we first analyzed retinoblastoma microarrays from GEO datasets GSE41321 (3 normal whole blood serum samples and 3 retinoblastoma whole blood serum samples) and GSE7072 (3 human normal retina tissues and 3 human retinoblastoma tissues). As shown in and , 367 and 64 DEmiRs were obtained from GSE41321 and GSE7072, respectively. Venn Diagram demonstrated that 22 DEmiRs were occurred in both retinoblastoma blood and tissue samples (). Among them, however, there were only 11 DEmiRs of whose expression levels exhibited the same pattern in the two datasets: 6 up-regulated miRNAs (miR-144, miR-194, miR-340, miR-375, miR-132 and miR-135b) and 5 down-regulated miRNAs (miR-372, miR-191, miR-99a, miR-181a* and miR-302a) in retinoblastoma samples compared with normal controls ().
Table 1 Differentially Expressed miRNAs-Associated Retinoblastoma Identified from GEO Datasets GSE41321 and GSE7072
Figure 1 Identification of DEmiRs-associated retinoblastoma. A total of 367 and 64 DEmiRs were identified from GEO datasets GSE41321 (3 normal whole blood serum samples and 3 retinoblastoma whole blood serum samples) and GSE7072 (3 human normal retina tissues and 3 human retinoblastoma tissues) using GEO2R according to the criterion: P<0.05 and |log2 FC|>2. Heat maps were generated using MeV v4.8.1. (A) Heat maps of top 25 up-regulated and 25 down-regulated miRNAs from GSE41321. (B) Heat maps of DEmiRs from GSE7072. (C) Venn diagram of overlapped DEmiRs.
High miR-340 Expression Was Correlated with Retinoblastoma Progression
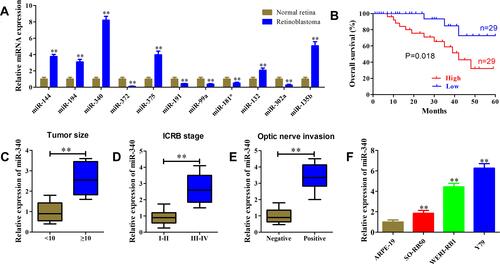
Next, we validated the expression levels of DEmiRs using our enrolled tissues. As shown in , miR-340 was the most highly expressed miRNA in retinoblastoma tissues in comparison with normal retina tissues. As miR-340 has not been reported in retinoblastoma, we selected miR-340 for further analysis in this study. Kaplan–Meier analysis demonstrated that higher miR-340 expression was significantly associated with worse overall survival of retinoblastoma patients (, P=0.018). We observed that miR-340 expression was positively correlated with large tumor size (), advanced ICRB stage () and optic nerve invasion (). Consistently, the correlation between miR-340 expression and pathological features was further confirmed by the univariate χ2 test (). qRT-PCR results also showed that miR-340 was up-regulated 1.85-fold, 4.43-fold and 6.26-fold in retinoblastoma cell lines SO-RB50, WERI-RB1 and Y79 compared with that of normal retina cell line ARPE-19, respectively ().
Table 2 Correlation of miR-340 Expression and Clinical Parameters in Patients with Retinoblastoma
Figure 2 High miR-340 expression was correlated with retinoblastoma progression. (A) Relative expression levels of DEmiRs were determined using qRT-PCR in 58 retinoblastoma tissue samples and 12 normal retina tissues. (B) Kaplan–Meier analysis of the relationship between miR-340 expression level and overall survival of retinoblastoma patients. (C–E) miR-340 expression level was significantly up-regulated in retinoblastoma patients with large tumor size (C), advanced ICRB stage (D) and optic nerve invasion (E). (F) Relative expression level of miR-340 in retinoblastoma cell lines and normal retina cell line was determined using qRT-PCR. **P<0.01.
miR-340 Promoted Retinoblastoma Cell Proliferation in vitro
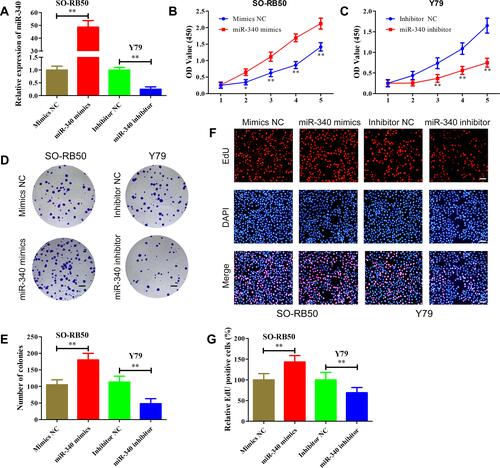
To determine the biological function of miR-340, gain-of-function and loss-of-function assays were performed by transfecting miR-340 mimics or miR-340 inhibitor into SO-RB50 and Y79 cells, respectively. The up-regulated and down-regulated expression levels of miR-340 were confirmed by qRT-PCR (). We applied CCK-8 assay to evaluate the effects of miR-340 on cell proliferation. Results showed that ectopic expression of miR-340 significantly increased the proliferative capacity in SO-RB50 cells, whereas silencing of miR-340 with its specific inhibitor substantially inhibited the growth of Y79 cells ( and ). Consistent with CCK-8 assay results, we observed a higher colony numbers of SO-RB50 cells after miR-340 overexpression compared with negative control, and vice versa in Y79 cells ( and ). Additionally, EdU incorporation assay demonstrated that up-regulation of miR-340 dramatically enhanced the percentage of EdU-positive cells and down-regulation of miR-340 led to the opposite effect ( and ). These results indicate that miR-340 could promote retinoblastoma cell proliferation.
Figure 3 miR-340 promoted retinoblastoma cell proliferation in vitro. (A) miR-340 expression level was determined using qRT-PCR in WERI-RB1and Y79 cells after transfection with miR-340 mimics or miR-340 inhibitor. (B and C) CCK-8 assay results showed that miR-340 mimics promoted SO-RB50 cells proliferation (B), while miR-340 inhibitor suppressed Y79 cells proliferation (C) compared with negative control. (D and E) Colony formation assay results showed that miR-340 overexpression increased the number of colonies in SO-RB50 cells (D), but miR-340 knockdown decreased the number of colonies in Y79 cells (E) compared with negative control. (F and G) EdU incorporation assay demonstrated that up-regulation of miR-340 dramatically enhanced the percentage of EdU-positive cells in SO-RB50 cells (F) and down-regulation of miR-340 reduced the percentage of EdU-positive cells in Y79 cells (G) with negative control. *P<0.05, **P<0.01. Scale bars, 100 μm.
miR-340 Enhances the Migration and Invasion Capacity of Retinoblastoma Cells
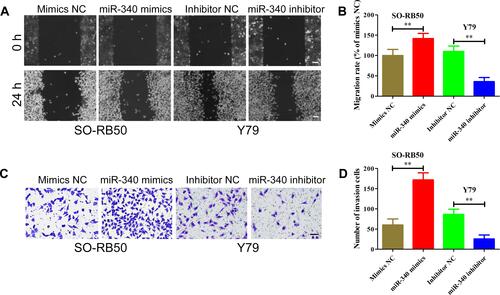
Because there was a strong association between miR-340 and retinoblastoma invasion in clinical samples, we explored the effects of miR-340 on retinoblastoma metastasis using wound healing assays and transwell invasion assays. As shown in and , ectopic expression of miR-340 promoted the SO-RB50 cells to close the gap in a wound healing assay in comparison with negative group. However, the ability to close the gap was suppressed by miR-340 knockdown in Y79 cells. Moreover, the transwell invasion assays showed more SO-RB50 cells penetrating the membrane of chambers after transfecting with miR-340 mimics than that of miRNA NC ( and ). An inversed phenotypic alteration was observed in Y79 cells after miR-340 knockdown. These findings suggest that miR-340 also play a crucial role in retinoblastoma metastasis.
Figure 4 miR-340 enhances the migration and invasion capacity of retinoblastoma cells. (A and B) Wound healing assays results showed that miR-340 mimics promoted migration of SO-RB50 cells, while miR-340 inhibitor suppressed migration of Y79 cells compared with negative control. (C and D) Transwell invasion assays results showed that miR-340 overexpression increased the number of invasive SO-RB50 cells, but miR-340 knockdown decreased the number of invasive Y79 cells compared with negative control. **P<0.01. Scale bars, 100 μm.
Identification of DEGs-Associated with Retinoblastoma
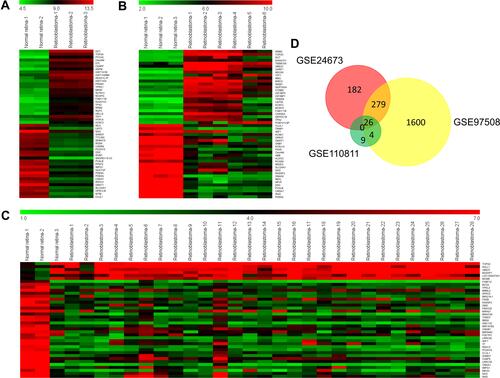
A miRNA always exerts biological roles through interacting with its target genes. To explore downstream target genes of miR-340, we analyzed the DEGs from retinoblastoma GEO datasets GSE24673 (2 human normal retina tissues and 3 human retinoblastoma tissues), GSE97508 (3 human normal retina tissues and 6 human retinoblastoma tissues) and GSE110811 (3 human normal retina tissues and 28 human retinoblastoma tissues). We identified 487, 1918 and 39 DEGs, respectively (–). A total of 26 genes were commonly occurred in the 3 datasets (). Among the 26 genes, 4 genes were up-regulated and 22 genes were down-regulated ().
Table 3 Expression Level of 26 Retinoblastoma-Associated DEGs in GEO Datasets GSE24673, GSE97508 and GSE110811
Figure 5 Identification of DEGs-associated with retinoblastoma. A total of 487, 1918 and 39 DEGs were obtained from GEO datasets GSE24673 (2 human normal retina tissues and 3 human retinoblastoma tissues), GSE97508 (3 human normal retina tissues and 6 human retinoblastoma tissues) and GSE110811 (3 human normal retina tissues and 28 human retinoblastoma tissues) using GEO2R according to the criterion: P<0.05 and |log2 FC|>2. Heat maps were generated using MeV v4.8.1. (A) Heat maps of top 25 up-regulated and 25 down-regulated genes from GSE24673. (B) Heat maps of top 25 up-regulated and 25 down-regulated genes from GSE97508. (C) Heat maps of DEGs from GSE110811. (D) Venn diagram of overlapped DEGs.
miR-340 Directly Targets WIF1
To further analyze the regulatory relationships between the DEmiRs and DEGs, we constructed a miRNA–mRNA network based on their expression levels and target interaction predicted using microRNA.org (). miR-340 was the common miRNA for 9 genes (CNGA1, YPEL2, PCDH15, FRZB, BBS9, BCO2, MBNL2, WIF1 and IMPG1) were predicted to contain putative-binding sites of miR-340. Next, we applied qRT-PCR to evaluate the influence of miR-340 on the expression levels of candidate genes. As shown in , WIF1 expression level was the most affected after miR-340 overexpression or knockdown in SO-RB50 and Y79 cells, respectively. These results indicate that WIF1 was the most candidate downstream target of miR-340.
Figure 6 miR-340 directly targets WIF1. (A) miRNA–mRNA network analysis. The regulatory relationship of miRNAs and genes was predicted using microRNA.org and then visualized using Cytoscape 3.4.0. This network contained 11 miRNAs and 26 genes. (B) Relative expression levels of 9 candidate target genes of miR-340 in WERI-RB1 after miR-340 overexpression or Y79 cells after miR-340 suppression. (C) The 3ʹUTR of WIF1 contained two binding sites of miR-340 predicted using microRNA.org. (D and E) Luciferase activity was measured in WERI-RB1 (D) and Y79 (E) cells co-transfected with miR-340 mimics or miRNA negative and wild type (wt) or mutant (mut) 3ʹUTR of WIF1. (F) qRT-PCR results showed that WIF1 mRNA expression level in retinoblastoma cell lines was significantly down-regulated compared with retinal pigment epithelial cell line ARPE-19. (G) qRT-PCR results showed that WIF1 mRNA expression level in retinoblastoma tissues was lower than normal retina tissues. (H) Pearson correlation analysis between miR-340 and WIF1. *P<0.05, **P<0.01.
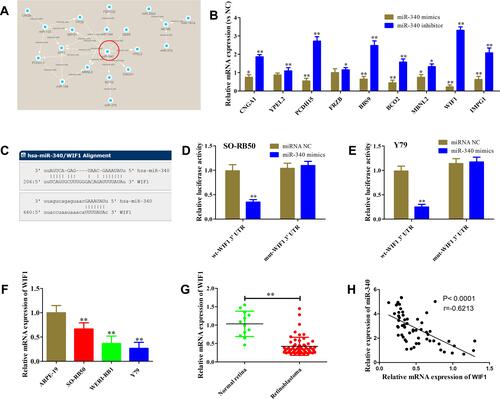
Subsequently, we constructed wt-WIF1 3ʹUTR and mut-WIF1 3ʹUTR reporter vectors that contained putative-binding sites to confirm the direct interaction between miR-340 and WIF1 3ʹUTR (). Luciferase reporter assays showed miR-340 mimics transfection resulted in a reduction of about 32% and 25% luciferase activity in WERI-RB1 and Y79 cells transfected with wt vector, but not mut vector ( and ). We also observed a significant decrease of WIF1 expression in retinoblastoma tissues and cell lines ( and ). Furthermore, Pearson correlation analysis revealed that miR-340 level in retinoblastoma tissues was inversely associated with WIF1 level (; r=−0.7224, P<0.0001). Taken together, our data imply that WIF1 is a direct target of miR-340 in retinoblastoma.
Overexpression of WIF1 Represses Retinoblastoma Progression Induced by miR-340 in vitro and in vivo
To confirm whether miR-340 promoted retinoblastoma cell proliferation, migration and invasion through regulating WIF1, miR-340 mimics or mimics NC and pcDNA-WIF1 or pcDNA-NC were co-transfected into SO-RB50 cells. Firstly, Western blot analysis was performed to validate WIF1 overexpression (). CCK-8 assay, colony formation assay and EdU incorporation assay results showed that miR-340 mimics suppressed cell proliferation. However, miR-340 mimics and pcDNA-WIF1 co-transfection significantly inhibited cell proliferation compared with miR-340 mimics and pcDNA-NC co-transfection (–). Besides, up-regulation of WIF1 also reversed the promotion of miR-340 overexpression-induced cell migration and invasion in SO-RB50 cells ( and ).
Figure 7 Overexpression of WIF1 represses retinoblastoma progression induced by miR-340 in vitro and in vivo. (A) WIF1 expression level was determined using Western blot in SO-RB50 cells transfected with pcDNA-WIF1 or pcDNA-NC. (B–D) CCK-8 assay (B), colony formation assay (C) and EdU incorporation assay results showed that co-transfection of miR-340 mimics and pcDNA-WIF1 inhibited cell proliferation compared with co-transfection of miR-340 mimics and pcDNA-NC in SO-RB50 cells. (E and F) Wound healing assays (E) and transwell invasion assays (F) up-regulation of WIF1 also reversed the promotion of miR-340 overexpression-induced cell migration and invasion in SO-RB50 cells. (G–I) About 1×10⁷ LV-miR-340 and/or pcDNA-WIF1 overexpressing SO-RB50 cells were subcutaneously injected into the nude mice respectively (n=6). After 4 weeks injection, mice were sacrificed and the tumors were weighted. (G) Representative images of surgically dissected tumors. (H) Tumor growth. (I) Tumor weight. *P<0.05, **P<0.01. Scale bars, 100 μm.
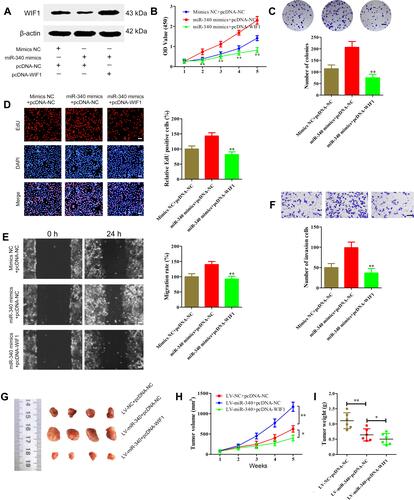
Finally, we performed an in vivo tumor growth experiment by subcutaneously injecting SO-RB50 cells stably LV-miR-340 and/or pcDNA-WIF1 into nude mice. Consistent with the in vitro findings, ectopic expression of miR-340 significantly promoted tumor growth compared with negative control group (–). Meanwhile, WIF1 overexpression eliminated the promotion impact of miR-340 on tumor growth. Altogether, these data support the idea that miR-340 promotes retinoblastoma progression by inhibiting WIF1 expression.
Discussion
Previous studies indicated that miR-340 exerted important biological roles in several human cancers, yet its function in retinoblastoma progression remains unclear.Citation5–Citation12 As mentioned above, miR-340 is suggested to play a complex role in tumorigenesis.
At present study, we identified 11 dysregulated miRNAs from GEO datasets, including miR-340. miR-340 expression level was confirmed to be up-regulated in retinoblastoma tissues and cell lines. Clinicopathological features illustrated that high level of miR-340 was positively associated with retinoblastoma progression. Functionally, we observed that miR-340 promoted retinoblastoma cell proliferation and metastasis. These findings strongly imply that miR-340 functions as an oncogene in retinoblastoma pathogenesis.
WIF1, a Wnt pathway inhibitor, is a classical tumor suppressor deregulated in various tumors. Previous studies demonstrated that WIF1 was involved in multiple biological processes, including tumor growth, metastasis, cell cycle, apoptosis and stemness.Citation24–Citation28 Frequent promoter hypermethylation of WIF1 was always associated with unfavorable prognosis in multiple human tumors.Citation29–Citation33 In addition, several non-coding RNAs were also reported to regulate WIF1 expression at transcriptional level, including HOXC6, HOTAIR, miR-181a, miR-552, miR-590-3p and miR-603.Citation34–Citation39 Based on bioinformatics analysis and mechanism investigations, WIF1 was verified to be responsible for miR-340-mediated accelerated proliferation and metastasis. According to miRNA–mRNA regulatory network, miR-194, miR-144 and miR-132 were also suggested to be candidate miRNAs that can directly target WIF1. Thus, our present study enriches our understanding of WIF1 regulation in the tumorigenesis and progression.
Integrative analysis of GEO datasets also identified several abnormally expressed genes, such as TOP2A, UBE2T, RASSF2 and NUSAP1. Recent studies indicated that high expression level of TOP2A was associated with poor prognosis.Citation40–Citation43 UBE2T acts as an oncogenic driver in several types of cancers, including hepatocellular carcinoma, gastric cancer, osteosarcoma, nasopharyngeal carcinoma and prostate cancer.Citation44–Citation48 Similar to WIF1, RASSF2 was frequently methylated inactivation and decreased RASSF2 was closely related to shorter survival.Citation49–Citation51 NUSAP1 could promote invasion and migration in cervical carcinoma, colorectal cancer and prostate cancer.Citation52–Citation54 These findings indicate that these dysregulated genes may also affect the development and progression of retinoblastoma. To date, however, their functional roles and clinical significance in retinoblastoma have not been established yet. Further studies of these identified genes will help to elucidate the new mechanisms underlying retinoblastoma pathogenesis.
Conclusion
To conclude, miR-340 acts as an oncogenic role in retinoblastoma to facilitate tumor growth and metastasis via regulating WIF1. More importantly, this integrated analysis of GEO datasets identified several useful biomarkers and potential therapeutic targets for retinoblastoma, which might be worthy for further investigations.
Disclosure
The authors declare no competing financial interests of this article.
References
- Garzon R, Fabbri M, Cimmino A, et al. MicroRNA expression and function in cancer. Trends Mol Med. 2006;12(12):580–587. doi:10.1016/j.molmed.2006.10.006
- Gregory RI, Shiekhattar R. MicroRNA biogenesis and cancer. Cancer Res. 2005;65(9):3509–3512. doi:10.1158/0008-5472.CAN-05-0298
- Chen CZ. MicroRNAs as oncogenes and tumor suppressors. N Engl J Med. 2005;353(17):1768–1771. doi:10.1056/NEJMp058190
- Shenouda SK, Alahari SK. MicroRNA function in cancer: oncogene or a tumor suppressor? Cancer Metastasis Rev. 2009;28(3–4):369–378. doi:10.1007/s10555-009-9188-5
- Guo J, Miao Y, Xiao B, et al. Differential expression of microRNA species in human gastric cancer versus non-tumorous tissues. J Gastroenterol Hepatol. 2009;24(4):652–657. doi:10.1111/j.1440-1746.2008.05666.x
- Guled M, Lahti L, Lindholm PM, et al. CDKN2A, NF2, and JUN are dysregulated among other genes by miRNAs in malignant mesothelioma -A miRNA microarray analysis. Genes Chromosomes Cancer. 2009;48(7):615–623. doi:10.1002/gcc.20669
- Wang N, Xiang X, Chen K, et al. Targeting of NT5E by miR-30b and miR-340 attenuates proliferation, invasion and migration of gallbladder carcinoma. Biochimie. 2018;146:56–67. doi:10.1016/j.biochi.2017.10.027
- Xiao H, Yu L, Li F, et al. MiR-340 suppresses the metastasis by targeting EphA3 in cervical cancer. Cell Biol Int. 2018;42(9):1115–1123. doi:10.1002/cbin.10974
- Xie L, Chen Z, Liu H, et al. Effects of miR-340 on hepatocellular carcinoma by targeting the DcR3 gene. Dig Liver Dis. 2018;50(3):291–296. doi:10.1016/j.dld.2017.10.024
- Zhao P, Ma W, Hu Z, et al. Up-regulation of miR-340-5p promotes progression of thyroid cancer by inhibiting BMP4. J Endocrinol Invest. 2018;41(10):1165–1172. doi:10.1007/s40618-018-0848-6
- Yin G, Zhou H, Xue Y, et al. MicroRNA-340 promotes the tumor growth of human gastric cancer by inhibiting cyclin G2. Oncol Rep. 2016;36(2):1111–1118. doi:10.3892/or.2016.4876
- Sueta A, Yamamoto Y, Tomiguchi M, et al. Differential expression of exosomal miRNAs between breast cancer patients with and without recurrence. Oncotarget. 2017;8(41):69934–69944. doi:10.18632/oncotarget.19482
- Al-Nawaiseh I, Jammal HM, Khader YS, et al. Retinoblastoma in Jordan, 2003–2013: ocular survival and associated factors. Ophthalmic Epidemiol. 2014;21(6):406–411. doi:10.3109/09286586.2014.967781
- Singh G, Daniels AB. Disparities in retinoblastoma presentation, treatment, and outcomes in developed and less-developed countries. Semin Ophthalmol. 2016;31(4):310–316. doi:10.3109/08820538.2016.1154177
- Liu S, Zhang X, Hu C, et al. miR-29a inhibits human retinoblastoma progression by targeting STAT3. Oncol Rep. 2018;39(2):739–746. doi:10.3892/or.2017.6144
- Guo L, Bai Y, Ji S, et al. MicroRNA‑98 suppresses cell growth and invasion of retinoblastoma via targeting the IGF1R/k-Ras/Raf/MEK/ERK signaling pathway. Int J Oncol. 2019;54(3):807–820. doi:10.3892/ijo.2019.4689
- Wang J, Wang X, Li Z, et al. MicroRNA-183 suppresses retinoblastoma cell growth, invasion and migration by targeting LRP6. FEBS J. 2014;281(5):1355–1365. doi:10.1111/febs.12659
- Barrett T, Wilhite SE, Ledoux P, et al. NCBI GEO: archive for functional genomics data sets–update. Nucleic Acids Res. 2013;41:D991–995. doi:10.1093/nar/gks1193
- Beta M, Venkatesan N, Vasudevan M, et al. Identification and insilico analysis of retinoblastoma serum microRNA profile and gene targets towards prediction of novel serum biomarkers. Bioinform Biol Insights. 2013;7:21–34. doi:10.4137/BBI.S10501
- Huang JC, Babak T, Corson TW, et al. Using expression profiling data to identify human microRNA targets. Nat Methods. 2007;4(12):1045–1049. doi:10.1038/nmeth1130
- Hudson LE, Mendoza P, Hudson WH, et al. Distinct gene expression profiles define anaplastic grade in retinoblastoma. Am J Pathol. 2018;188(10):2328–2338. doi:10.1016/j.ajpath.2018.06.013
- Saeed AI, Sharov V, White J, et al. TM4: a free, open-source system for microarray data management and analysis. Biotechniques. 2003;34(2):374–378. doi:10.2144/03342mt01
- Shannon P, Markiel A, Ozier O, et al. Cytoscape: a software environment for integrated models of biomolecular interaction networks. Genome Res. 2003;13(11):2498–2504. doi:10.1101/gr.1239303
- Ramachandran I, Thavathiru E, Ramalingam S, et al. Wnt inhibitory factor 1 induces apoptosis and inhibits cervical cancer growth, invasion and angiogenesis in vivo. Oncogene. 2012;31(22):2725–2737. doi:10.1038/onc.2011.455
- Wang R, Geng N, Zhou Y, et al. Aberrant Wnt-1/beta-catenin signaling and WIF-1 deficiency are important events which promote tumor cell invasion and metastasis in salivary gland adenoid cystic carcinoma. Biomed Mater Eng. 2015;26(Suppl 1):S2145–S2153. doi:10.3233/BME-151520
- Wu J, Fang J, Yang Z, et al. Wnt inhibitory factor-1 regulates glioblastoma cell cycle and proliferation. J Clin Neurosci. 2012;19(10):1428–1432. doi:10.1016/j.jocn.2011.12.023
- Huang Y, Du Q, Wu W, et al. Rescued expression of WIF-1 in gallbladder cancer inhibits tumor growth and induces tumor cell apoptosis with altered expression of proteins. Mol Med Rep. 2016;14(3):2573–2581. doi:10.3892/mmr.2016.5532
- Ramachandran I, Ganapathy V, Gillies E, et al. Wnt inhibitory factor 1 suppresses cancer stemness and induces cellular senescence. Cell Death Dis. 2014;5:e1246. doi:10.1038/cddis.2014.219
- Zhou Y, Li Z, Ding Y, et al. Promoter methylation of WNT inhibitory factor-1 may be associated with the pathogenesis of multiple human tumors. J Cancer Res Ther. 2018;14:S381–S387. doi:10.4103/0973-1482.235357
- Zhao Z, Liu W, Liu J, et al. The effect of EBV on WIF1, NLK, and APC gene methylation and expression in gastric carcinoma and nasopharyngeal cancer. J Med Virol. 2017;89(10):1844–1851. doi:10.1002/jmv.24863
- Lin B, Hong H, Jiang X, et al. WNT inhibitory factor 1 promoter hypermethylation is an early event during gallbladder cancer tumorigenesis that predicts poor survival. Gene. 2017;622:42–49. doi:10.1016/j.gene.2017.04.034
- Roperch JP, Incitti R, Forbin S, et al. Aberrant methylation of NPY, PENK, and WIF1 as a promising marker for blood-based diagnosis of colorectal cancer. BMC Cancer. 2013;13:566. doi:10.1186/1471-2407-13-566
- Lee SM, Park JY, Kim DS. Wif1 hypermethylation as unfavorable prognosis of non-small cell lung cancers with EGFR mutation. Mol Cells. 2013;36(1):69–73. doi:10.1007/s10059-013-0060-7
- Yan TF, Wu MJ, Xiao B, et al. Knockdown of HOXC6 inhibits glioma cell proliferation and induces cell cycle arrest by targeting WIF-1 in vitro and vivo. Pathol Res Pract. 2018;214(11):1818–1824. doi:10.1016/j.prp.2018.09.001
- Jiang Y, Li Z, Zheng S, et al. The long non-coding RNA HOTAIR affects the radiosensitivity of pancreatic ductal adenocarcinoma by regulating the expression of Wnt inhibitory factor 1. Tumour Biol. 2016;37(3):3957–3967. doi:10.1007/s13277-015-4234-0
- Ji D, Chen Z, Li M, et al. MicroRNA-181a promotes tumor growth and liver metastasis in colorectal cancer by targeting the tumor suppressor WIF-1. Mol Cancer. 2014;13:86. doi:10.1186/1476-4598-13-86
- Li C, Wang Z, Chen S, et al. MicroRNA-552 promotes hepatocellular carcinoma progression by downregulating WIF1. Int J Mol Med. 2018;42(6):3309–3317. doi:10.3892/ijmm.2018.3882
- Feng ZY, Xu XH, Cen DZ, et al. miR-590-3p promotes colon cancer cell proliferation via Wnt/β-catenin signaling pathway by inhibiting WIF1 and DKK1. Eur Rev Med Pharmacol Sci. 2017;21(21):4844–4852.
- Guo M, Zhang X, Wang G, et al. miR-603 promotes glioma cell growth via Wnt/β-catenin pathway by inhibiting WIF1 and CTNNBIP1. Cancer Lett. 2015;360(1):76–86. doi:10.1016/j.canlet.2015.02.003
- Sundov D, Petric Mise B, Mrklic I, et al. Prognostic significance of MAPK, Topo IIα and E-cadherin immunoexpression in ovarian serous carcinomas. Neoplasma. 2017;64(2):289–298. doi:10.4149/neo_2017_217
- Chen D, Maruschke M, Hakenberg O, et al. TOP2A, HELLS, ATAD2, and TET3 are novel prognostic markers in renal cell carcinoma. Urology. 2017;102:265. doi:10.1016/j.urology.2016.12.050
- An X, Xu F, Luo R, et al. The prognostic significance of topoisomerase II alpha protein in early stage luminal breast cancer. BMC Cancer. 2018;18(1):331. doi:10.1186/s12885-018-4170-7
- Zhou Z, Liu S, Zhang M, et al. Overexpression of topoisomerase 2-alpha confers a poor prognosis in pancreatic adenocarcinoma identified by co-expression analysis. Dig Dis Sci. 2017;62(10):2790–2800. doi:10.1007/s10620-017-4718-4
- Liu LP, Yang M, Peng QZ, et al. UBE2T promotes hepatocellular carcinoma cell growth via ubiquitination of p53. Biochem Biophys Res Commun. 2017;493(1):20–27. doi:10.1016/j.bbrc.2017.09.091
- Luo C, Yao Y, Yu Z, et al. UBE2T knockdown inhibits gastric cancer progression. Oncotarget. 2017;8(20):32639–32654. doi:10.18632/oncotarget.15947
- Wang Y, Leng H, Chen H, et al. Knockdown of UBE2T inhibits osteosarcoma cell proliferation, migration, and invasion by suppressing the PI3K/Akt signaling pathway. Oncol Res. 2016;24(5):361–369. doi:10.3727/096504016X14685034103310
- Hu W, Xiao L, Cao C, et al. UBE2T promotes nasopharyngeal carcinoma cell proliferation, invasion, and metastasis by activating the AKT/GSK3β/β-catenin pathway. Oncotarget. 2016;7(12):15161–15172. doi:10.18632/oncotarget.7805
- Wen M, Kwon Y, Wang Y, et al. Elevated expression of UBE2T exhibits oncogenic properties in human prostate cancer. Oncotarget. 2015;6(28):25226–25239. doi:10.18632/oncotarget.4712
- Guo W, Dong Z, Guo Y, et al. Decreased expression and frequent promoter hypermethylation of RASSF2 and RASSF6 correlate with malignant progression and poor prognosis of gastric cardia adenocarcinoma. Mol Carcinog. 2016;55(11):1655–1666. doi:10.1002/mc.22416
- Gharanei S, Brini AT, Vaiyapuri S, et al. RASSF2 methylation is a strong prognostic marker in younger age patients with Ewing sarcoma. Epigenetics. 2013;8(9):893–898. doi:10.4161/epi.25617
- Endoh M, Tamura G, Honda T, et al. RASSF2, a potential tumour suppressor, is silenced by CpG island hypermethylation in gastric cancer. Br J Cancer. 2005;93(12):1395–1399. doi:10.1038/sj.bjc.6602854
- Li H, Zhang W, Yan M, et al. Nucleolar and spindle associated protein 1 promotes metastasis of cervical carcinoma cells by activating Wnt/β-catenin signaling. J Exp Clin Cancer Res. 2019;38(1):33. doi:10.1186/s13046-019-1037-y
- Han G, Wei Z, Cui H, et al. NUSAP1 gene silencing inhibits cell proliferation, migration and invasion through inhibiting DNMT1 gene expression in human colorectal cancer. Exp Cell Res. 2018;367(2):216–221. doi:10.1016/j.yexcr.2018.03.039
- Gordon CA, Gong X, Ganesh D, et al. NUSAP1 promotes invasion and metastasis of prostate cancer. Oncotarget. 2017;8(18):29935–29950. doi:10.18632/oncotarget.15604