
Abstract
Purpose
Prostate cancer is the most common malignant urinary tumor among men. Treatments are currently unsatisfactory for advanced prostate cancer. Cancer biology remains the basis for developing new antitumor drugs. Therefore, it is crucial to study the metabolic reprogramming, immune microenvironment, and immune evasion of tumors. This study aimed to clarify the relationship between tumor glycolysis and immune function in prostate cancer.
Materials and Methods
We downloaded the gene expression matrix and clinical data of prostate cancer from The Cancer Genome Atlas. We studied the expression profiles and prognostic significance of glycolysis-related genes and used CIBERSORT to identify the proportion of tumor-infiltrating immune cells. Through differential gene expression analysis, gene ontology analysis, Kyoto Encyclopedia of Genes and Genomes analysis, gene set enrichment analysis, and correlation analysis, we further explored the relationship between glycolytic activity and immune function. We also performed immunohistochemistry, Western blot and RT-qPCR experiments using human prostate cancer tissue and cell lines to verify the expression of some glycolytic genes, macrophage infiltration and polarization.
Results
Among glycolysis-related genes, the expression of SLC16A3 in prostate cancer tissues was lower than that in normal tissues, but its high expression was associated with poor prognosis. In the high SLC16A3 expression group, several glycolysis-related genes also showed high expression, which was confirmed by immunohistochemistry experiments and Western blot. In high-glycolysis group, the expression of immune-related genes and the interleukin-17 (IL-17) signaling pathway were upregulated. CD8+ T cells, regulatory T cells, macrophages, and other immune cells were highly enriched. Among them, M2 macrophage infiltration was associated with poor prognosis.
Conclusion
The enhanced glycolytic activity of prostate cancer may contribute to the formation of a pro-tumor immune microenvironment. The IL-17 signaling pathway may play an important mediating role in the interaction between tumor glycolysis and immune function.
Introduction
Prostate cancer is a malignant tumor of the urinary system in men with high incidence. In 2018, there were about 1.3 million new cases of prostate cancer worldwide, resulting in 359,000 deaths and making it the fifth leading cause of cancer death.Citation1 Prostate cancer is the most common malignant tumor and the second leading cause of death in the United States, accounting for 174,650 estimated new cases and 31,620 estimated deaths in 2019.Citation2 In China, with the increasing use of ultrasound-guided prostate biopsy, the incidence of prostate cancer has increased sharply,Citation3 with an estimated 72,000 new cases and 31,000 deaths in 2015.Citation4 Compared with other malignant tumors, the progression of prostate cancer is relatively slow, resulting in a 5-year survival rate of > 80%.Citation5,Citation6 However, although hormone deprivation therapy can inhibit progression of advanced prostate cancer, this effect cannot be sustained for a long time. Since then, the serum level of prostate-specific antibody rises rapidly again, and the tumor progresses to the stage of castration-resistant prostate cancer (CRPC), which eventually leads to death.
The metabolism reprogramming is an important sign of cancer. Most cancer cells exhibit an increase in glucose consumption and glycolysis rate and the formation of the final product lactate, even in aerobic conditions. This phenomenon is called “Warburg effect”,Citation7,Citation8 which provides cancer cells with multiple survival advantages and regulates the metabolism and function of neighboring cells in the tumor microenvironment (TME). However, the phenomenon called the “reverse Warburg effect” also exists. Some cancer cells may exhibit oxidative phenotype, while stromal cells can become glycolytic. The two kinds of cells work together to boost tumor progression.Citation9 Regardless of the metabolism mode, lactate is an important mediator of metabolic interaction between cancer cells and TME.Citation10 Early prostate cancer tends to enhance oxidative phosphorylation and fat production but limit glycolysis. However, with tumor development, prostate cancer cells begin to exhibit the Warburg effect. As tumor aerobic glycolysis promotes malignant transformation and tumor progression, it has a potential significance for prognosis judgement and cancer treatment.Citation11–Citation14
As an important part of the TME, tumor-infiltrating immune cells (TIICs) can change the immune microenvironment of tumors. Studies have shown that TIICs can interact with tumor cells and influence carcinogenesis and tumor progression, which makes targeting TIICs a promising method of antitumor therapy.Citation15,Citation16 The interaction between prostate cancer and TIIC has been proved by experiments. Nardone et al found that in prostate cancer patients who underwent salvage radiotherapy after biochemical recurrence, the expression of FoxP3, CCR7, or PD-1 by tumor-infiltrating T lymphocytes was associated with progression-free survival and overall survival.Citation17 Erlandsson et al reported that a large number of M2 macrophages in the prostate cancer microenvironment increased the probability of prostate cancer mortality.Citation18
The highly acidic microenvironment caused by tumor glycolysis may affect the infiltration of immune cells, ultimately severely damaging the function of the immune system itself and promoting the growth, dissemination, and immune escape of primary tumors.Citation19,Citation20 In in vitro experiments, lactate could damage the maturation and differentiation of dendritic cells (DCs) and induce a suppressor phenotype.Citation21,Citation22 In vitro experiments also proved that an acidic pH can inhibit T cell responses, including the elimination of IFN-γ and TNF-α secretion.Citation23 However, based on clinical data in prostate cancer research, there are few comprehensive analyses of the relationship between tumor glycolysis, TIICs, and clinical characteristics. This study, therefore, aimed to investigate the status of glycolysis and immunity in prostate cancer using transcriptome and clinical data from The Cancer Genome Atlas (TCGA) project, to identify the relationship between tumor glycolysis and TIICs and reveal the potential role of TIICs in the prognosis of prostate cancer.
Materials and Methods
Data Preparation for Preprocessing Transcriptome and Clinical Data
Overall gene expression profiles and clinical data of patients were downloaded from the TCGA database (https://portal.gdc.cancer.gov/). We implemented a multi-array average algorithm and preprocessed the raw data. We then used the voom method to convert mRNA sequencing data to a microarray result.Citation24 Furthermore, we used “limma” package of R to standardize the mRNA sequencing results. Subsequently, further analysis was performed with 15,514 gene expression datasets obtained from 52 normal tissue samples and 498 tumor tissues. Clinicopathological data, such as tumor stage, Gleason grade, survival status, and survival time, were obtained from the TCGA database.
Differentially Expressed Genes and Enriched Pathways in Prostate Cancer
The tumor samples were divided into low-glycolysis and high-glycolysis groups based on the median expression of SLC16A3. The differential gene expression analysis was obtained by using limma R package. Heatmap and volcano map were used to display differentially expressed genes (DEGs). The threshold of DEGs was |log2FC|≥1, with the adjusted P-value was <0.05. The exception was that when obtaining DEGs related to glycolysis between normal and tumor samples, the threshold of DEGs was |log2FC|≥0.6. DAVID (https://david.ncifcrf.gov/) was used for gene ontology (GO) analysis and Kyoto Encyclopedia of Genes and Genomes (KEGG) analysis.Citation25 Gene set enrichment analysis (GSEA) based on WebGestalt (http://www.webgestalt.org/),Citation26 with a false discovery rate (FDR) of <0.05 as the cutoff criterion, was performed to determine the specific signal pathway between the above two groups.
Enumeration of TIICs
CIBERSORT is an analytical tool that can use gene expression characteristics of 547 genes to estimate the abundance of cell types in mixed cell populations.Citation27 It describes the characteristics of each immune cell subtype and uses a deconvolution algorithm to accurately quantify the different immune cell components. In this study, the LM22 signature file including 22 immune cell subtypes was used to illustrate the immune infiltration of each sample. After analyzing the differential gene expression profile on the CIBERSORT web (http://cibersort.stanford.edu), we obtained the distribution of 22 TIIC subtypes and the correlation coefficients, P-values, and root mean square errors (RMSEs).
Patients and Specimens
Human prostate cancer tissues were obtained from 60 patients of the Shenzhen University General Hospital between January 2018 and December 2020. All research procedures were approved by the Medical Ethical Committee of Shenzhen University Medical School according to the Declaration of Helsinki. The informed consents were obtained from all patients before tissue specimen collection.
Cell Culture
Human prostate cancer cell line PC3 and RAW246.7 macrophages were purchased from BeNa Culture Collection (Beijing, China). PC3 cells and RAW246.7 macrophages were cultured in PRMI 1640 medium (Invitrogen, Gaithersburg, MD, USA) containing 10% fetal bovine serum (Invitrogen, USA) under the condition of 37°C and 5% CO2. IL-4 (10 ng/mL) was used to stimulate RAW246.7 macrophages to obtain anti-inflammatory macrophages (M2),Citation28 while control macrophages (M0) were cultured in medium alone. Pro-inflammatory macrophages (M1) were induced by treating RAW246.7 macrophages with 50 ng/mL interferon (IFN)-γ and 10 ng/mL lipopolysaccharide (LPS).Citation29
PC3 Cell Transfection of siRNA Adenovirus
PC3 cell lines were transfected with adenovirus vector packed with siRNA-MCT4 (RiboBio Corporation, Guangzhou, China), and polycoagulant amine (RiboBio Corporation, Guangzhou, China) was used as virus transfection efficiency enhancer. The specific sequence of interfering RNA fragment in siRNA-MCT4: 5ʹ-CCUACUCCGUCUACCUCUUTT-3ʹ (sense) and 5ʹ-AAGAGGUAGACGGAGUAGGTT-3ʹ (antisense); negative control (siRNA-NC) specific sequence: 5ʹ-UUCUCCGAACGUGUCACGUTT-3ʹ (sense) and 5ʹ-ACGUGACACGUUCGGAGAATT-3ʹ (antisense). The PC3 cell lines were laid on a 12-well plate and incubated overnight with 1mL culture medium in each well. After 24 hours of incubation, the culture medium was removed and the mixture of 1mL polycoagulant with culture medium was added to each well, and the concentration of polycondensed amine was 5 ug/mL. Adenoviral particles were melted on the ice and the virus transfection began after complete melting. Virus particles with 1×10⁷ viruses in each well were added to the culture medium to transfect cells. Then the 12-well plate was centrifuged at a low speed for 1.5 hours and incubated at 37°C for 24 hours. The culture medium was then removed and 1mL culture medium without polyamine was added to each well, and the cells were incubated overnight. After 4 days of culture, the cells were collected and cryopreserved.
PC3 and RAW264.7 Cocultured
Tumor-associated macrophages (TAMs) were obtained by incubating RAW246.7 macrophages with PC3 cells or si-MCT4-PC3 cells (PC3-TAM or si-MCT4-PC3-TAM).Citation30 We developed a co-culture model by seeding RAW246.7 macrophages (4×10⁴/well) in the lower chambers of the transwell plate with PC3 cells (1×10⁴/well) in the upper chambers. After co-culturing for 84 hours, RAW246.7 macrophages were collected and mRNA analysis was performed by real-time quantitative PCR.
Immunohistochemistry
Human prostate cancer tissues were cut into 3-mm sections. The paraffin sections were baked at 56°C for 2 h for dewaxing, boiled in citrate buffer to recover the antigen, and blocked with 3% hydrogen peroxide. Antibodies against monocarboxylate transporter 4 (MCT4) (dilution 1:200; ProteinTech Group, Chicago, IL, USA), PFKFB3 (dilution 1:100; Abcam, UK), ENO2 (dilution 1:300; Servicebio, Wuhan, China), and M2 macrophage marker CD163 (dilution 1:100; Servicebio, Wuhan, China) were used to detect protein expression at 4°C overnight, which was followed by incubation with HRP-conjugated secondary antibodies for 1 h at 37°C. The 3ʹ-diaminobenzidine kit (DAB; Dako Corporation, Carpinteria, CA, USA) was used for immune complex visualization. ImageJ software was used to measure the immunohistochemical staining intensity and the proportion of positive cells. Immunohistochemistry scores were independently evaluated by two doctors based on the method described in the article in a blinded manner.Citation31 Scores of 1+ and 2+ were considered as low expression, while scores of 3+, 4+, and 5+ were regarded as high expression.Citation25 The number of M2 macrophages was calculated for the entire tissue specimen under low magnification (×10).
Western Blotting
The cells were divided into siRNA interference group (si-MCT4 group), negative control group (si-NC group) and blank control group (NC group). The cells were harvested and lysed in RIPA Lysis and Extraction Buffer (Invitrogen, USA). The protein concentration of the lysate was determined by Pierce BCA protein assay kit (Thermo, Waltham, MA, USA). The lysate was electrophoretic on 8% SDS polyacrylamide gel and transferred to PVDF membrane (Millipore, Boston, MA, USA). The membrane was probed with the primary antibodies overnight at 4°C. The primary antibodies included MCT4 (dilution 1:1000; ProteinTech Group, Chicago, IL, USA), PFKFB3 (dilution 1:1000; Abcam, UK), ENO2 (dilution 1:1000; Servicebio, Wuhan, China) and β-actin (dilution 1:1000; CST, Boston, MA, USA). Then the membrane was incubated with the horseradish peroxidase-conjugated secondary antibodies (Zhongshan Jinqiao, Beijing, China) and scanned by Odyssey imaging system. The relative quantitative analysis was completed by lmageJ software, and the experiment was repeated three times.
Real-Time Quantitative PCR (RT-qPCR)
RNA was extracted from PC3 cells or macrophages by using Trizol reagent (Invitrogen, USA), and cDNA was generated by using RT-PCR kit (TaKaRa, Kyoto, Japan). Real-time quantitative PCR was performed by using the SYBR Green QuantiTect RT-PCR kit (Roche, South San Francisco, CA), and each of the samples was analyzed three times. The sequences of the primers used for RT-qPCR were shown as follows:
MCT4, 5ʹ-TTTTGCTGCTGGGCAACTTCTTCTG-3ʹ (sense) and 5ʹ-TCACGTTGTCTCGAAGCATGGGTTT-3ʹ (antisense);
CD206, 5ʹ-GGCGAGCATCAAGAGTAAAGA-3ʹ (sense) and 5ʹ-CATAGGTCAGTCCCAACCAAA-3ʹ (antisense);
Arg1, 5ʹ-TTTTTCCAGCAGACCAGCTT-3ʹ (sense) and 5ʹ-CATGAGCTCCAAGCCAAAGT-3ʹ (antisense);
iNOS, 5ʹ-GAAACGCTTCACTTCCAATG-3ʹ (sense) and 5ʹ-AATCCACAACTCGCTCCAA-3ʹ (antisense);
IL-6, 5ʹ-AACGATGATGCACTTGCAGA-3ʹ (sense) and 5ʹ-TGGTACTCCAGAAGACCAGAGG-3ʹ (antisense);
β-actin, 5ʹ-CTAAGGCCAACCGTGAAAAG-3ʹ (sense) and 5ʹ-GGTACGACCAGAGGCATACA-3ʹ (antisense).
Statistical Analysis
All analyses were performed using R version 3.6.3, and all statistical tests were two-sided. Differences in continuous data between the groups were compared using analysis of variance. Categorical data were analyzed using the chi-square test or Fisher’s exact test. The prognostic significance of genes was analyzed by using Cox proportional hazards regression model. Spearman correlation analysis was used to assess the potential correlations. The Kaplan-Meier method was used to estimate the disease-free survival rate, and the Log rank test to evaluate the differences between the groups. P<0.05 was considered statistically significant.
Results
Expression and Prognostic Significance of Glycolysis-Related Genes
We selected 45 glycolysis-related genes and compared the expression profiles of these genes between normal tissues and tumor tissues. Results were showed in the heatmap and volcano map ( and ). Compared with expression in normal prostate tissue, the expression of SLC2A9, ENO2, SLC2A4, SLC16A7, ALDOC, PFKFB3, LDHB, and SLC16A3 in tumor tissue decreased, while that of HK2, SLC16A8, and FBP1 increased.
Figure 1 Expression and prognostic significance of glycolysis-related genes in prostate cancer. (A) Heatmap analysis of expression levels of 45 glycolysis-related genes. (B) Volcano plot for differentially expressed glycolysis-related genes. (C and D) Univariate and multivariate Cox regression of glycolysis-related genes. (E) Kaplan-Meier analysis of disease-free survival comparing low and high SLC2A4 expression. (F) Kaplan-Meier analysis of disease-free survival comparing low and high SLC16A3 expression.
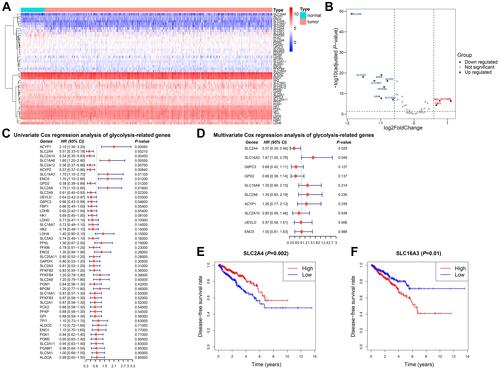
To find out the candidate glycolysis-related enzymes that may play an important role in the progression of prostate cancer, we investigated the relationship between clinical manifestations of prostate cancer and the expression of glycolysis-related genes. Univariate and multivariate Cox proportional hazards regression analyses were used to evaluate the gene-associated hazard ratio of disease-free survival. The results showed that SLC2A4 and SLC16A3 were independent risk factors for prostate cancer progression ( and ). According to the SLC2A4 or SLC16A3 expression, the 550 prostate cancer patients from TCGA were divided into two groups. Survival analysis showed that the disease-free survival time was significantly shortened in the group with high SLC16A3 expression, which clarified the prognostic value of SLC16A3 (). In contrast, the group with high SLC2A4 expression predicted better disease-free survival (). We also found that a high SLC16A3 expression was positively correlated with a higher Gleason grade and worse disease-free survival ().
Table 1 Clinical Characteristics of 489 Samples Base on SLC16A3 Expression
SLC16A3 Expression and Glycolytic Activity
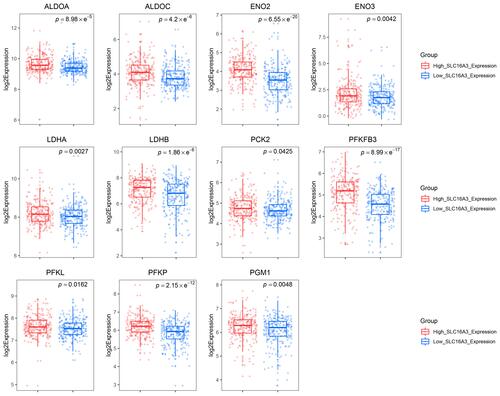
SLC16A3 belongs to the solute carrier 16 family of genes and encodes MCT4. MCT4 shows high affinity for lactate, but low affinity for pyruvate, which leads to the conversion of pyruvate to lactate before export, promotes the outflow of lactate from glycolysis cells, and maintains high glycolysis flux in tumor cells.Citation32 In view of the important role of SLC16A3 in glycolysis, we chose SLC16A3 for further studies. In order to further clarify whether the SLC16A3 expression can represent the level of glycolysis, we compared the expression of other glycolysis-related genes between the low SLC16A3 and high SLC16A3 expression group. The results demonstrated that PFKFB3, ALDOA, ALDOC, ENO2, ENO3, LDHA, LDHB, PCK2, PFKL, PFKP and PGM1 were significantly upregulated in the high SLC16A3 expression group (). All these genes are key genes in the glycolysis pathway. All above results suggested that SLC16A3 expression can reflect glycolytic activity, so the prostate cancer patients from TCGA can be divided into the low-glycolysis and high-glycolysis group according to the median expression of SLC16A3, respectively.
Figure 2 The expression of SLC16A3 can represent the glycolytic activity of prostate cancer to some extent. Box plots showed the expression of glycolysis-related genes ALDOA, ALDOC, ENO2, ENO3, LDHA, LDHB, PCK2, PFKFB3, PFKL, PFKP, and PGM1 in the low and high SLC16A3 expression groups.
Correlation Between Glycolytic Activity and Immune Function
To study the biological differences between the low- and high-glycolysis groups, we analyzed the profiles of 260 DEGs between the two groups, including 239 upregulated genes and 21 downregulated genes (). Many cytokines and inflammatory mediators in the high-glycolysis group were dysregulated and participated in the regulation of immune cell function ().
Figure 3 Correlation between glycolytic activity and immune function in prostate cancer. (A) Volcano plot for DEGs between the low- and high-glycolysis groups. (B) Heatmap analysis of dysregulated inflammation-related genes between the low- and high-glycolysis groups. (C and D) The top 20 most significant enrich Gene ontology (GO) and Kyoto Encyclopedia of Genes and Genomes (KEGG) terms with 260 DEGs analyses.
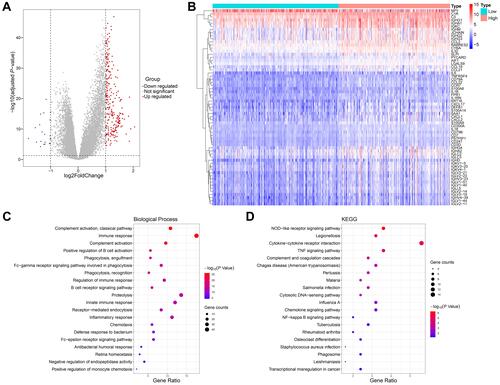
The enrichment analyses of GO and KEGG were carried out to reveal the gene functions and biological pathways. The functions related to immunity included GO:0006958 complement activation, classical pathway, GO:0006955 immune response, GO:0006956 complement activation, GO:0050871 positive regulation of B cell activation, GO:0006911 phagocytosis, engulfment, GO:0038096 Fc-gamma receptor signaling pathway involved in phagocytosis, GO:0006910 phagocytosis, recognition, GO:0050776 regulation of immune response, GO:0050853 B cell receptor signaling pathway, GO:0045087 innate immune response, GO:0006898 receptor-mediated endocytosis, GO:0006954 inflammatory response, GO:0006935 chemotaxis, GO:0042742 defense response to bacterium, GO:0038095 Fc-epsilon receptor signaling pathway, etc. (). The enriched signaling pathways were the hsa04621 NOD-like receptor signaling pathway, hsa04060 cytokine-cytokine receptor interaction, and hsa04668 TNF signaling pathway ().
Upregulation of Immune-Related Pathways
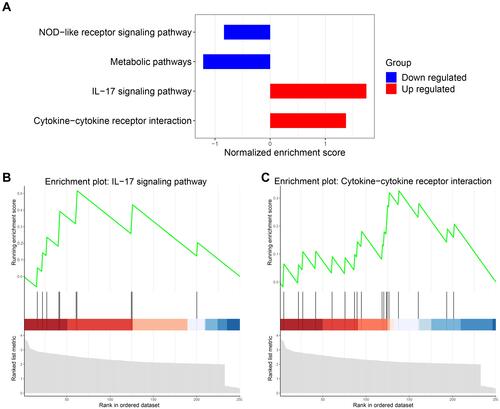
In view of the above findings, a GSEA study was performed to investigate the change of immune-related pathways in the high-glycolysis group. FDR of <0.05 was considered statistically significant. We found that two immune-related pathways were significantly upregulated, including the hsa04060 cytokine-cytokine receptor interaction and hsa04657 interleukin-17 signaling pathway (). Taken together, these findings indicated that high glycolytic activity was related to enhanced immune activity in prostate cancer.
Figure 4 Upregulation of immune-related pathways in the high-glycolysis group. (A) The downregulated and upregulated pathways were obtained through gene set enrichment analysis (GSEA). (B and C) The GSEA charts showed the interleukin-17 (IL-17) signaling pathway and cytokine-cytokine receptor interaction were significantly upregulated.
Relationship Between Glycolytic Activity and Immune Cell Infiltration
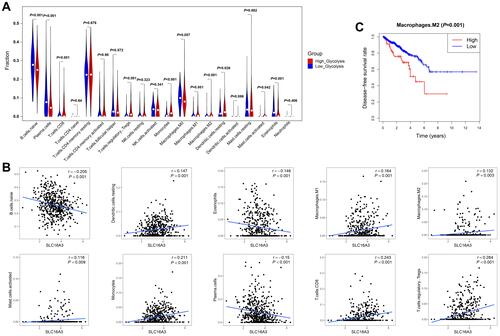
To verify the relationship between glycolytic activity and immune function, we compared the degree of enrichment of immune cell types in the low- and high-glycolysis groups. In the high-glycolysis group, the degree of enrichment of CD8+ T cells, Tregs, monocytes, M1 macrophages, M2 macrophages, resting DCs, and activated mast cells was significantly higher. In contrast, the degree of enrichment of naïve B cells, plasma cells, and eosinophils in the high-glycolysis group was lower than that in the low-glycolysis group (). Additionally, SLC16A3 expression was positively correlated with the proportion of resting DCs (r=0.147, P=0.001), M1 macrophages (r=0.164, P<0.001), M2 macrophages (r=0.132, P=0.003), activated mast cells (r=0.116, P=0.009), monocytes (r=0.211, P<0.001), CD8+ T cells (r=0.243, P<0.001), and Tregs (r=0.284, P<0.001), but negatively correlated with that of naïve B cells (r=−0.205, P<0.001), plasma cells (r=−0.15, P<0.001), and eosinophils (r=−0.146, P=0.001) (). To distinguish tumor-promoting from antitumor immune cells, survival analysis was carried out to investigate the relationship between the survival time and the enrichment fraction of immune cells. The results showed that M2 macrophages were highly enriched in the high-glycolysis group, which predicted poor disease-free survival in prostate cancer ().
Figure 5 Relationship between immune cell infiltration and glycolytic activity. (A) Violin plot showed the degree of enrichment of tumor-infiltrating immune cell subtypes between the low- and high-glycolysis groups. (B) Spearman correlation test was used to analyze the correlation between SLC16A3 expression and immune cell enrichment score. The Spearman correlation coefficients between SLC16A3 expression and naïve B cells, resting dendritic cells, eosinophils, M1 macrophages, M2 macrophages, activated mast cells, monocytes, plasma cells, CD8+ T cells, and regulatory T cells (Tregs) were remarkable. (C) Kaplan-Meier analysis showed that the group with highly enriched M2 macrophages had poorer disease-free survival rates.
Immunohistochemistry Results
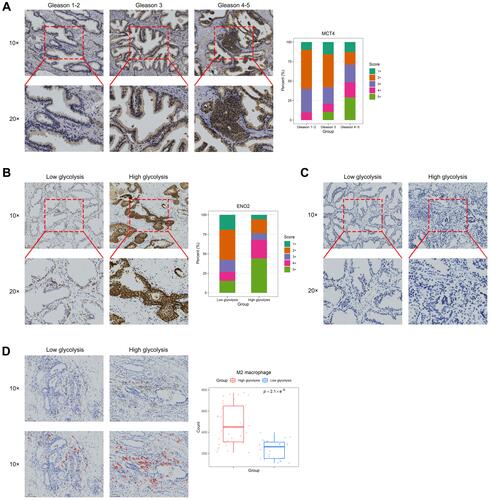
Considering that the high SLC16A3 expression was positively correlated with a higher Gleason grade, we evaluated the protein expression of MCT4 in human prostate cancer tissues. MCT4 expression was higher in tissues with a Gleason grade of 4–5 than in other tissues (). According to the expression score of MCT4, we defined the high- and low-expression groups in prostate cancer tissues as the high-glycolysis group and low-glycolysis group, respectively. Meanwhile, ENO2 protein expression was higher in the high-glycolysis group than in the low-glycolysis group (). However, there was no difference in PFKFB3 expression between both groups (). Immunohistochemical analysis of CD163 showed that M2 macrophages were mainly located in the stroma near the tumor cells. The number of M2 macrophages in prostate cancer was significantly higher in the high-glycolysis group than in the low-glycolysis group ().
Figure 6 Immunohistochemistry results of MCT4, ENO2, PFKFB3, and CD163. (A) Representative MCT4 immunohistochemical staining patterns in prostate cancer tissues and distribution of MCT4 immunohistochemical staining score in prostate cancer tissues according to Gleason grade. (B) Representative ENO2 immunohistochemical staining patterns in prostate cancer tissues and distribution of ENO2 immunohistochemical staining score in prostate cancer tissues according to glycolysis level. (C) Representative PFKFB3 immunohistochemical staining patterns in prostate cancer tissues. (D) Representative CD163 immunohistochemical staining patterns in prostate cancer tissues with red circles demonstrating the selection of CD163+ cells (M2 macrophages) under low magnification. Box plots showed the number of M2 macrophages in the low- and high-glycolysis groups in the entire prostate cancer tissue specimen.
Western Blot and RT-qPCR Results
Furthermore, we conducted verification experiments on PC3 cell lines. We successfully constructed the si-NC and si-MCT4 PC3 cells, which were confirmed by RT-qPCR, Western blot and fluorescence transfection experiments (, Supplementary Figure S1). The results () showed that the gene and protein expression level of MCT4 in PC3 cells in si-MCT4 group was both significantly lower than that in NC group and si-NC group (all P<0.001). The results suggested that the expression of MCT4 in PC3 cells decreased significantly after si-MCT4 transfection, and the PC3 cells silencing MCT4 were successfully established. The results of Western blot also showed that protein expression levels of ENO2 and PFKFB3 in PC3 cells in si-MCT4 group were significantly lower than those in si-NC group and NC group (P<0.001 and P<0.01, respectively). The results suggested that the inhibition of MCT4 could reduce the glycolysis level of PC3 cells to some extent.
Figure 7 The relative expressions of MCT4, ENO2 and PFKFB3 in PC3 cells and the relative gene expressions of Arg1, CD206, IL-6 and iNOS in macrophages. (A) RT-qPCR analysis of MCT4 gene expression of PC3 cells in NC group, si-NC group and si-MCT4 group. Western blot analysis of MCT4, ENO2 and PFKFB3 protein expressions of PC3 cells in NC group, si-NC group and si-MCT4 group. (B) Bar plots showed the gene expressions of Arg1, CD206, IL-6 and iNOS measured by RT-qPCR of macrophages in M0, M1, M2, PC3-TAM and si-MCT4-PC3-TAM groups.The data are presented as the mean ± SD values, and the error bars represent data from triplicate biological experiments. ns, P≥0.05; **P<0.01; ***P<0.001.
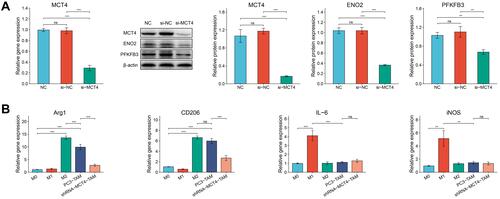
In order to determine whether PC3 cells and si-MCT4-PC3 cells could change the phenotype of co-cultured macrophages, we constructed M1 and M2 macrophages for further experiments. As seen in , the gene expressions of anti-inflammatory markers Arg1 and CD206 in macrophages induced by IL-4 were significantly increased (both P<0.001), while the gene expressions of pro-inflammatory markers IL-6 and iNOS were significantly increased in macrophages induced by IFN-γ/LPS compared with M0 macrophages (P<0.001 and P<0.01, respectively). Moreover, we cultured PC3 cells and RAW246.7 macrophages together in a transwell plate (Supplementary Figure S2). After macrophages were co-cultured with PC3 cells, the gene expressions of Arg1 and CD206 in macrophages increased significantly compared with M0 macrophages (both P<0.001), but not IL-6 or iNOS, which indicated that PC3 cells promoted M2 polarization of macrophages. Moreover, when we silenced the expression of MCT4 in PC3 cells, the gene expressions of CD206 and Arg1 in si-MCT4-PC3-TAM were significantly downregulated compared with PC3-TAM (both P<0.001). These results suggested that the expression of MCT4 in PC3 cells played an important role in inducing M2 phenotype of macrophages.
Discussion
Tumorigenesis depends on the reprogramming of cell metabolism, which is characterized by a markedly increased consumption of glucose to generate energy by glycolysis, even under conditions of sufficient oxygen. The metabolic state of tumor cells also affects other cells in the TME, such as tumor-related fibroblasts and immune cells. Metabolites derived from tumor cells can affect the activation and function of immune cells, which ultimately promote the survival, proliferation and resistance to anti-tumor therapy of tumor cells.Citation33 For example, in prostate cancer, circular RNA could promote tumor progression and radioresistance by upregulating glycolysis.Citation34 Therefore, it will be a promising treatment to reverse the metabolic state of tumor with drugs. Studies have shown that sulforaphane can prevent the occurrence of prostate cancer by inhibiting glycolysis and fatty acid metabolism.Citation35,Citation36 However, the search for key targets in the metabolic pathway may contribute more to precision treatment of prostate cancer. In this study, we demonstrated that SLC16A3, a key enzyme in the glycolysis pathway, was positively correlated with a higher Gleason grade and worse disease-free survival. The immunohistochemistry results also revealed that increased expression of MCT4, a plasma membrane transporter protein encoded by SLC16A3, correlated with a higher Gleason grade in prostate cancer tissues. The upregulation of glycolysis increases the levels of intracellular lactate and H+ ions, thus reducing the intracellular pH of tumor cells. To maintain the dynamic balance of pH and avoid the inhibition of glycolysis by negative feedback, lactate and H+ ions are excreted from the cytoplasm of tumor cells through monocarboxylate transporters, which leads to extracellular environment acidification.Citation37 The efflux of cellular lactate/H+ ions is thought to be mediated mainly by MCT4.Citation38 It has been demonstrated that MCT4 is upregulated in tumors and is associated with poor prognosis in several types of cancer,Citation39–Citation42 including prostate cancer.Citation43–Citation46 MCT4 promotes the invasion of prostate cancer cells by regulating the molecules related to the VEGF/CD147/MMP9 signaling pathway.Citation46 Knockdown of MCT4 inhibits glycolysis and tissue invasion/migration of prostate cancer cells.Citation44 MCT4-mediated efflux disturbance usually leads to decreased levels of pyruvic and/or lactate released by glycolysis cancer cells and increased levels of intracellular pyruvate and/or lactate, resulting in cytoplasmic acidification and inhibition of glycolysis.Citation32,Citation47 The above evidence indicates that SLC16A3 or MCT4 plays an important role in glycolysis. This study also confirmed that the expressions of some glycolysis-related genes were significantly higher in the high SLC16A3 expression group by immunohistochemistry and Western blot. Therefore, in this study, SLC16A3 expression was considered to represent glycolytic activity.
Many studies have been conducted on tumor glycolysis, but it remains unclear how glycolysis in prostate cancer affects its immune regulation. In this study, tumor tissues were divided into high-glycolysis and low-glycolysis groups according to the expression of SLC16A3. The gene expression profiles of the two groups were compared, and functional enrichment analyses were performed. The results demonstrated that in the high-glycolysis group, the expression of many cytokines and inflammatory mediators was upregulated. Further GSEA analysis revealed that the most abundant immune-related pathway in the high-glycolysis group was the IL-17 signaling pathway. IL-17 is a powerful pro-inflammatory cytokine, which has been proven to be closely related to the formation, growth, and metastasis of many types of malignant tumors.Citation48–Citation51 Chronic IL-17 activity results in the production of a population of pathogenic myeloid cells.Citation52 These myeloid cell populations play a key role in promoting the formation of pro-tumor immune microenvironment. In a series of murine cancer models, induction of IL-17-dependent pathogenic myeloid cells was associated with tumor progression, including breast cancer,Citation53 lung cancer,Citation50 colon cancer,Citation54 and liver cancer.Citation55 However, the specific mechanism by which glycolytic tumors affect the IL-17 signaling pathway remains unclear. Some studies have demonstrated that lactate from tumor cells would prompt CD4+ T cells to produce large amounts of IL-17, which in turn activates the IL-17 signaling pathway.Citation56–Citation58 Interestingly, the KEGG analysis also proved that the TNF signaling pathway was enriched in the high-glycolysis group. Previous study has found that IL-17 and TNF-α cooperatively promoted tumor glycolysis by regulating the expression of the glucose transporter SLC2A1 and hexokinase-2.Citation59 IL-17 may stabilize the target gene mRNA induced by TNF-α.Citation60 For the relationship between tumor glycolysis and IL-17 signaling pathways, further experimental studies are needed.
Many immune cell subgroups are essential for antitumor immunotherapy in the TME. Depending on their function and phenotype, immune cells can promote or hinder antitumor immune responses. Thus far, therapies based on immune checkpoints have not yet achieved ideal results in prostate cancer.Citation61 Therefore, it is particularly necessary to explore immune cell infiltration in the TME of prostate cancer and its relationship with glycolysis. In this study, we compared the enrichment of immune cells between the low- and high-glycolysis groups. According to the results, the degree of enrichment of CD8+ T cells, Tregs, monocytes, M1 macrophages, M2 macrophages, resting DCs, and activated mast cells was significantly higher, while that of naïve B cells, plasma cells, and eosinophils was significantly lower in the high-glycolysis group than in the low-glycolysis group. We found that the increased infiltration of immune cells in the high-glycolysis group did not lead to a good prognosis. It seemed that monocytes, macrophages, DCs, mast cells, and T lymphocytes established an immunosuppressive TME in prostate cancer. The existence of T lymphocytes in the TME is related to the prognosis and clinical significance of many types of cancer. Therefore, the density of CD8+ and CD3+ T cell infiltration at the tumor core and the invasive margin served as a basis for establishing a scoring system, known as the “Immunoscore”, to evaluate the tumor immune status.Citation62 Due to their cytotoxic function, CD8+ T cells are considered a key component of antitumor immunity. In many solid tumors, highly activated CD8+ T cell infiltration often indicates better prognosis.Citation63,Citation64 However, the correlation between CD8+ T cell infiltration and prognosis is controversial in prostate cancer. A study reported that the high infiltration of CD8+ T cell predicted shorter biochemical failure-free survival in prostate cancer patients.Citation65 Another study also found that a high proportion of CD8+ T cells was significantly associated with poor prognosis after examining the density of CD8+ T cells in 285 cases of prostate cancer.Citation66 An analysis of gene expression data from 1567 prostate cancer samples with long-term clinical results also demonstrated that high tumor CD8+ T cell infiltration was associated with poor distant metastasis-free survival.Citation67 In our study, we found that prostate cancer tissues in the high-glycolysis group with worse disease-free survival also had higher CD8+ T cell infiltration, which is consistent with the results of previous studies. Evidence has shown that the TME can inhibit CD8+ T cell immunity, resulting in exhaustion and dysfunction of CD8+ T cells.Citation68 Persistent antigen stimulation is the key factor leading to the exhaustion of CD8+ T cells. One of the main characteristics of exhaustion is the high level of co-expression of a variety of inhibitory receptors, including PD-1, CTLA-4 and others.Citation69 The exhaustion of CD8+ T cells finally suppresses its control of tumor. Therefore, high glycolysis of prostate cancer may indicate the exhaustion of CD8+ T cells infiltration, but the regulatory mechanism between them remains to be further elucidated.
In the TME, tumor cells with a highly glycolytic phenotype are likely to participate in metabolic competition with immune cells. The high level of lactate secreted by highly glycolytic tumor cells hinders the output of lactate by immune cells, thereby interfering with their metabolism and function.Citation70 Moreover, some immune cells may take up lactate, which impairs glycolytic function.Citation71 On this basis, a number of studies have shown that tumor-derived lactate inhibits the proliferation, motility, and cytotoxic activity of immune cells, which ultimately inhibits immune response to tumor cells.Citation56,Citation72,Citation73 Our results showed that the enrichment of M2 macrophages in the high-glycolysis group was significantly associated with poor disease-free survival in prostate cancer. Immunohistochemical experiment further confirmed that there were large amounts of M2 macrophage infiltration in prostate cancer tissue of high-glycolysis group. Moreover, we found that PC3 cells could promote M2 polarization of co-cultured macrophages and once MCT4 was knocked down, this function of PC3 cells was significantly weakened. This suggested that high glycolytic prostate cancer cells played an important role in promoting the phenotype induction of macrophages in TME. Previous studies have shown that lactate can induce phenotypic changes in macrophages, turning them into a tumor-promoting phenotype (M2-like). Lactate produced by bladder cancer cells induced M2 polarization of TAMs, while blockade of lactate flux between cancer cells and macrophages could inhibit the acquisition of this phenotype.Citation74 Similarly, in prostate cancer, the acidic TME enhances a series of functions associated with the M2 polarization of TAMs.Citation29 Although no further experiments were conducted to verify the effect of MCT4 expression in macrophages on M2 polarization in this article, an interesting study found that M2 macrophage polarization mainly depended on active oxidative phosphorylation rather than glycolysis.Citation75 We hypothesize that highly glycolytic prostate cancer cells export lactate to the TME through MCT4, which in turn inhibits glycolysis of macrophages. Macrophages then acquire energy through oxidative phosphorylation, which eventually induces M2 polarization. Even though highly glycolytic tumor cells are prone to cause acidity and immunosuppression in the TME,Citation10 further in vivo and in vitro experiments are still required to verify the mechanism of interaction between tumor glycolysis and TIICs. Our results based on public databases and bioinformatics should be interpreted with caution.
In summary, tumor glycolysis is closely related to the infiltration of immune cells in the TME. Since highly glycolytic tumors have higher immune cell infiltration, targeting tumor glycolysis may help to promote the efficacy of tumor immunotherapy by changing the function of immune cells and enhancing their antitumor immune response.Citation76
Furthermore, in view of the importance of MCT4 in glycolysis and tumorigenesis, MCT4 can serve as a potential therapeutic target for prostate cancer. Currently, there is no effective MCT4 inhibitor for treating malignant tumors in clinical applications. However, through the use of siRNA and antisense oligonucleotides for RNA interference experiments, it has been confirmed that inhibiting the expression of MCT4 can reduce tumor growth.Citation41,Citation44,Citation77 Therefore, the development of selective targeted inhibitors of MCT4 may become a new therapeutic strategy for malignant tumor.
Conclusion
This study revealed that the enhancement of glycolytic activity in prostate cancer was related to increased immune cell infiltration. The IL-17 signaling pathway may play an important regulatory role in the interaction between immune cell infiltration and tumor glycolysis. Infiltration of tumor-promoting immune cells can suppress antitumor immunity in prostate cancer with high level of glycolysis. Therefore, drugs targeting glycolysis may have the effect of inhibiting tumor growth. As an important enzyme in the glycolysis pathway, MCT4 is responsible for exporting lactate from tumor cells, thereby creating an acidic TME that may influence immune cell infiltration and function. Therefore, MCT4 plays a vital role in the development of prostate cancer, which made it a potential therapeutic target. However, since most of the results in this article were based on public database through bioinformatics, the interpretation of the results requires further experiments to verify.
Data Sharing Statement
All data reported in the manuscript are from the public database, and the website can be found in Materials and methods. There are no additional unpublished data from the study.
Acknowledgments
Thanks are due to Professor Fu for assistance with the experiments.
Disclosure
The authors report no conflicts of interest in this work.
Additional information
Funding
References
- Bray F, Ferlay J, Soerjomataram I, Siegel RL, Torre LA, Jemal A. Global cancer statistics 2018: GLOBOCAN estimates of incidence and mortality worldwide for 36 cancers in 185 countries. CA Cancer J Clin. 2018;68(6):394–424. doi:10.3322/caac.21492
- Siegel RL, Miller KD, Jemal A. Cancer statistics, 2019. CA Cancer J Clin. 2019;69(1):7–34. doi:10.3322/caac.21551
- Qi D, Wu C, Liu F, et al. Trends of prostate cancer incidence and mortality in Shanghai, China from 1973 to 2009. Prostate. 2015;75(14):1662–1668. doi:10.1002/pros.23046
- Zheng R, Sun K, Zhang S, et al. Analysis of the prevalence of malignant tumors in China in 2015. Chin J Oncol. 2019;41(1):19–28. doi:10.3760/cma.j.issn.0253-3766.2019.01.005
- De Angelis R, Sant M, Coleman MP, et al. Cancer survival in Europe 1999–2007 by country and age: results of EUROCARE–5-a Population-Based Study. Lancet Oncol. 2014;15(1):23–34. doi:10.1016/S1470-2045(13)70546-1
- Noone AM, Howlader N, Krapcho M, et al. SEER Cancer Statistics Review, 1975–2015. Bethesda, MD: National Cancer Institute; 2018.
- Warburg O, Wind F, Negelein E. The metaboliam of tumors in the body. J Gen Physiol. 1927;8(6):519–530. doi:10.1085/jgp.8.6.519
- Warburg O. On the origin of cancer cells. Science. 1956;123(3191):309–314. doi:10.1126/science.123.3191.309
- Pavlides S, Whitaker-Menezes D, Castello-Cros R, et al. The reverse Warburg effect: aerobic glycolysis in cancer associated fibroblasts and the tumor stroma. Cell Cycle. 2009;8(23):3984–4001. doi:10.4161/cc.8.23.10238
- Pereira-Nunes A, Afonso J, Granja S, Baltazar F. Lactate and lactate transporters as key players in the maintenance of the Warburg effect. Adv Exp Med Biol. 2020;1219:51–74.
- Cutruzzolà F, Giardina G, Marani M, et al. Glucose metabolism in the progression of prostate cancer. Front Physiol. 2017;8:97. doi:10.3389/fphys.2017.00097
- Eidelman E, Twum-Ampofo J, Ansari J, Siddiqui MM. The metabolic phenotype of prostate cancer. Front Oncol. 2017;7::131. doi:10.3389/fonc.2017.00131
- Bader DA, McGuire SE. Tumour metabolism and its unique properties in prostate adenocarcinoma. Nat Rev Urol. 2020;17(4):214–231. doi:10.1038/s41585-020-0288-x
- Pertega-Gomes N, Felisbino S, Massie CE, et al. A glycolytic phenotype is associated with prostate cancer progression and aggressiveness: a role for monocarboxylate transporters as metabolic targets for therapy. J Pathol. 2015;236(4):517–530. doi:10.1002/path.4547
- Yang Y. Cancer immunotherapy: harnessing the immune system to battle cancer. J Clin Invest. 2015;125(9):3335–3337. doi:10.1172/JCI83871
- Binnewies M, Roberts EW, Kersten K, et al. Understanding the tumor immune microenvironment (TIME) for effective therapy. Nat Med. 2018;24(5):541–550. doi:10.1038/s41591-018-0014-x
- Nardone V, Botta C, Caraglia M, et al. Tumor infiltrating T lymphocytes expressing FoxP3, CCR7 or PD-1 predict the outcome of prostate cancer patients subjected to salvage radiotherapy after biochemical relapse. Cancer Biol Ther. 2016;17(11):1213–1220. doi:10.1080/15384047.2016.1235666
- Erlandsson A, Carlsson J, Lundholm M, et al. M2 macrophages and regulatory T cells in lethal prostate cancer. Prostate. 2019;79(4):363–369. doi:10.1002/pros.23742
- Buck MD, Sowell RT, Kaech SM, Pearce EL. Metabolic instruction of immunity. Cell. 2017;169(4):570–586. doi:10.1016/j.cell.2017.04.004
- Gill KS, Fernandes P, O’Donovan TR, et al. Glycolysis inhibition as a cancer treatment and its role in an anti-tumour immune response. Biochim Biophys Acta. 2016;1866(1):87–105. doi:10.1016/j.bbcan.2016.06.005
- Gottfried E, Kunz-Schughart LA, Ebner S, et al. Tumor-derived lactic acid modulates dendritic cell activation and antigen expression. Blood. 2006;107(5):2013–2021. doi:10.1182/blood-2005-05-1795
- Nasi A, Fekete T, Krishnamurthy A, et al. Dendritic cell reprogramming by endogenously produced lactic acid. J Immunol. 2013;191(6):3090–3099. doi:10.4049/jimmunol.1300772
- Pilon-Thomas S, Kodumudi KN, El-Kenawi AE, et al. Neutralization of tumor acidity improves antitumor responses to immunotherapy. Cancer Res. 2016;76(6):1381–1390. doi:10.1158/0008-5472.CAN-15-1743
- Meng J, Liu Y, Guan S, et al. The establishment of immune infiltration based novel recurrence predicting nomogram in prostate cancer. Cancer Med. 2019;8(11):5202–5213. doi:10.1002/cam4.2433
- Huang DW, Sherman BT, Lempicki RA. Systematic and integrative analysis of large gene lists using DAVID bioinformatics resources. Nat Protoc. 2009;4(1):44–57. doi:10.1038/nprot.2008.211
- Liao Y, Wang J, Jaehnig EJ, Shi Z, Zhang B. WebGestalt 2019: gene set analysis toolkit with revamped UIs and APIs. Nucleic Acids Res. 2019;47(W1):W199–W205. doi:10.1093/nar/gkz401
- Newman AM, Liu CL, Green MR, et al. Robust enumeration of cell subsets from tissue expression profiles. Nat Methods. 2015;12(5):453–457. doi:10.1038/nmeth.3337
- Varin A, Mukhopadhyay S, Herbein G, Gordon S. Alternative activation of macrophages by IL-4 impairs phagocytosis of pathogens but potentiates microbial-induced signalling and cytokine secretion. Blood. 2010;115(2):353–362. doi:10.1182/blood-2009-08-236711
- El-Kenawi A, Gatenbee C, Robertson-Tessi M, et al. Acidity promotes tumour progression by altering macrophage phenotype in prostate cancer. Br J Cancer. 2019;121(7):556–566. doi:10.1038/s41416-019-0542-2
- Shen H, Sun CC, Kang L, et al. Low-dose salinomycin inhibits breast cancer metastasis by repolarizing tumor hijacked macrophages toward the M1 phenotype. Eur J Pharm Sci. 2021;157:105629. doi:10.1016/j.ejps.2020.105629
- Zhang Y, Liu X, Liu L, et al. Upregulation of FEN1 is associated with the tumor progression and prognosis of hepatocellular carcinoma. Dis Markers. 2020;2020:2514090. doi:10.1155/2020/2514090
- Payen VL, Mina E, Van Hée VF, Porporato PE, Sonveaux S. Monocarboxylate transporters in cancer. Mol Metab. 2020;33::48–66. doi:10.1016/j.molmet.2019.07.006
- Pavlova NN, Thompson CB. The emerging hallmarks of cancer metabolism. Cell Metab. 2016;23(1):27–47. doi:10.1016/j.cmet.2015.12.006
- Du S, Zhang P, Ren W, Yang F, Du C. Circ-ZNF609 accelerates the radioresistance of prostate cancer cells by promoting the glycolytic metabolism through miR-501-3p/HK2 axis. Cancer Manag Res. 2020;12:7487–7499. doi:10.2147/CMAR.S257441
- Singh KB, Hahm ER, Alumkal JJ, et al. Reversal of the Warburg phenomenon in chemoprevention of prostate cancer by sulforaphane. Carcinogenesis. 2019;40(12):1545–1556. doi:10.1093/carcin/bgz155
- Singh KB, Kim SH, Hahm ER, Pore SK, Jacobs BL, Singh SV. Prostate cancer chemoprevention by sulforaphane in a preclinical mouse model is associated with inhibition of fatty acid metabolism. Carcinogenesis. 2018;39(6):826–837. doi:10.1093/carcin/bgy051
- Parks SK, Chiche J, Pouysségur J. Disrupting proton dynamics and energy metabolism for cancer therapy. Nat Rev Cancer. 2013;13(9):611–623. doi:10.1038/nrc3579
- Dimmer KS, Friedrich B, Lang F, Deitmer JW, Bröer S. The low-affinity monocarboxylate transporter MCT4 is adapted to the export of lactate in highly glycolytic cells. Biochem J. 2000;350(Pt 1):219–227. doi:10.1042/bj3500219
- Chen HL, OuYang HY, Le Y, et al. Aberrant MCT4 and GLUT1 expression is correlated with early recurrence and poor prognosis of hepatocellular carcinoma after hepatectomy. Cancer Med. 2018;7(11):5339–5350. doi:10.1002/cam4.1521
- Fisel P, Kruck S, Winter S, et al. DNA methylation of the SLC16A3 promoter regulates expression of the human lactate transporter MCT4 in renal cancer with consequences for clinical outcome. Clin Cancer Res. 2013;19(18):5170–5181. doi:10.1158/1078-0432.CCR-13-1180
- Todenhöfer T, Seiler R, Stewart C, et al. Selective inhibition of the lactate transporter MCT4 reduces growth of invasive bladder cancer. Mol Cancer Ther. 2018;17(12):2746–2755. doi:10.1158/1535-7163.MCT-18-0107
- Lai SW, Lin HJ, Liu YS, Yang LY, Lu DY. Monocarboxylate transporter 4 regulates glioblastoma motility and monocyte binding ability. Cancers (Basel). 2020;12(2):380. doi:10.3390/cancers12020380
- Pértega-Gomes N, Vizcaíno JR, Miranda-Gonçalves V, et al. Monocarboxylate transporter 4 (MCT4) and CD147 overexpression is associated with poor prognosis in prostate cancer. BMC Cancer. 2011;11(1):312. doi:10.1186/1471-2407-11-312
- Choi SYC, Xue H, Wu R, et al. The MCT4 gene: a novel, potential target for therapy of advanced prostate cancer. Clin Cancer Res. 2016;22(11):2721–2733. doi:10.1158/1078-0432.CCR-15-1624
- Choi SYC, Ettinger SL, Lin D, et al. Targeting MCT4 to reduce lactic acid secretion and glycolysis for treatment of neuroendocrine prostate cancer. Cancer Med. 2018;7(7):3385–3392. doi:10.1002/cam4.1587
- Sun Q, Hu LL, Fu Q. MCT4 promotes cell proliferation and invasion of castration-resistant prostate cancer PC-3 cell line. EXCLI J. 2019;18:187–194. doi:10.17179/excli2018-1879
- Dhup S, Dadhich RK, Porporato PE, Sonveaux P. Multiple biological activities of lactic acid in cancer: influences on tumor growth, angiogenesis and metastasis. Curr Pharm Des. 2012;18(10):1319–1330. doi:10.2174/138161212799504902
- Wang K, Kim MK, Di Caro G, et al. Interleukin-17 receptor a signaling in transformed enterocytes promotes early colorectal tumorigenesis. Immunity. 2014;41(6):1052–1063. doi:10.1016/j.immuni.2014.11.009
- Zhang Y, Zoltan M, Riquelme E, et al. Immune cell production of interleukin 17 induces stem cell features of pancreatic intraepithelial neoplasia cells. Gastroenterology. 2018;155(1):210–223.e213. doi:10.1053/j.gastro.2018.03.041
- Jin C, Lagoudas GK, Zhao C, et al. Commensal microbiota promote lung cancer development via γδ T cells. Cell. 2019;176(5):998–1013.e1016. doi:10.1016/j.cell.2018.12.040
- Chen X, Cai G, Liu C, et al. IL-17R-EGFR axis links wound healing to tumorigenesis in Lrig1+ stem cells. J Exp Med. 2019;216(1):195–214. doi:10.1084/jem.20171849
- Veglia F, Perego M, Gabrilovich D. Myeloid-derived suppressor cells coming of age. Nat Immunol. 2018;19(2):108–119. doi:10.1038/s41590-017-0022-x
- Coffelt SB, Kersten K, Doornebal CW, et al. IL-17-producing γδ T cells and neutrophils conspire to promote breast cancer metastasis. Nature. 2015;522(7556):345–348. doi:10.1038/nature14282
- Thiele Orberg E, Fan H, Tam AJ, et al. The myeloid immune signature of enterotoxigenic Bacteroides fragilis-induced murine colon tumorigenesis. Mucosal Immunol. 2017;10(2):421–433. doi:10.1038/mi.2016.53
- Ma S, Cheng Q, Cai Y, et al. IL-17A produced by γδ T cells promotes tumor growth in hepatocellular carcinoma. Cancer Res. 2014;74(7):1969–1982. doi:10.1158/0008-5472.CAN-13-2534
- Haas R, Smith J, Rocher-Ros V, et al. Lactate regulates metabolic and pro-inflammatory circuits in control of T cell migration and effector functions. PLoS Biol. 2015;13(7):e1002202. doi:10.1371/journal.pbio.1002202
- Shime H, Yabu M, Akazawa T, et al. Tumor-secreted lactic acid promotes IL-23/IL-17 proinflammatory pathway. J Immunol. 2008;180(11):7175–7183. doi:10.4049/jimmunol.180.11.7175
- Yabu M, Shime H, Hara H, et al. IL-23-dependent and -independent enhancement pathways of IL-17A production by lactic acid. Int Immunol. 2011;23(1):29–41. doi:10.1093/intimm/dxq455
- Straus DS. TNFα and IL-17 cooperatively stimulate glucose metabolism and growth factor production in human colorectal cancer cells. Mol Cancer. 2013;12:78. doi:10.1186/1476-4598-12-78
- Hamilton T, Li X, Novotny M, et al. Cell type- and stimulus-specific mechanisms for post-transcriptional control of neutrophil chemokine gene expression. J Leukoc Biol. 2012;91(3):377–383. doi:10.1189/jlb.0811404
- Jansen CS, Prokhnevska N, Kissick HT. The requirement for immune infiltration and organization in the tumor microenvironment for successful immunotherapy in prostate cancer. Urol Oncol. 2019;37(8):543–555. doi:10.1016/j.urolonc.2018.10.011
- Mlecnik B, Bindea G, Angell HK, et al. Integrative analyses of colorectal cancer show Immunoscore is a stronger predictor of patient survival than microsatellite instability. Immunity. 2016;44(3):698–711. doi:10.1016/j.immuni.2016.02.025
- Sato E, Olson SH, Ahn J, et al. Intraepithelial CD8+ tumor-infiltrating lymphocytes and a high CD8+/regulatory T cell ratio are associated with favorable prognosis in ovarian cancer. Proc Natl Acad Sci USA. 2005;102(51):18538–18543. doi:10.1073/pnas.0509182102
- Mahmoud SMA, Paish EC, Powe DG, et al. Tumor-infiltrating CD8+ lymphocytes predict clinical outcome in breast cancer. J Clin Oncol. 2011;29(15):1949–1955. doi:10.1200/JCO.2010.30.5037
- Ness N, Andersen S, Valkov A, et al. Infiltration of CD8+ lymphocytes is an independent prognostic factor of biochemical failure-free survival in prostate cancer. Prostate. 2014;74(14):1452–1461. doi:10.1002/pros.22862
- Leclerc BG, Charlebois R, Chouinard G, et al. CD73 expression is an independent prognostic factor in prostate cancer. Clin Cancer Res. 2016;22(1):158–166. doi:10.1158/1078-0432.CCR-15-1181
- Zhao SG, Lehrer J, Chang SL, et al. The immune landscape of prostate cancer and nomination of PD-L2 as a potential therapeutic target. J Natl Cancer Inst. 2019;111(3):301–310. doi:10.1093/jnci/djy141
- Apetoh L, Smyth MJ, Drake CG, et al. Consensus nomenclature for CD8+ T cell phenotypes in cancer. Oncoimmunology. 2015;4(4):e998538. doi:10.1080/2162402X.2014.998538
- Kurachi M. CD8(+) T cell exhaustion. Semin Immunopathol. 2019;41(3):327–337. doi:10.1007/s00281-019-00744-5
- Romero-Garcia S, Moreno-Altamirano MMB, Prado-Garcia H, Sánchez-García FJ. Lactate contribution to the tumor microenvironment: mechanisms, effects on immune cells and therapeutic relevance. Front Immunol. 2016;7:52. doi:10.3389/fimmu.2016.00052
- Hargadon KM. Strategies to improve the efficacy of dendritic cell-based immunotherapy for melanoma. Front Immunol. 2017;8:1594. doi:10.3389/fimmu.2017.01594
- Husain Z, Huang Y, Seth P, Sukhatme VP. Tumor-derived lactate modifies antitumor immune response: effect on myeloid-derived suppressor cells and NK cells. J Immunol. 2013;191(3):1486–1495. doi:10.4049/jimmunol.1202702
- Husain Z, Seth P, Sukhatme VP. Tumor-derived lactate and myeloid-derived suppressor cells: linking metabolism to cancer immunology. Oncoimmunology. 2013;2(11):e26383. doi:10.4161/onci.26383
- Zhao Y, Wang D, Xu T, et al. Bladder cancer cells re-educate TAMs through lactate shuttling in the microfluidic cancer microenvironment. Oncotarget. 2015;6(36):39196–39210. doi:10.18632/oncotarget.5538
- Wang F, Zhang S, Vuckovic I, et al. Glycolytic stimulation is not a requirement for M2 macrophage differentiation. Cell Metab. 2018;28(3):463–475.e464. doi:10.1016/j.cmet.2018.08.012
- Bénéteau M, Zunino B, Jacquin MA, et al. Combination of glycolysis inhibition with chemotherapy results in an antitumor immune response. Proc Natl Acad Sci USA. 2012;109(49):20071–20076. doi:10.1073/pnas.1206360109
- Kim HK, Lee I, Bang H, et al. MCT4 expression is a potential therapeutic target in colorectal cancer with peritoneal carcinomatosis. Mol Cancer Ther. 2018;17(4):838–848. doi:10.1158/1535-7163.MCT-17-0535