
Weng M, Zhang H, Hou W, Sun Z, Zhong J, Miao C. Onco Targets Ther. 2020;13:3477–3488.
The authors have advised and are incorrect. The correct and are shown below.
Figure 4 The regulation of some apoptotic marker in CT26 and DLD1 cells by ACAT2 knockdown. (A) The expression of cyclin D1 and CDK2 in CT26 or CT26 cells transfected with siRNA-ACAT2 (DLD1 or DLD1 cells transfected with siRNA-ACAT2). (B) The expression of caspase 3, caspase 9, Bcl-2 and Bax in CT26 or CT26 cells transfected with siRNA-ACAT2 (DLD1 or DLD1 cells transfected with siRNA-ACAT2).
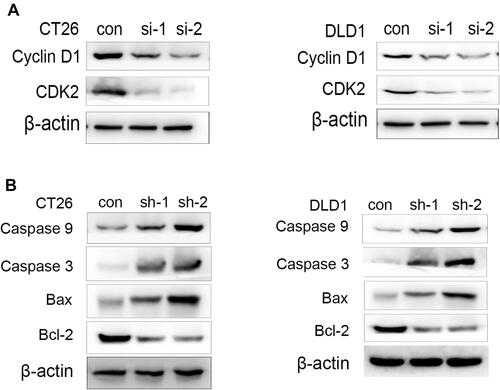
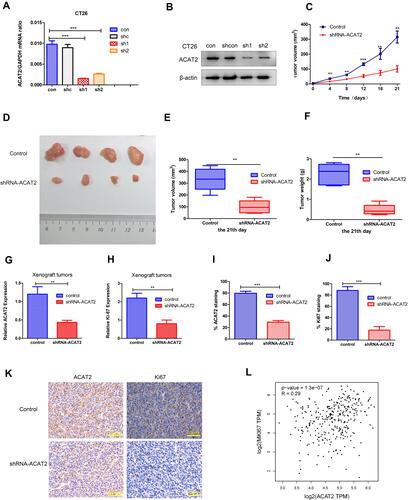
Figure 5 Knockdown of ACAT2 expression suppresses CRC growth and inhibits Ki-67 expression in vivo. (A, B) The efficiency of ACAT2 knockdown in CT26 cells was measured by qPCR and Western blotting. (C, D) CT26 cells or shRNA-ACAT2 CT26 cells were injected into BALB/c mice. Photograph of dissected tumors (upper: control group; lower: shRNA-ACAT2 group; n=4; P<0.01). The tumor volumes were measured every 3 days. The shRNA-ACAT2 in CT26 cells attenuated tumor growth in mice. (E, F) Tumor volumes and tumor weights on the 21st day (P<0.01). (G, H) The expression of ACAT2 and Ki-67 in tissues was detected by qPCR (P<0.01). (I, J) The graph shows the quantitative analysis of ACAT2 and Ki67 staining. (K) The protein expression ACAT2 and Ki67 in dissected tumor samples were evaluated by IHC. Scale bar: 100um. (L) Based on TCGA dataset analysis, ACAT2 expression was positively correlated with Ki-67 expression in CRC (P=1.3×10⁻⁷). **P<0.01, ***P<0.001; compared with the control group.
The authors apologize for these errors and advise that this does not affect the results of the paper.