
Hu H, Dong Z, Wang X, et al. Onco Targets Ther. 2019;12:5163–5175.
The authors have advised due to an error at the time of figure assembly, and on pages 5167 and 5169, respectively is incorrect. The correct and are shown below.
Figure 2 Dehydrocorydaline inhibits cell growth and proliferation in human melanoma cells. (A) Cell morphology of A375 and MV3 melanoma cells after treating with DMSO or the indicated concentrations of DHC for 48 h. Scale bar, 100 μm. (B and C) The effect of DHC on the proliferation rates of A375 and MV3 cells determined by cell counting in the microscope. (D) The effect of different concentrations of DHC treatment for 48 h on the proliferation rate of PIG1 cells determined by MTT assay. (E and F) The effect of DHC on the viability of A375 and MV3 cells. (G) Images and quantifications of A375 and MV3 cells positive for BrdU staining after treating with DMSO or 40 μM DHC for 24 h. Scale bar, 100 μm. All data are shown as the mean ± SD. A two-tailed unpaired Student’s t-test was carried out. *p<0.05, **p<0.01, ***p<0.001, ****p<0.0001.
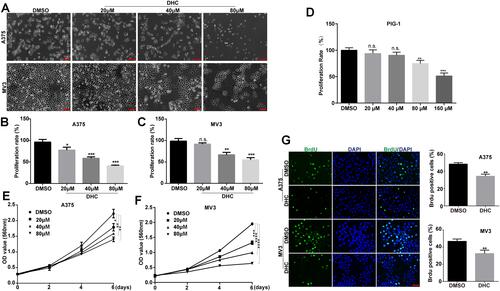
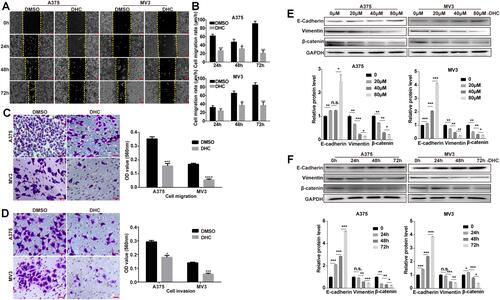
Figure 4 Dehydrocorydaline inhibits cell migration and invasion in melanoma cells. (A) Cell migration rate detected by wound-healing assay of A375 and MV3 cells after treating with DMSO or 40 μM DHC for the indicated time. Scale bar, 100 μm. (B) The effect of 40 μM DHC on the wound closure in A375 and MV3 cells. (C) The effect of transwell migration assays in A375 and MV3 cells after treating with DMSO or 40 μM DHC for 24 h. Scale bar, 100 μm. Migration rates were normalized by proliferation. (D) The effect of transwell invasion assays in A375 and MV3 cells after treating with DMSO or 40 μM DHC for 72 h. Scale bar, 100 μm. Invasion rates were normalized by proliferation. (E and F) Western blot analysis of the metastasis-related protein levels in A375 and MV3 cells, respectively. Protein levels were calculated based on the grayscale value of protein bands and normalized with the grayscale value of GAPDH bands. Cells were treated with the indicated concentrations (0, 20, 40, 80 μM) of DHC for 48 h or with 40 μM DHC treatment for indicated times (0, 24, 48, 72 h) of DHC; GAPDH was used as a control. All data are shown as the mean ± SD. A two-tailed unpaired Student’s t-test was carried out. *p<0.05, **p<0.01, ***p<0.001, ****p<0.0001.
The authors apologize for these errors and advise it does not affect the results of the paper.