
Abstract
Background
The accumulation of poorly folded protein in the endoplasmic reticulum (ER) promotes ER stress and contributes to the pathogenesis of hepatocellular carcinoma (HCC). Current therapies have various adverse effects, therefore, laying the need for an alternative approach. Kaempferol (KP), a naturally occurring flavonoid, possesses potent anti-proliferative properties against various cancer cells. Nevertheless, its involvement in HCC remains relatively unexplored, particularly regarding its influence on apoptosis and autophagy pathways.
Methods
The effect of KP on cell viability, and motility of Hep3B cells was evaluated by MTT, and scratch assay, respectively. Hoechst staining and FACS analysis were done to check the effect of KP on apoptosis and cell cycle progression. qRTPCR was used to evaluate the expression of several apoptosis and autophagy-related genes. KP was docked with several ER stress-related proteins involved in HCC to gain further insights into molecular mechanisms. The results of docking studies were validated with MD simulation and in vitro studies.
Results
Treatment with KP at different time intervals showed dose- and time-dependent growth inhibition of liver cancer cells. KP decreased motility and arrested the cell cycle at the G0/G1 phase in Hep3B cells. Additionally, in the context of HCC, the relationship between KP, apoptosis, and autophagy is significant. It induced apoptosis and autophagy in Hep3B cells by downregulating the expression of Bcl-2 and upregulated Bax and Bid, Caspase-3, Beclin-1, and LC3. KP showed a better binding affinity with Nrf2, PERK, and IRE1α among all selected proteins. Further, it reversed the protective effect of 4-PBA (ER Stress inhibitor) by inducing apoptosis and autophagy in Hep3B cells.
Conclusion
The study suggested KP as a potential chemopreventive agent for managing HCC by effectively inducing apoptosis and autophagy in Hep3B cells.
Graphical Abstract

Keywords:
Introduction
Hepatocellular carcinoma (HCC) poses a significant burden on human health characterized by its widespread occurrence, grim prognosis, and limited survival rates.Citation1 It stands as the fourth leading cause of cancer-associated mortality worldwide. Its etiology encompasses a spectrum of risk factors including viral hepatitis (B, C, D) infection, cirrhosis, non-alcoholic fatty liver diseases (NAFLD), non-alcoholic steatohepatitis (NASH), obesity, aflatoxin-contaminated food, diabetes, ER stress, etc.Citation2 Current therapeutic modalities include medications, radiotherapy, chemotherapy, surgical resection, embolization, and ablation. Palliative approaches to HCC involve targeted molecular therapy, trans-arterial chemo-embolization (TACE), and systemic medical therapies such as sorafenib treatment, etc.Citation1 However, these treatments are marred by significant drawbacks, including high recurrence rates, rapid disease progression, insidious onset, and various complexities.Citation3 Despite extensive research, the precise mechanisms underlying HCC pathogenesis remain elusive. Thus, there is an urgent need for novel therapeutic candidates exhibiting improved efficacy profiles and minimal adverse effects to address the multifaceted challenges posed by HCC.
Natural products have long been a part of traditional medicine and contributed to the development of anti-cancer drugs.Citation4–10 Due to their large therapeutic window and low-to-none associated side effects, 40% of United States Food and Drug Association (USFDA) approved drugs are of natural origin.Citation11 Kaempferol (KP) is one such polyphenolic dietary aglycone flavonoid present in saffron petals, the byproduct of the saffron industry, and numerous plants, fruits, and vegetables (aloe-vera, beans, apples, kale, broccoli, carrot, gooseberry, etc).Citation1 It is known to have anti-oxidant, anti-inflammatory, anti-microbial, cardioprotective, neuroprotective, and, anti-tumor properties.Citation12 The anti-cancer potential of KP through different mechanisms is shown in . For instance, KP inhibited pancreatic cancer growth and migration of cells through the suppression of epidermal growth factor receptor (EGFR)-related pathway.Citation11 Expanding the interplay between apoptosis and autophagy in HCC, exploring natural molecules including KP offers a promising avenue. These phytochemicals have been investigated for their ability to modulate cell death pathways, including apoptosis and autophagy.
Figure 1 Mechanism of action of KP in promoting cell death in liver cancer.
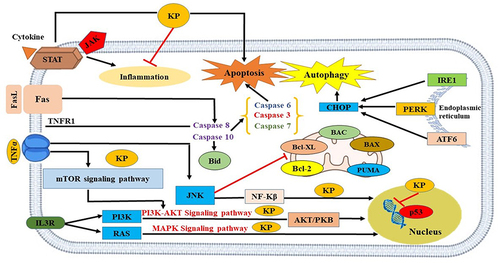
As a programmed cell death mechanism, apoptosis exhibits distinct morphological changes and caspase activation.Citation12 In contrast, autophagy is a cellular process that maintains equilibrium by removing damaged organelles and proteins.Citation13 The correlation between apoptosis and autophagy is pivotal in understanding the pathophysiology of HCC, shedding light on the intricate mechanisms governing cellular homeostasis and response to stimuli. These processes often intersect and influence each other in complex ways. For instance, under certain conditions, autophagy can counteract apoptosis by eliminating damaged mitochondria, thereby preventing the release of pro-apoptotic factors like cytochrome C.Citation14 Conversely, in situations where apoptosis is inhibited, cells may rely on autophagy as an alternative mechanism to remove damaged components and sustain viability.Citation15 Moreover, both apoptosis and autophagy can be triggered by similar stimuli encountered in the HCC microenvironment, such as DNA damage or reactive oxygen species (ROS). This suggests a coordinated cellular response where signals are integrated to determine the appropriate fate—whether it involves apoptosis to eliminate irreversibly damaged cells or autophagy to alleviate cellular stress and promote survival.Citation16 Dysregulation of either process can significantly contribute to HCC pathogenesis. Impaired apoptosis may foster unchecked cell proliferation, while dysfunctional autophagy can lead to the accumulation of toxic proteins and organelles, fueling disease progression.Citation17 A recent study has illuminated connections between autophagy and other cellular processes pertinent to HCC, including interactions with the endoplasmic reticulum (ER).Citation18 Electron tomography analyses have unveiled associations between autophagosome membranes and the endoplasmic reticulum (ER), hinting at a direct correlation between ER function and autophagy regulation in HCC.Citation19
The endoplasmic reticulum (ER) is responsible for carrying out protein folding, post-translational modification and trafficking, calcium signaling, and maintaining cellular homeostasis.Citation1 Several extracellular and intracellular challenges disturb hepatocytes’ ability to do protein folding and proteostasis, thus disrupting ER homeostasis and promoting the accumulation of misfolded or unfolded proteins.Citation20 In response, cells adapt a cellular signaling pathway called unfolded protein response (UPR) signaled by three active molecular mediators: the inositol-requiring enzyme 1 (IRE1-α), the activating transcription factor 6 (ATF6), and the protein kinase RNA-like endoplasmic reticulum kinase (PERK). UPR contributes to activating the pro-survival signal transduction pathways to restore homeostasis by decreasing ER protein load.Citation1 Notably, UPR activation is associated with pathological progression, mutational accumulation, and survival of cancer cells. However, under prolonged and severe stress, or if homeostasis cannot be re-established, the sustained UPR will be converted to a terminal UPR, resulting in cell death.Citation21 The effects of ER stress on apoptosis and autophagy in the context of HCC are multifaceted. ER stress-induced apoptosis serves as a mechanism to eliminate severely stressed cells, thereby preventing the propagation of damaged cells that could contribute to tumor development.Citation22 Conversely, ER stress can also induce autophagy as a cytoprotective response to alleviate cellular stress and promote cell survival. Autophagy facilitates the degradation of misfolded proteins and damaged organelles, thereby mitigating ER stress-induced cytotoxicity.Citation23 However, dysregulation of apoptosis and autophagy pathways in the context of chronic ER stress can contribute to HCC pathogenesis. Persistent ER stress may tip the balance towards apoptotic cell death, leading to the depletion of hepatocytes and exacerbating liver injury. Conversely, impaired autophagy may result in the accumulation of damaged proteins and organelles, promoting tumorigenesis and HCC progression.Citation24
The present study was designed to elucidate the mechanism underlying the anti-cancer effects of KP in liver cancer cells. We assessed KP’s impact on cancer cell viability and survival. To identify potential target proteins for KP in treating HCC, computational studies using AutoDock Vina were conducted to predict KP’s interaction with selected targets. These findings were subsequently validated through MD simulation studies. Additionally, we investigated KP’s mechanism of action through in vitro experiments and RT-qPCR analysis. Furthermore, we evaluated its influence on cell cycle progression.
Materials and Methods
Chemicals and Reagents
Kaempferol, chloroquine diphosphate salt, 3-methyladenine, 4-phenylbutyric acid, and TRIzol reagent were purchased from Sigma-Aldrich Co. LLC (St. Louis, MO, USA). 3-(4,5-dimethylthiazol-2-yl)-2,5-diphenyltetrazolium bromide (MTT), sodium phosphate monobasic and 2,2-diphenyl-1-picrylhydrazyl (DPPH) was purchased from Central Drug House Pvt. Ltd. (Pune, India) and ascorbic acid was obtained from Sisco Research Laboratory Pvt. Ltd. (Pune, India). Bovine serum albumin (BSA), Type-I collagen peptide and dimethyl sulphoxide (cell-culture grade) were obtained from HiMedia laboratories Pvt.Ltd. (Mumbai, India). Fetal Bovine Serum (FBS), Dulbecco’s Modified Eagle Medium (DMEM), DMEM/F-12, Penicillin-Streptomycin (Penstrep) antibiotic solution, Trypsin EDTA, Epidermal Growth Factor (EGF), Annexin V- FITC apoptosis detection kit, nuclease-free water, Hoechst 33258, di-sodium hydrogen phosphate, ferric chloride, potassium ferricyanide, trichloro acetic acid, paraformaldehyde, and high capacity cDNA kit were purchased from Thermo Fisher Scientific (Whitman, MA, USA). SYBR green master mix was purchased from Applied Biosystem, USA. Primers were synthesized by Universal Biotech (New Delhi, India).
Anti-Oxidant Activity
2,2-Diphenyl-1-Picrylhydrazyl (DPPH) Radical-Scavenging Activity
The DPPH assay, a cost-effective method for assessing the anti-oxidant potential of natural compounds, was conducted according to the standardized protocol established in our laboratory.Citation25 Different concentrations of KP (0.5–16µM) were mixed with 0.1mM methanolic solution of DPPH. Notably, KP at higher concentrations showed saturation in its anti-oxidant activity. For this reason, we used concentrations from 0.5 to 16µM. Ascorbic acid (0.5–16µM) was used as a positive control as it helps in regulating the level of ROS as soon as it forms inside the human body, regenerates other anti-oxidants, chelate metal ions, supports the immune system and reduces oxidative stress. The blank was constituted by methanol. Briefly, the mixture was vortexed and allowed to stand for 30 minutes at room temperature in the dark. The absorbance was recorded at 517nm using a UV spectrometer (Lab India Pvt. Ltd, Mumbai, India). The percentage inhibition was calculated using the following equation:
Where A0 is the absorbance of the blank and A1 is the absorbance of the test sample.
Ferric Reducing Anti-Oxidant Power Assay (FRAP)
This assay evaluates the reduction of ferric ions by the tested compound, following the standardized FRAP assay protocol developed in our laboratory.Citation26 1mL of KP solution, at various concentrations (6.9–27.9µM), was blended with 2.5mL of potassium buffer (0.2M) and 2.5mL of 1% potassium ferricyanide solution in a test tube. The reaction mixture was allowed to stand at 50°C for 20 minutes for the reaction to occur. Further, 2.5mL of 10% trichloroacetic acid solution was incorporated into the test tubes and each reaction mixture was centrifuged at 3000 rpm for 10 min. 2.5mL was taken from the supernatant and mixed with 2.5mL distilled water. To this solution, 0.5mL of 0.1% ferric chloride solution was added. The absorbance was recorded at 700nm using a UV spectrophotometer against a blank.
Cell Lines and Cell Culture
The human hepatoma cell lines (HepG2, Hep3B, and Huh7) were acquired from the National Center for Cell Science (NCCS) in Pune, India. Primary hepatocytes were obtained from the American Type Culture Collection (ATCC), USA. Hep3B, HepG2, and Huh7 were cultured in DMEM with 10% FBS and 1% Penstrep solution at 37°C in a humidified 5% C02 incubator. THLE-2 cells (used as a representative of healthy liver cells) were cultured in DMEM/F-12 (without glutamine) supplemented with BSA and type-I collagen peptide. Cells were grown in T-25 cm2 culture flasks (Nunclon, Denmark) and routinely changed with fresh medium every 2–3 days. For THLE-2 cells, the flasks were pre-coated with a mixture of collagen type I and BSA dissolved in a DMEM/F-12 medium. The culture media consisted of DMEM/F-12 with 10% FBS, 5ng/mL epidermal growth factor (EGF), and 70 ng/mL phosphoethanolamine. After attaining the desired confluence, cells were counted, processed, and seeded for further experimentation.
Cell Viability Assay
The MTT assay was used to evaluate the cytotoxic effect of KP against liver cancer cell lines (Hep3B, Huh7, and HepG2). A density of 1*104 cells were seeded in a 96-well plate and allowed to incubate for 24h. The cells were treated with or without various concentrations of KP (6.25–100µM) for 24, 48, and 72h. After the exposure period, the media was removed and the cells were treated with MTT and incubated for 4h at 37°C. MTT was removed and 100µL of DMSO was added in the dark and allowed to incubate for 15 minutes. Formazan was measured spectrophotometrically at 570nm using a plate reader from Thermo Fisher Scientific (Whitman, MA, USA). The changes in the cellular morphology were observed under a Nikon Eclipse Ti-U inverted microscope, (Nikon Instruments Inc., Melville, NY, USA) at 10X magnification using Nikon NIS software.Citation25
Scratch Assay
Hep3B cells were seeded in a 12-well plate at a cell density of 1.5*105 cells/well to grow in a monolayer. After the cells reached 100% confluence, a sterile 200µL pipette tip was held vertically to scratch a wound in each well. Media was removed and cells were then washed twice with PBS to remove the detached cells or debris. Fresh medium with or without KP (14.4µM) was added and cells were allowed to incubate for the next 24h. Photos were taken at 0 and 24h after wounding and the gap distance was evaluated using ImageJ software.Citation25 The percentage migration was calculated using the equation,
W0 = Area at 0h
Wt = Area at 24h
Cell Cycle Analysis
Hep3B cells were seeded into 60mm dishes at a concentration of 1.5*105 cells/well and incubated at 37°C for 24h. Further, cells were treated with IC20 (7.2µM) and IC30 (10.8µM) concentrations of KP for 24h. Cells were harvested with trypsin EDTA, washed with PBS, fixed in 70% ethanol, and stored at 4°C for 2h. Then, the cells were centrifuged at 850g at 4°C for 5 minutes and with 50µL of RNase (50µg/mL). After five minutes of incubation, cells were then treated with 200µL of PI (1mg/mL). The cells were kept for 30 minutes in the dark and cell-cycle distribution was analyzed with flow cytometry (BD FACS Calibur, BD Biosciences, San Jose, CA, USA). The assay was performed as per the reported protocol.Citation25
Apoptotic Assay of Hep3B Cells by Hoechst 33258 Staining
Hep3B cells were seeded in 12-well plates at a density of 5*104 cells per well. After 24 hours, the cells were treated with varying concentrations of KP (6.25–100 µM) or a vehicle control. The cells were then incubated for an additional 48 hours. Post incubation, the cells were fixed with 4% paraformaldehyde for 10 minutes at room temperature. Following fixation, the cells were continuously washed with PBS for 15 minutes. The cells were then stained with Hoechst 33258 solution (10 µg/mL) for 10 minutes at room temperature. After staining, the cells were washed with PBS for another 15 minutes in the dark to minimize background fluorescence. Cell morphology was subsequently visualized and photographed using a Nikon Eclipse Ti-U fluorescence microscope (Nikon Instruments Inc., Melville, NY) with fluorescence excitation at 340 nm.
Reverse Transcription- Quantitative Polymerase Chain Reaction (RT-qPCR)
Hep3B cells were cultured and treated with KP (14.4µM) for 24, 48, and 72h along with the untreated group. The cells were extracted using a Trizol reagent. The total RNA was isolated and cDNA was synthesized, following the established protocol.Citation25 The synthesized cDNA was kept at −20°C until further use.
RT-qPCR was performed on a Step OneTM Real-Time PCR system (Applied Biosystems, Foster City, CA, USA) to study the expression profile of several genes regulating apoptosis (Caspase-3, Bcl2, Bax and Bid), autophagy (Beclin-1 and LC3) and ER stress markers (PERK, IRE1-α and ATF6). The mechanistic analysis was further corroborated by employing an ER stress inhibitor: 4-phenylbutyric acid (4-PBA). We prepared 500 nM of 4-PBA solution by dissolving 0.1 µL of the freshly prepared stock solution (20,000 µM) in 4 mL of serum-free media. Cells were pretreated with 4-PBA to assess the influence of 4-PBA on the effects of KP. Subsequently, the treated cells underwent experimental procedures, including cell viability and RT-qPCR analysis, aimed at elucidating alterations in the expression profile of genes associated with apoptosis, and autophagy markers. The primer sequences are listed in Supplementary Table 1. Further, 1µL (~50 ng) of cDNA with gene-specific forward and reverse primers along with the SYBR green master mix was added to each reaction mixture as per the manufacturer’s instructions. β – actin was used as a reference control and ran along with all the genes of interest. The RT-qPCR reaction protocol was carried out for 10 minutes at 95 ◦C, followed by 45 cycles at 95 ◦C (15 s) and 60 ◦C for 1 minute. All the experiments were performed in triplicates along with negative and positive controls. The mRNA expression was calculated using the following formula,
In silico Studies
Ligand and Target Selection
The chemical structure of KP (CID_5280863) was retrieved from the PubChem compound database (NCBI). Seven target proteins based on their roles in ER Stress downstream signaling pathways, were selected; IRE1-α (Serine/threonine-protein kinase/endoribonuclease IRE1), PERK (Eukaryotic translation initiation factor 2-alpha kinase 3), CHOP (DNA damage-inducible transcript 3 protein), GADD34 (Protein phosphatase 1 regulatory subunit 15A), Atg14 (Beclin-1 associated autophagy-related key regulator), ATF6 (Cyclic AMP-dependent transcription factor ATF-6 alpha) and Nrf2 (Nuclear factor erythroid 2-related factor 2). The proteins were nomenclatured from P1 to P7, on the basis of their amino acid sequences and length as shown in . Additionally, the protein domains and their functions were also identified using Pfam and CATH servers.
Table 1 Protein Selection and Domain Identification
For the case, where no three-dimensional structures were available for the target proteins in Protein Data Bank (PDB), the (fast alignment) FASTA sequences for each protein were retrieved using the UniProt database with the help of homology modeling and used for further analysis. The UniProt IDs are given in .
Homology Modeling
Homology-based models were created using the Phyre2 tool (Protein Homology/analogy Recognition Engine V 2.0.Citation27,Citation28 Templates were identified using the protein-protein basic local alignment search tool (BLAST) against the PDB database. The aligned region domain predictionCitation29 was carried out using pfam, CATH, and SMART server. The selected model proteins were refined using a 3D refine server and were further subjected to energy minimization in a vacuum using GROMACS 2018.1.Citation30 The Ramachandran plot assessment was done for the structure validation using the Ramachandran plot server to check the conformational validity, stereochemistry, and structural features.Citation31
Active Site Prediction and Molecular Docking
The CASTp program was used to predict the binding site for the domains.Citation32 The putative pockets were predicted based on the results obtained by CASTp. The pockets with the maximum volume were used for docking analysis. The energy-minimized structures of target proteins (P3 (Nrf2), P6 (IRE1-α) and P7 (PERK) and ligand (KP) were fed as input for AutoDock tools 1.5.6Citation33 in pdbqt format to carry out the molecular docking. The receptors were primarily checked for any missing atoms. The Gasteiger charge was added to the ligand. A pre-calculated grid map was set around the active site in the macromolecule. Grid box centers and dimensions were set according to the protein (). The binding site was calculated based on the amino acid residues present in the pocket. The grid was centralized at amino acid residues present in the active site. The inhibition constant (Ki) of the selected proteins against KP was further calculated on the basis of their docking scores. The formula for calculating Ki is:
Table 2 Grid Box Coordinates and Size Parameters Used in AutoDock Vina
Where, ∆G = docking energy; R = 1.98719 cal K−1 mol−1; and T = 298.15 K
Molecular docking results were carried out in replicates. The results were reproduced using the same parameters. The complexes thus generated were visualized in PyMOL,Citation34 and the two- dimensional plots were studied using LigPlot+.Citation35
MD Simulation Studies of KP with Proteins Shortlisted Based on Molecular Docking
To study the stability of the docked protein-ligand complex, MD simulation was conducted using the software GROMACS 2018.01. The top three protein-ligand complexes were subjected to simulation studies using Gromos 53a6 force fields.Citation36 PRODRG 2.5 program was used to convert and generate the ligand topology.Citation37 The protein-ligand complexes in a cubic box were being solvated with SPC water molecule and the distance between the box and protein should be of 1nm. Each system was equilibrated to a neutral change by adding the required ion groups (Cl− and Na+) to neutralize the charge. After preparing the system energy minimization was done using the steepest descents method and the maximum force was less than 10.0 KJ/mol. The NVT (constant number of particles, volume, and temperature) and NPT (constant number of particles, pressure, and Temperature) parameters were employed to stabilize the temperature and pressure of the solvent to 300K and 1 bar, respectively. Eventually, MD simulation of each of the complexes were performed for 30ns.Citation38
Statistical Analysis
Data were analyzed using the software, GraphPad Prism version 5.01. All experiments were repeated independently at least three times, and the results are demonstrated as Mean±SD. The data were analyzed and compared using two-way ANOVA and regression analysis. p <0.05 was considered statistically significant.
Results
KP Possesses the Anti-Oxidant Potential
The free radical scavenging activity of the methanolic solution of KP is illustrated in . It was observed that KP showed slightly higher scavenging activity than ascorbic acid. The scavenging activity was directly associated with the concentration of KP. At 0.5µM, the percentage radical scavenging activity of KP was 31.8% and it increased to 57.2% at a concentration of 4µM. At higher concentrations, we observed that the scavenging activity of KP got stagnant. In the case of ascorbic acid, the radical scavenging activity was found to be 30.49% at concentration 0.5µM, 33.18% at 4 µM, and 42.30% at 16µM.
Figure 2 Evaluation of the anti-oxidant potential of KP. (A) Percentage radical scavenging activity of KP and Ascorbic acid as assessed by DPPH assay. (B) The graph depicting the ferric ion-reducing power of KP was assessed through FRAP assay. The X-axis represents concentration(µM), while the Y-axis denotes absorbance(nm). All data are representative of 3 independent experiments (Mean ± SD).
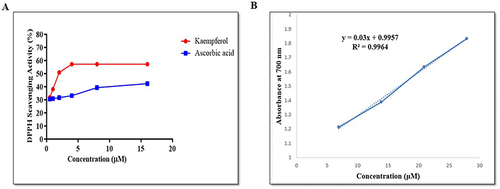
Next, the reducing potential of KP was evaluated using FRAP assay. The FRAP value was obtained by plotting the graph between the concentration of KP (6.9–27.9µM) vs absorbance obtained. The curve was found to be linear in the concentration range (). The result demonstrated that the ferric reducing power of KP was increased from 0.0063 to 0.0285 at concentrations 6.9 to 27.9µM. A higher absorbance represents higher reducing power. These findings showed that KP possesses anti-oxidant potential.
KP Exerts a Cytotoxic Effect on Liver Cancer Cells
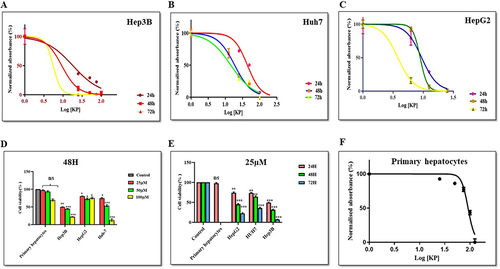
We performed MTT assay to define the IC50 value of KP. To test the effect of KP on growth kinetics, Hep3B (), Huh7 (), and HepG2 () cells were exposed to various concentrations and were grown for 24, 48, and 72h. A dose-and time-dependent decline in the viability of liver cancer cells was observed in the treated group as compared to the vehicle-treated cells ( and ). Additionally, minimal effects were observed on the viability of primary hepatocytes (). The IC50 values observed in different cell lines and at different time points are described in . Compared with the other cells, Hep3B was found to be most sensitive to KP treatment (as least IC50 observed). Therefore, Hep3B cells were selected for use in further experimentation.
Table 3 IC50 Value of KP of Different Human Liver Cancer Cell Lines and a Non-Hepatic Cancer Cell Line
Figure 3 Effect of KP on the viability of various liver cancer and normal cells. KP exerted an inhibitory effect on the viability of (A) Hep3B (B) Huh7 and (C) HepG2 cells when incubated at varying concentrations (6.25–100µM) at different time intervals. It exerted a minimal effect on the cell viability of (D) Primary hepatocytes. Inhibition of cell viability was measured by MTT assay. KP significantly inhibited cell viability in a (E) dose-dependent and (F) time-dependent manner. *P<0.05, **P<0.01 and ***P<0.001 compared with respective control. All data are representative of 3 independent experiments (Mean ± SD).
KP Inhibits the Migration of HCC Cells
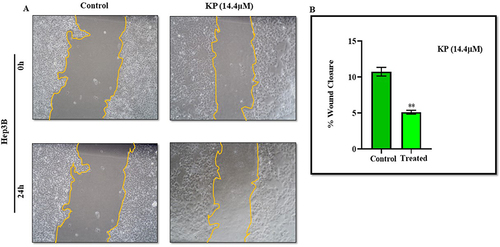
We investigated the effect of KP on the motility of Hep3B cells via scratch assay at a sub-IC50 concentration (14.4µM). The results indicated that KP treatment impairs Hep3B cell migration with respect to control cells (). The percentage of wound closure was found to be about 4.9% in the treatment group whereas in the control group cells migrated by 13.8%. KP inhibited cell migration by depicting the lower propensity of scratch closure in the treated cells as compared to vehicle-treated cells ().
Figure 4 Inhibitory effect of KP on the migratory potential of Hep3B cells. (A) In the scratch assay, Hep3B cells were treated with KP at a sub-inhibitory concentration (14.4µM) for 24h and the photographs were taken at 0h and 24h under a microscope. (B) The percentage of cell migration is presented in the bar graph. All data are representative of 3 independent experiments (Mean ± SD). **P<0.01 with respect to control.
KP Induces Apoptosis in Hep3B Cells
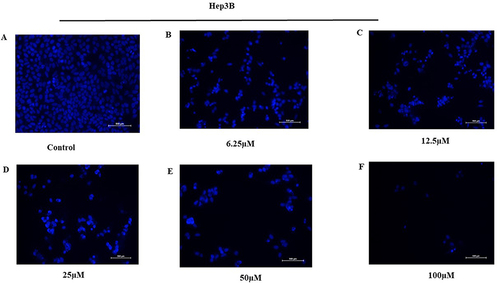
The effect of KP on the induction of apoptosis of Hep3B cells was evaluated by Hoechst 33258 staining. Treatment of cells with KP (6.25–100µM) for 48h produced typical apoptotic morphological characteristics indicating cell apoptosis. We observed cellular changes such as membrane blebbing, nuclear fragmentation, chromatin condensation, and the formation of apoptotic bodies as depicted in .
Figure 5 Effect of KP on the induction of apoptosis and cell cycle. Hep3B cells were treated (A) without and with (B) 6.25µM (C) 12.5µM (D) 25µM (E) 50µM (F) 100µM of KP respectively for 48h and visualized under a fluorescence microscope. The cell showed typical apoptotic morphological features upon KP treatment.
KP Arrests Cell Cycle at G0/G1 Phase
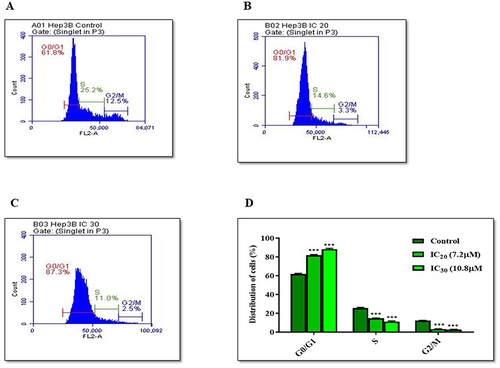
To define whether the effect of KP on cell viability was associated with cell cycle arrest, flow cytometric analysis was performed. In the untreated group, 61.8% of cells accumulated in the G0/G1 phase, 12.5% in G2/M, and 25.2% in the S phase (). When the cells were treated with IC20 (7.2µM) of KP, 81.9% of cells accumulated in the G0/G1 phase, 3.3% in the G2/M phase, and 14.6% in the S phase (). However, KP treatment at IC30 (10.8µM) significantly increased the percentage of Hep3B cells in the G0/G1 phase to 87.3% and decreased the proportion of cells in the G2/M and S phases (2.5% and 11%) respectively (). This clearly shows that KP arrested cells at the G0/G1 phase ().
Figure 6 Cell cycle analysis of Hep3B Cells treated with KP. For the cell cycle analysis, Hep3B cells were treated (A) without KP and with (B) IC20 and (C) IC30 of KP for 24h. After treatment, the cell cycle distribution was determined by flow cytometry. (D) Bar diagram depicting the percentage of the cells in different phases of the cell cycle. All data are representative of 3 independent experiments (Mean ± SD). ***P<0.001 vs its control group.
KP Modulates the Expression of Several Apoptosis-Related Genes in Hep3B Cells
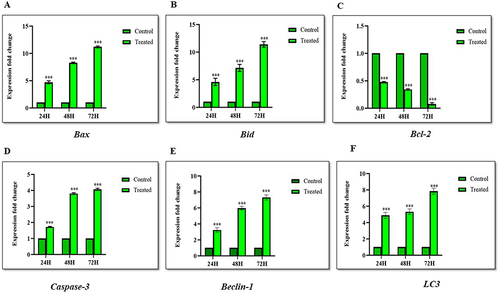
We analyzed the expression of key genes involved in regulating apoptosis using RT-qPCR. The expression levels of the Bax gene (p < 0.0001) () and Bid gene (p < 0.0001) () upon KP treatment at sub-IC50 concentration were significantly upregulated, showing fold increases of 5.2, 7.5, and 11.9 for Bax, and 4.6, 8.3, and 11.2 for Bid at 24, 48, and 72 hours, respectively. Additionally, there was a significant decrease in mRNA levels of Bcl-2 (p < 0.0001) () in the KP-treated cells, with a reduction to ≤ 0.47-fold. Correspondingly, the expression of executioner caspase-3 increased significantly, showing fold changes of 1.7, 3.8, and 4.1 at different time intervals following KP treatment ().
Figure 7 Expression level of apoptosis and autophagy-related genes following KP treatment in Hep3B cells. The Hep3B cells were treated for 24, 48, and 72h, and the expression levels of (A) Bax, (B) Bid, (C) Bcl-2, (D) Caspase-3, (E) Beclin-1 and (F) LC3 were analyzed by RT-qPCR. All data are representative of 3 independent experiments (Mean ± SD). ***P<0.001 compared with their respective controls.
KP Induces Autophagy in Hep3B Cells
To study KP-induced autophagy, we investigated the expression of Beclin-1 and LC3 at different time intervals. The expression levels of Beclin-1 (p < 0.0001) () were upregulated by ≤ 7.5 folds whereas LC3 (p < 0.0001) () expression was significantly increased in a time-dependent manner by ≤ 8.1 folds. This showed that KP not only promotes apoptosis but also induces autophagy in Hep3B cell lines.
KP Induces Apoptosis Upon Autophagy Inhibition in Hep3B Cells
We investigated the effect of KP on the inhibition of autophagy-induced apoptosis in Hep3B cells in the presence and absence of autophagy inhibitors: 3-methyladenine (3-MA) and Chloroquine (CQ). Cell viability was significantly reduced in Hep3B cells treated with KP (14.4µM) and 3-MA (2mM) or CQ (25µM). Cell viability was 64.1% when the cells were treated with KP alone which dropped to 41.2% and 27.2% when KP was given in combination with 3-MA and CQ respectively ().
Figure 8 Inhibition of autophagy enhances apoptosis induced by KP in Hep3B cells. (A) The effect of 3-MA and CQ alone and in combination with KP on the viability of Hep3B cells was evaluated. Cells were treated with 14.4µM KP for 48h with or without pre-treatment of 3-MA (2mM) and CQ (25µM) for 1h. The expression levels of (B) Beclin-1 and (C) LC3 in Hep3B cells were investigated with or without pre-treatment of 3-MA and CQ. The expression levels of (D) Caspase-3 and (E) Bcl-2 genes in Hep3B cells were measured in the presence and absence of 3-MA and CQ. All data are representative of 3 independent experiments (Mean ± SD). ***P<0.001 v/s vehicle control. ###P<0.001 v/s KP alone.
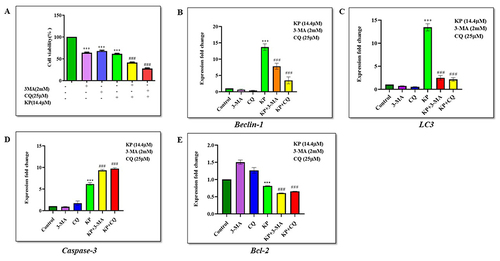
We next investigated the effect of KP on the mRNA expression levels of Beclin-1 and LC3 in the presence of 3-MA and CQ. The results showed that 3-MA and CQ treatment on Hep3B cells significantly decreased the expression of Beclin-1 (p < 0.0001) by 0.7, and 0.4 folds respectively, whereas LC3 (p < 0.0001) levels was downregulated by 0.6, and 0.5 folds for 3-MA and CQ. However, KP treatment in combination with 3-MA and CQ significantly upregulated the expression levels of Beclin-1 (p < 0.0001) and LC3 (p < 0.0001) by 8.6, 4.6, 2.9, and 2.5 folds respectively, when compared with the 3-MA and CQ treated group shown in and .
Furthermore, we evaluated the effect of KP on the expression pattern of apoptotic genes in the presence of 3-MA or CQ. The results demonstrated that the expression of caspase-3 (p < 0.0001) was increased significantly by 9.5, and 9.9 folds with the combined treatment of KP and 3-MA or CQ compared with either KP, 3-MA, or CQ alone in Hep3B cells (). However, in , we observed that 3-MA and CQ treatment upregulated the expression of Bcl-2 (p < 0.0001) to 1.5 and 1.3 folds when compared with control and KP. Additionally, KP downregulated the expression of Bcl-2 (p < 0.0001) to 0.6 folds when given in combination with 3-MA and CQ. These findings suggest that autophagy induced by KP exerted an inhibitory effect on the apoptotic mechanism of liver cancer cells.
In silico Studies
Functional Domain Analysis
The Pfam results uncovered functional domains for proteins P3 (Nrf2), P6 (IRE1-α), and P7 (PERK) are mentioned in . Other proteins showed poor coverage and percentage identity. Therefore, templates of P3, P6, and P7 were further used for homology modeling of the selected target proteins.
Table 4 Functional Domain Analysis of Selected Proteins
Structural Modeling and Model Validation
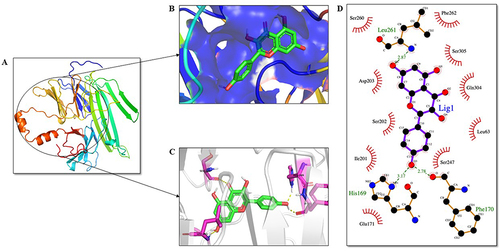
The secondary structures for selected proteins P3 (Nrf-2), P6 (IRE1-α), and P7 (PERK) were generated by Phyre2 intensive mode. The docking sites for the proteins were concluded by relating the results obtained from the CASTp server depicted in with surface representation via PyMOL. The bZIP domain of Nrf-2 was modeled with 100% confidence and 98% query coverage as shown in . Domain region for P6 was modeled with 100% confidence and 90% alignment . Likewise, 90% of residues were modeled with 100% confidence in the PQQ domain of PERK protein . The Ramachandran plot assessment through the Ramachandran plot server revealed that the predicted model of the bZIP domain had 100% residues lying in the favored region. There were 98% and 97% residues lying in the favored region for P6 and P7.
Figure 9 Analysis of bZIP domain of Nrf2 protein and ligand interaction. KP is highlighted in green as a stick representation. (A) Three-dimensional structure of the bZIP domain of Nrf2. (B) The active site of the Nrf2 protein is shown in blue color. (C) Residues of the ligand interacting with the protein are shown in pink color. (D) The two-dimensional plot of the molecular interactions taking place between protein-ligand complex where hydrogen bond interactions are shown in green dotted lines and hydrophobic residues are shown in red.
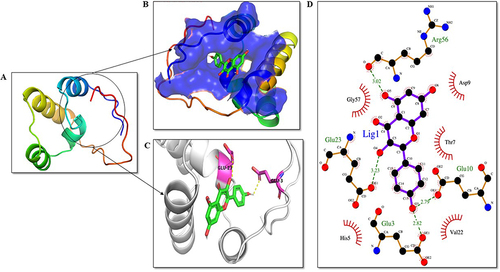
Figure 10 Analysis of IRE1-α domain-ligand interaction. KP is highlighted in green as a stick representation. (A) Three-dimensional structure of the domains of IRE1-α protein. (B) Depiction of the active site of the protein. (C) Residues of the ligand interacting with the protein are shown in pink color. (D) The two-dimensional plot of the molecular interactions occurring between protein-ligand complex where hydrogen bond interactions are shown in green dotted lines and hydrophobic residues are shown in red.
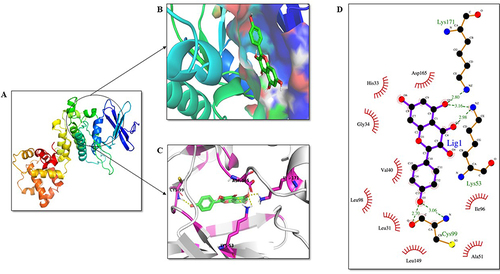
Figure 11 Analysis of PERK PQQ domain-ligand interaction. KP is highlighted in green as a stick representation. (A) Three-dimensional structure of the PQQ domain of PERK. (B) The active site of the PERK protein is shown in blue color. (C) Residues of the ligand interacting with the protein are shown in pink color. (D) The two-dimensional plot of the molecular interactions occurring between protein-ligand complex where hydrogen bond interactions are shown in green dotted lines and hydrophobic residues are shown in red.
Receptor-Ligand Interaction
The receptor-ligand molecular interactions were done to calculate the binding energy of KP with the selected ER stress-related proteins. It was observed that KP showed the best binding affinity with three proteins: Nrf2, IRE1-α, and PERK. The results are summarized in .
Table 5 Receptor-Ligand Interaction of the Selected Proteins
MD Simulation Analysis
MD simulation provided detailed information of the structural stability of the protein-ligand complexes (time span, 30ns) generated through molecular docking studies. The protein-ligand complexes were P3_KP, P6_KP, and P7_KP with a binding score of −7.8, −7.8, and −9.1Kcal/mol respectively. MD Simulation showed the stability of the protein-ligand complexes within the solution during the simulation period ().
Figure 12 Molecular dynamic simulation of protein Nrf2 (P3). (A) Root-mean-square deviations (RMSDs) of the KP docked complex. The red graph represents the protein backbone and the blank represents the ligand. (B) RMSF plots of the protein-ligand complexes along with the residue number displayed on the x-axis and RMSFs (in nm) on the y-axis. (C) Plots for the radius of gyration (Rg) show the overall compactness of the system. (D) Ligand shown in the green color showed stable binding in the protein cleft. (E) The two-dimensional representation of protein-ligand interaction after MD simulations.
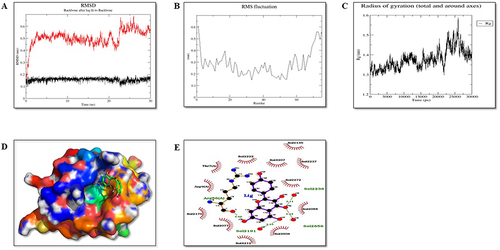
Figure 13 Molecular dynamic simulation of protein IRE1-α (P6). (A) Root-mean-square deviations (RMSDs) of IRE1-α and KP docked complex. The black graph represents the protein backbone, and the red is the ligand. (B) RMSF plots of the protein-ligand complexes along with the residue number displayed on the x-axis and RMSFs (in nm) on the y-axis. (C) Plots for the radius of gyration (Rg) show the overall compactness of the system. (D) Ligand shown in the green color showed stable binding in the protein cleft. (E) The two-dimensional representation of protein-ligand interaction after MD simulations.
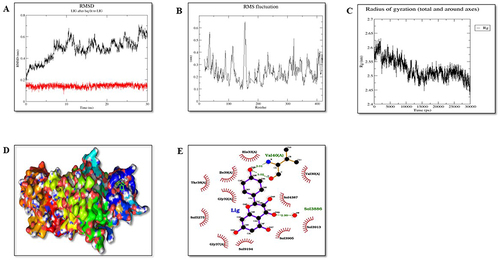
Figure 14 Molecular dynamic simulation analysis of protein PERK (P7). (A) Root-mean-square deviations (RMSDs) of PERK and KP docked complex. The red graph represents the protein backbone whereas the black represents ligand. (B) RMSF plots of the protein–ligand complexes along with the residue number displayed on the x-axis and RMSFs (in nm) on the y-axis. (C) Plots for the radius of gyration (Rg) show the overall compactness of the system. (D) Ligand shown in the green color showed stable binding in the protein cleft. (E) The two-dimensional representation of protein-ligand interaction after MD simulations.
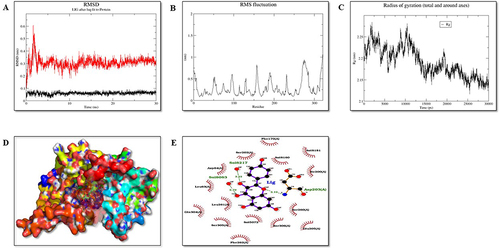
RMSD plot plays an important role in determining the equilibration of molecular dynamics trajectories. Our results showed that the backbone atoms of the protein in the presence of KP deviated around 0.45 to 0.67nm, 0.2 to 0.65, and 0.1 to 0.6nm for Nrf2, IRE1-α and PERK, respectively. Further, root means square frequency (RMSF) fluctuation of the protein backbone in the presence of KP was calculated as shown in . Residue level fluctuation on the backbone of protein Nrf2, IRE1-α, and PERK was generated, which showed fluctuations in the terminal regions, lops and in the residues involved in the binding sites.
The radius of gyration (Rg) represents compactness. Our results showed that the Rg value of the protein-ligand complexes was between 1.3 to 1.6 nm for P3, 2.45 to 2.62nm for P6 and 2.13 to 2.27nm for P7 ().
In conclusion, all the protein-ligand complexes are overall stable during the period of 30ns MD simulation. Based on binding affinity, P7 protein-ligand complex is the most stable and the ligand remains within the cleft region, P3 and P6 complexes are also stable over the duration of 30ns MD simulation with the fine movement of ligand near the cleft region ().
KP Induces ER Stress in HCC Cells
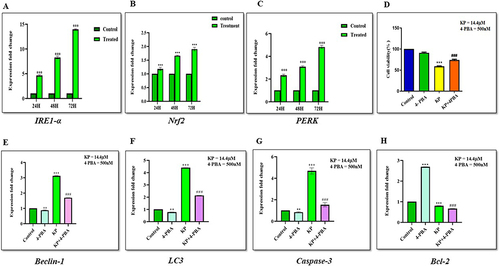
To further elucidate the cell death mechanism induced by KP, we investigated the effect of KP on the ER stress markers (Nrf2, IRE1-α, and PERK). The results revealed that KP (sub-IC50 concentration) upregulated the expression of IRE1-α (p < 0.0001) (), Nrf2 (p < 0.0001) (), and PERK (p < 0.0001) () by ≤ 1.9, ≤14.1, and ≤ 4.9 respectively, in a time-dependent manner indicating that KP-induced cell death is linked with the induction of ER stress pathway. To further validate these results, we evaluated the effect of KP on cell viability in the presence of 4-PBA. We observed the viability of the cells was significantly increased when treated with the combination of KP and 4-PBA (75.5%) as compared to KP alone (58.6%) as depicted in .
Figure 15 Expression levels of ER-stress markers following KP treatment in the presence or absence of ER-stress inhibitor (4-PBA) in Hep3B cells. The Hep3B cells were treated for 24, 48, and 72h, and then the expression levels of (A) IRE1-α, (B) Nrf2, and (C) PERK were analyzed by RT-qPCR. Inhibition of ER Stress by 4-PBA enhances autophagy and apoptosis in Hep3B cells. Cells pretreated with (D) 4-PBA showed higher cell viability compared with the KP alone group. The mRNA expression level of (E) Beclin-1 (F) LC3 (G) Caspase-3 and (H) Bcl-2 were determined by RT-qPCR. All data are representative of 3 independent experiments (Mean ± SD). **P<0.01 and ***P<0.001 v/s vehicle control. ###P<0.001 v/s KP alone.
4-PBA Attenuates KP Induced Autophagy and Apoptosis in Hep3B Cells
We evaluated the effect of KP on the expression level of autophagy and apoptosis-related genes in the presence of 4-PBA. The results showed that treatment with 4-PBA significantly reduced the expression of Beclin-1 (p < 0.0001) to 0.8 folds (), LC3 (p < 0.0001) to 0.7 folds (), and Caspase-3 (p < 0.0001) to 0.8 folds () and upregulated the expression of Bcl-2 (p < 0.0001) by 2.6 folds () as compared with the control and KP-treated groups. However, the expression of autophagy and apoptosis-related genes except for Bcl-2 (p < 0.0001, 0.6 folds) were significantly upregulated in 4-PBA combined with the KP group. Taken together, these data indicated that KP-induced cell death in Hep3B cells was associated with ER stress response.
Discussion
Abnormal ROS production and suppression of anti-oxidant defense systems are known to contribute to the pathogenesis of a variety of diseases including cancers.Citation39,Citation40 Higher levels of ROS may promote tumor development and progression by persuading nuclear DNA mutations and thereby activate oncogenic signaling pathways.Citation39 Therefore, potential anti-oxidants are required to prevent cancer and augment chemotherapies for numerous malignancies.Citation10 In the current study, we evaluated the anti-oxidant activity of KP through DPPH and FRAP assay. DPPH is a free radical that has the potential to gain an electron to produce a stable molecule whereas in the FRAP assay, the Fe3+ ion is reduced to Fe2+ by anti-oxidant compounds, resulting in the development of a colored ferrous complex from a colorless ferric-probe complex. From the obtained results, it was obvious that KP exhibited excellent free radical scavenging and anti-oxidant properties. These results were similar to the studies conducted by Csepregi and team, and Liu and team.Citation41,Citation42 Then, we extended our investigation to evaluate the role of KP as a potential chemotherapeutic agent.
The cytotoxic profile of KP was evaluated through MTT assay. The MTT assay measures cellular metabolic activity indicating cell viability, proliferation, and cytotoxicity.Citation43 Our results demonstrated a dose- and time-dependent reduction in the viability of liver cancer cells. Additionally, KP (25–100µM) exerted a negligible effect on the viability of primary hepatocytes conferring that normal liver cells are substantially more impervious to growth suppression compared with cancerous cells.
We next investigated the effect of KP on cell migration of Hep3B cells. Several pieces of research have revealed that flavonoids can obstruct cell migration of cancer cells through different mechanisms.Citation44,Citation45 Our results for the cell migration assay showed that KP exerted an inhibitory effect on the migratory potential of Hep3B cells. Previous studies have reported that flavonoids could promote cell death by inducing cell cycle arrest and activating apoptosis through intrinsic and extrinsic mitochondrial pathways. In this study, we investigated the distribution of cells through flow cytometry. Our results showed that KP treatment accumulated cells in the cell cycle’s G0/G1 phase, which indicates that cells will not reach the preparatory phase for division. Similar results were reported by Yang and the team where they showed that KP arrests the cell cycle at the G0/G1 phase in ovarian cancer through MEK/ERK and STAT pathways.Citation46 Additionally, KP-treated cells when stained with Hoechst dye showed nuclear shrinkage, chromatin condensation, and formation of apoptotic bodies. Understanding apoptosis in HCC is crucial, as its normal functioning suppresses tumor initiation and progression by eliminating aberrant cells. Dysregulation of apoptosis promotes tumor growth and therapy resistance.Citation47 Therefore, elucidating the mechanisms underlying apoptosis dysregulation in HCC is crucial for developing effective therapeutic strategies and improving patient outcomes. Building upon our previous findings, we further validated our results using qRTPCR, and revealed that KP treatment augmented the expression of pro-apoptotic genes including Bax and Bid along with the executioner caspase, Caspase-3. Bax facilitates mitochondrial membrane permeabilization, leading to cytochrome c release, while Bid connects extrinsic and intrinsic apoptotic pathways by promoting cytochrome c release. These genes are pivotal in initiating apoptosis by activating downstream apoptotic signaling cascades.Citation48 Conversely, a notable decrease was observed in the expression levels of the anti-apoptotic gene, Bcl-2, renowned for its role in promoting tumor cell survival by inhibiting apoptosis.Citation49 Elevated Bcl-2 levels in HCC disrupt the balance between pro- and anti-apoptotic factors, fostering resistance to cell death mechanisms. Dysregulation of Bax, Bid, Caspase-3, and Bcl-2 in HCC can lead to aberrant apoptotic signaling, supporting tumor survival and progression. Similar results were observed in the study conducted by Subramani and team where nimbolide induced apoptosis in pancreatic cancer cell lines (HPAC, MIAPaCa-2, and PANC-1) by promoting ROS generation and inhibiting epithelial-to-mesenchymal transition.Citation50 Subsequently, following the investigation into apoptosis, we studied and explored autophagy as another molecular mechanism of KP in HCC.
Autophagy is a cell survival-promoting mechanism that plays a crucial role in cell development, growth, and progression of tumors including HCC. It exhibits a dual role: while it can facilitate tumor advancement by providing nutrients and enhancing cell survival in harsh tumor microenvironments, it may also exert tumor-suppressive effects by removing damaged organelles and dampening inflammation, thus hindering the initiation and progression of HCC.Citation51 This complex interplay between autophagy and HCC highlights its potential as a potential therapeutic target and as a factor contributing to therapy resistance.Citation52 Thus, in this study, we investigated whether KP could induce autophagy in HCC and our results showed that KP treatment enhances autophagy in Hep3B cells, as evidenced by the upregulation of the expression levels of key autophagy-related genes, Beclin-1 and LC3. This finding depicts the ability of KP to stimulate the autophagy process in HCC cells, suggesting its potential as a therapeutic agent for HCC treatment. To further understand the role of autophagy in KP-induced cell death, we evaluated the mRNA levels of autophagy-related genes in the presence of autophagy inhibitors, 3-methyladenine (3-MA), and Chloroquine (CQ). Despite the presence of these inhibitors, which are known to block different stages of the autophagy process, KP treatment still resulted in the upregulation of Beclin-1 and LC3 expression. This indicates that KP-induced autophagy occurs independently of the inhibition mediated by 3-MA and CQ, highlighting the induction of autophagy by KP in Hep3B cells. Furthermore, our study revealed that pharmacological suppression of autophagy significantly increased KP-induced apoptosis in Hep3B cells. This suggests that autophagy plays a protective role against KP-induced cell death, emphasizing the intricate interplay between autophagy and apoptosis in response to KP treatment. These findings suggest that targeting autophagy-associated cell death pathways may offer a promising approach for treating HCC. Interestingly, our findings are consistent with previous studies in other cancer cell lines. For instance, Liu et al demonstrated an active fraction of clove induced autophagy in HCT-116 cell lines through the PI3K/AKT/mTOR-mediated pathway.Citation53 Additionally, the extract from the tuber of Amorphophallus was found to induce apoptosis and autophagy, inhibiting the growth and proliferation of SGC-7901 and AGS cancer cells.Citation54 These studies further support the potential therapeutic relevance of autophagy modulation in cancer treatment, including HCC.
Various cellular stresses (oxidative stress, pH imbalance, nutrient distress, etc) lead to the accumulation of misfolded/poorly folded proteins in the ER lumen giving rise to ER stress which further activates the UPR signaling cascade.Citation29,Citation55 This signaling can act as a buffer against ER stress, orchestrating the recovery of ER function and re-establishing its homeostasis by activating transmembrane proteins including ATF6, IRE1-α, and PERK. However, under prolonged ER stress, UPR may also lead to cell death through various signaling cascades. Thus, in the current study, we have utilized in silico approaches to investigate the underlying molecular mechanism involved in HCC.
Molecular docking is an established structure-based drug design technique that provides relevant information about the binding affinity between the ligand and proteins.Citation56 Although the binding energies derived after docking are not always reliable but can be used to select a new molecule which can then be experimentally validated.Citation25 With the help of molecular docking, we initially screened the binding potential of KP with the important proteins involved in ER stress, and three proteins (Nrf2, PERK, and IRE1-α) were shortlisted from this screening.
To validate our results of docking studies, we next performed MD simulations for the selected proteins (obtained from docking results) with KP to evaluate protein movement and flexibility, and complex stability. The RMSD values for the proteins P3 (Nrf2), P6 (IRE1-α), and P7 (PERK) showed the stable binding of the KP at the binding pocket. These findings were further validated by RMSF and Rg value plots. The RMSF value focuses on local structures’ movement in protein cavities while conducting MD simulation. Our results revealed low residual fluctuation with these proteins indicating that binding with KP caused minimal changes in protein structures. Rg is the root-mean-square distance from each atom of the system to its center of mass indicating the protein structure compactness.Citation25 This negligible structural deviation observed in our results was accountable for the stable Rg equilibrium during the simulation. Interestingly, we found that autophagy and apoptosis are two entirely different cell death mechanisms involving a variety of regulator proteins. Besides these two important molecular pathways, ER stress is a cell sensor that helps in monitoring and maintaining cellular homeostasis. The interplay between autophagy, apoptosis, and ER stress in HCC is a complex and dynamic process with significant implications for cell survival and death. In our study, we observed that KP promoted HCC cell death through autophagy-related ER stress pathways. This is consistent with findings from previous studies demonstrating that KP triggers ER stress-mediated autophagy,Citation57 which serves as a protective mechanism to eliminate unwanted organelles and misfolded proteins, thereby suppressing further activation of apoptosis.
Specifically, we investigated the effect of KP on the viability of liver cancer cells in the presence and absence of an ER stress inhibitor, 4-PBA. Interestingly, we found that KP reduced cell viability even in the presence of 4-PBA, indicating its potent cytotoxic potential. To further elucidate the molecular mechanisms underlying this effect, we examined KP-induced apoptosis and autophagy in 4-PBA-treated Hep3B cells through gene expression analysis. Our results revealed that pre-treatment with 4-PBA reduced the mRNA levels of key autophagy-related genes such as Beclin-1 and LC3, as well as the apoptosis-related gene Caspase-3, while increasing the expression of the anti-apoptotic gene Bcl-2. These findings suggest that inhibition of ER stress by 4-PBA attenuated both autophagy and apoptosis pathways, potentially conferring a survival advantage to the liver cancer cells. However, KP treatment reversed the effects of 4-PBA, leading to the upregulation of autophagy-related genes and the downregulation of Bcl-2, ultimately promoting cell death in liver cancer cells. This suggests that KP may override the inhibitory effects of 4-PBA on ER stress, leading to the reactivation of autophagy and apoptosis pathways, which ultimately contribute to cell death. The results were similar to those observed in HCC after treatment with KP.Citation58,Citation59 Thus, our findings highlight the intricate interplay between autophagy, apoptosis, and ER stress in HCC and underscore the potential of KP as a therapeutic agent targeting these pathways.
Conclusion
The present study reported that KP inhibited the viability of HCC cells and suppressed proliferation by arresting the cells at the G0/G1 phase. Additionally, it promoted apoptosis through the intrinsic mitochondrial apoptotic pathway and autophagy by upregulating the expression of Beclin-1 and LC3. To further elucidate its mechanism of action we employed a consolidated approach including molecular docking, MD simulation, and in vitro study to identify the potential target involved in ER stress pathway. The results suggest that KP interfered with the ER stress signaling pathway involved in liver cancer. Therefore, it might be a potential anti-cancer agent for the treatment of HCC. Further, in vivo, studies are required to better understand the role and molecular mechanism of KP in HCC.
Author Contributions
All authors made a significant contribution to the work reported, whether that is in the conception, study design, execution, acquisition of data, analysis and interpretation, or in all these areas; took part in drafting, revising or critically reviewing the article; gave final approval of the version to be published; have agreed on the journal to which the article has been submitted; and agree to be accountable for all aspects of the work.
Disclosure
The authors declare no conflicts of interest in this work.
Acknowledgment
We acknowledge Kumari Chandan for her help in molecular biology techniques.
Additional information
Funding
References
- Sharma N, Biswas S, Al-Dayan N, Alhegaili AS, Sarwat M. Antioxidant role of kaempferol in the prevention of hepatocellular carcinoma. Antioxidants. 2021;10(9):1419–1436. doi:10.3390/antiox10091419
- Bahaji Azami NL, Sun M. Zeaxanthin dipalmitate in the treatment of liver disease. Evid Based Complement Alternat Med. 2019;2019:1475163–1475178. doi:10.1155/2019/1475163
- Mandlik DS, Mandlik SK. Herbal and natural dietary products: upcoming therapeutic approach for prevention and treatment of hepatocellular carcinoma. Nutr Cancer. 2021;73(11–12):2130–2154. doi:10.1080/01635581.2020.1834591
- Choudhari AS, Mandave PC, Deshpande M, Ranjekar P, Prakash O. Phytochemicals in cancer treatment: from preclinical studies to clinical practice. Front Pharmacol. 2019;10:1614–1631. doi:10.3389/fphar.2019.01614
- Imran M, Salehi B, Sharifi-Rad J, et al. Kaempferol: a key emphasis to its anticancer potential. Molecules. 2019;24(12):2277–2293. doi:10.3390/molecules24122277
- Sethi G, Rath P, Chauhan A, et al. Apoptotic mechanisms of quercetin in liver cancer. Recent trends and advancements. Pharmaceutics. 2023;15(2):712–732. doi:10.3390/pharmaceutics15020712
- Wu L, Li J, Liu T, et al. Quercetin shows anti-tumor effect in hepatocellular carcinoma LM3 cells by abrogating JAK2/STAT3 signaling pathway. Cancer Med. 2019;8(10):4806–4820. doi:10.1002/cam4.2388
- Seydi E, Salimi A, Rasekh HR, Mohsenifar Z, Pourahmad J. Selective cytotoxicity of luteolin and kaempferol on cancerous hepatocytes obtained from rat model of hepatocellular carcinoma: involvement of ROS-mediated mitochondrial targeting. Nutr Cancer. 2018;70(4):594–604. doi:10.1080/01635581.2018.1460679
- Han B, Yu YQ, Yang QL, Shen CY, Wang XJ. Kaempferol induces autophagic cell death of hepatocellular carcinoma cells via activating AMPK signaling. Oncotarget. 2017;8(49):86227–86239. doi:10.18632/oncotarget.21043
- Gupta M, Yadav V, Sarwat M. Pharmacological importance of the active molecule “guggulsterone” in overall human health. In: Herbal Medicines. Netherlands: Academic press. Amsterdam; 2022:191–206.
- Lee J, Kim JH. Kaempferol inhibits pancreatic cancer cell growth and migration through the blockade of EGFR-related pathway in vitro. PLoS One. 2016;11(5):e0155264–e0155275. doi:10.1371/journal.pone.0155264
- Kari S, Subramanian K, Altomonte IA, Murugesan A, Yli-Harja O, Kandhavelu M. Programmed cell death detection methods: a systematic review and a categorical comparison. Apoptosis. 2022;27:482–508. doi:10.1007/s10495-022-01735-y
- Ryter SW, Cloonan SM, Choi AM. Autophagy: a critical regulator of cellular metabolism and homeostasis. Mol and Cells. 2013;36:7–16. doi:10.1007/s10059-013-0140-8
- Xi H, Wang S, Wang B, et al. The role of interaction between autophagy and apoptosis in tumorigenesis. Oncol Rep. 2022;48:1–16. doi:10.3892/or.2022.8423
- Rakesh R, PriyaDharshini LC, Sakthivel KM, Rasmi RR. Role and regulation of autophagy in cancer. Biochimica et Biophysica Acta (BBA)-Mole Bas Dis. 2022;1868:166400–166422. doi:10.1016/j.bbadis.2022.166400
- Fan Y, Ullman E, Zong WX. The cellular decision between apoptosis and autophagy. Bey Apop. 2008;2008:141–156.
- Kouroumalis E, Tsomidis I, Voumvouraki A. Pathogenesis of hepatocellular carcinoma: the interplay of apoptosis and autophagy. Biomed. 2023;11:1166. doi:10.3390/biomedicines11041166
- Wang G, Jiang X, Torabian P, Yang Z. Investigating autophagy and intricate cellular mechanisms in hepatocellular carcinoma: emphasis on cell death mechanism crosstalk. Can Lett. 2024;588:216744–216760. doi:10.1016/j.canlet.2024.216744
- Hayashi-Nishino M, Fujita N, Noda T, Yamaguchi A, Yoshimori T, Yamamoto A. Electron tomography reveals the endoplasmic reticulum as a membrane source for autophagosome formation. Autophagy. 2010;6:301–303. doi:10.4161/auto.6.2.11134
- Wu H, Cui M, Li C, et al. Kaempferol reverses aerobic glycolysis via miR-339-5p-mediated PKM alternative splicing in colon cancer cells. J Agric Food Chem. 2021;69(10):3060–3068. doi:10.1021/acs.jafc.0c07640
- Pavlović N, Heindryckx F. Exploring the role of endoplasmic reticulum stress in hepatocellular carcinoma through the mining of the human protein atlas. Biology. 2021;10(7):640–655. doi:10.3390/biology10070640
- Bonsignore G, Martinotti S, Ranzato E. Endoplasmic reticulum stress and cancer: could unfolded protein response be a druggable target for cancer therapy? Int J Mol Sci. 2023;24(2):1566. doi:10.3390/ijms24021566
- Kwon J, Kim J, Kim KI. Crosstalk between endoplasmic reticulum stress response and autophagy in human diseases. Ani Cell Sys. 2023;27:29–37. doi:10.1080/19768354.2023.2181217
- Kim YS, Kim SG. Endoplasmic reticulum stress and autophagy dysregulation in alcoholic and non-alcoholic liver diseases. Clin Mol Hepatol. 2022;26:715–727. doi:10.3350/cmh.2020.0173
- Gupta M, Ghufran SM, Kausar T, et al. Z-Guggulsterone is a potential lead molecule of Dawa-ul-Kurkum against hepatocellular carcinoma. Molecules. 2022;27(16):5104–5123. doi:10.3390/molecules27165104
- Sharma N, Gupta M, Nabi G, Biswas S, Ali S, Sarwat M. Variation in the anti-oxidant, anti-obesity, and anti-cancer potential of different polarity extracts of saffron petals. 3. Biotech. 2023;13(7):249–261. doi:10.1007/s13205-023-03669-x
- Kelley LA, Mezulis S, Yates CM, Wass MN, Sternberg MJ. The Phyre2 web portal for protein modeling, prediction and analysis. Nat Protoc. 2015;10(6):845–858. doi:10.1038/nprot.2015.053
- Kumar R, Gupta M, Sarwat M. Bioinformatics in Drug Design and Delivery. In: Computer Aided Pharmaceutics and Drug Delivery. An Application Guide for Students and Researchers of Pharmaceutical Sciences. Singapore: Springer Nature; 2022:641–664.
- Bhattacharya D, Cheng J. i3Drefine software for protein 3D structure refinement and its assessment in CASP10. PLoS One. 2013;8(7):69648–69663. doi:10.1371/journal.pone.0069648
- Lemkul JA. From proteins to perturbed Hamiltonians: a suite of tutorials for the GROMACS-2018 molecular simulation package [Article v1.0]. LiveCoMS. 2019;1(1):1–53. doi:10.33011/livecoms.1.1.5068
- Anderson RJ, Weng Z, Campbell RK, Jiang X. Main‐chain conformational tendencies of amino acids. Proteins. 2005;60(4):679–689. doi:10.1002/prot.20530
- Tian W, Chen C, Lei X, Zhao J, Liang J. CASTp 3.0: computed atlas of surface topography of proteins. Nucleic Acids Res. 2018;46(W1):W363–W367. doi:10.1093/nar/gky473
- Morris GM, Huey R, Lindstrom W, et al. AutoDock4 and AutoDockTools4: automated docking with selective receptor flexibility. Comp J Chem. 2009;30(16):2785–2791. doi:10.1002/jcc.21256
- Janson G, Zhang C, Prado MG, Paiardini A. PyMod 2.0: improvements in protein sequence-structure analysis and homology modeling within PyMOL. Bioinformatics. 2017;33(3):444–446. doi:10.1093/bioinformatics/btw638
- Laskowski RA, Swindells MB. LigPlot+: multiple ligand-protein interaction diagrams for drug discovery. J Chem Inf Model. 2011;51(10):2778–2786. doi:10.1021/ci200227u
- Pronk S, Páll S, Schulz R, et al. GROMACS 4.5: a high-throughput and highly parallel open source molecular simulation toolkit. Bioinformatics. 2013;29(7):845–854. doi:10.1093/bioinformatics/btt055
- Schüttelkopf AW, Van Aalten DM. PRODRG: a tool for high-throughput crystallography of protein–ligand complexes. Acta Crystallogr D Biol Crystallogr. 2004;60(8):1355–1363. doi:10.1107/S0907444904011679
- Bandyopadhyay D, Singh G, Mukherjee M, Akhter Y. Computational approach towards the design of novel inhibitor against universal stress protein A to combat multidrug resistant uropathogenic Escherichia coli. J Mol Struct. 2021;1238:130379–130389. doi:10.1016/j.molstruc.2021.130379
- Namgyal D, Ali S, Hussain MD, Kazi M, Ahmad A, Sarwat M. Curcumin ameliorates the Cd-induced anxiety-like behavior in mice by regulating oxidative stress and neuro-inflammatory proteins in the prefrontal cortex region of the brain. Antioxidants. 2021;10(11):1710–1725. doi:10.3390/antiox10111710
- Gupta M, Nimesh H, Bilgrami AL, Sarwat M. A saffron based polyherbal formulation duk prevents hepatocellular carcinoma in male Wistar rats. Curr Cancer Drug Targets. 2023. doi:10.2174/1568009623666230818115905
- Liu P, Gao YT, Yu JJ, et al. DPPH radical scavenging activity of kaempferol. Adv Mater Res. 2013;781:1294–1297. doi:10.4028/www.scientific.net/AMR.781-784.1294
- Csepregi K, Neugart S, Schreiner M, Hideg É. Comparative evaluation of total antioxidant capacities of plant polyphenols. Molecules. 2016;21(2):208–225. doi:10.3390/molecules21020208
- Ghasemi M, Turnbull T, Sebastian S, Kempson I. The MTT assay: utility, limitations, pitfalls, and interpretation in bulk and single-cell analysis. Int J Mol Sci. 2021;22(23):12827–12857. doi:10.3390/ijms222312827
- Huang WW, Chiu YJ, Fan MJ, et al. Kaempferol induced apoptosis via endoplasmic reticulum stress and mitochondria‐dependent pathway in human osteosarcoma U‐2 OS cells. Mol Nutr Food Res. 2010;54(11):1585–1595. doi:10.1002/mnfr.201000005
- Qin Y, Cui W, Yang X, Tong B. Kaempferol inhibits the growth and metastasis of cholangiocarcinoma in vitro and in vivo. Acta Biochim Biophys Sin. 2016;48(3):238–245. doi:10.1093/abbs/gmv133
- Yang S, Si L, Jia Y, et al. Kaempferol exerts anti-proliferative effects on human ovarian cancer cells by inducing apoptosis, G0/G1 cell cycle arrest and modulation of MEK/ERK and STAT3 pathways. JBUON. 2019;24(3):975–981.
- Mohammad RM, Muqbil I, Lowe L, et al. Broad targeting of resistance to apoptosis in cancer. In: Seminars in Cancer Biology. Academic Press; 2015.
- Peña‐Blanco A, García‐Sáez AJ. Bax, Bak and beyond—mitochondrial performance in apoptosis. FEBS J. 2018;285(3):416–431. doi:10.1111/febs.14186
- Hussar P. Apoptosis regulators bcl-2 and caspase-3. Encyclopedia. 2022;2(4):1624–1636. doi:10.3390/encyclopedia2040111
- Subramani R, Gonzalez E, Arumugam A, et al. Nimbolide inhibits pancreatic cancer growth and metastasis through ROS-mediated apoptosis and inhibition of epithelial-to-mesenchymal transition. Sci Rep. 2016;6:19819–198131. doi:10.1038/srep19819
- Yun CW, Lee SH. The roles of autophagy in cancer. Int J Mol Sci. 2018;19(11):3466–3484. doi:10.3390/ijms19113466
- Lim SM, Mohamad Hanif EA, Chin SF. Is targeting autophagy mechanism in cancer a good approach? The possible double-edge sword effect. Cell Biosci. 2021;11(1):56–69. doi:10.1186/s13578-021-00570-z
- Liu M, Zhao G, Zhang D, et al. Active fraction of clove induces apoptosis via PI3K/Akt/mTOR-mediated autophagy in human colorectal cancer HCT-116 cells. Int J Oncol. 2018;53(3):1363–1373. doi:10.3892/ijo.2018.4465
- Chen X, Yuan LQ, Li LJ, Lv Y, Chen PF, Pan L. Suppression of gastric cancer by extract from the tuber of Amorphophallus konjac via induction of apoptosis and autophagy. Oncol Rep. 2017;38(2):1051–1058. doi:10.3892/or.2017.5747
- Madden E, Logue SE, Healy SJ, Manie S, Samali A. The role of the unfolded protein response in cancer progression: from oncogenesis to chemoresistance. Biol Cell. 2019;111(1):1–17. doi:10.1111/boc.201800050
- Torres PHM, Sodero ACR, Jofily P, Silva-Jr FP. Key topics in molecular docking for drug design. Int J Mol Sci. 2019;20(18):4574–4603. doi:10.3390/ijms20184574
- Guo H, Lin W, Zhang X, et al. Kaempferol induces hepatocellular carcinoma cell death via endoplasmic reticulum stress-CHOP-autophagy signaling pathway. Oncotarget. 2017;8(47):82207–82216. doi:10.18632/oncotarget.19200
- Kim TW, Lee SY, Kim M, Cheon C, Ko SG. Kaempferol induces autophagic cell death via IRE1-JNK-CHOP pathway and inhibition of G9a in gastric cancer cells. Cell Death Dis. 2018;9(9):875–889. doi:10.1038/s41419-018-0930-1
- Guo H, Ren F, Zhang LI, et al. Kaempferol induces apoptosis in HepG2 cells via activation of the endoplasmic reticulum stress pathway. Mol Med Rep. 2016;13(3):2791–2800. doi:10.3892/mmr.2016.4845