
Abstract
The AKT/mammalian target of rapamycin (mTOR) pathway is considered as one of the commonly activated and deregulated signaling pathways in human cancer. mTOR is associated with other proteins in two molecular complexes: mTOR complex 1/Raptor and the mTOR complex 2/Rictor. Using the crystal structure of the related lipid kinase PI3Kγ, we built a model of the catalytic region of mTOR. The modeling of the three-dimensional (3D) structure of the mTOR was performed by homology modeling program SWISS-MODEL. The quality and validation of the obtained model were performed using PROCHECK and PROVE softwares. The overall stereochemical property of the protein was assessed by the Ramachandran plot. The model validation was also done by docking of known inhibitors. In this paper, we describe and validate a 3D model for the mTOR catalytic site.
Introduction
The mammalian target of rapamycin (mTOR) is a large 289 kDa (2,549 amino acids) protein expressed ubiquitously in most cells and tissues.Citation1,Citation2 mTOR is a serine-threonine kinase belonging to the PI3K/Akt/mTOR signaling pathway which is involved in several cell functions, including growth, proliferation, apoptosis, and autophagy.Citation3 Referred to as FKBP-rapamycin-associated protein, mTOR was identified in the mid-1990s as the target of the FKBP12–rapamycin complex.Citation4 As a crucial protein in PI3K and Akt pathways, mTOR plays a key role in cell growth and proliferation by controlling the rate of protein synthesis. Cofactors of mTOR include Raptor, which binds to mTOR’s N-terminus, and GβL, which interacts with mTOR’s kinase domain in the C-terminus. While Raptor functions in mediating interactions between mTOR and its substrates, GβL is believed to have relevance in general kinase activity.Citation5
mTOR is the key component of two distinct signaling complexes in cells; these complexes are the mTOR complex 1/Raptor (mTORC1) and the mTOR complex 2/Rictor (mTORC2). Given the importance of these complexes in cellular growth, survival, motility, proliferation, protein synthesis, and transcription, it is not surprising that they are impacted in multiple types of cancer.Citation6
Growth factors, nutrients, ATP energy levels, and stress regulate mTOR signaling through their activation of upstream kinases PDK1 and Akt.Citation7 Activated PDK1 and Akt phosphorylate mTOR, triggering the phosphorylation of mTOR’s endogenous substrates p70/S6 kinase and eIF4E-binding protein.Citation7,Citation8 The downstream processes affected by this signaling cascade are mRNA translation, ribosomal biosynthesis, amino acid import, macroautophagy, transcription, actin organization, metabolism, cell cycle progression, starvation responses, stress response, and longevity.Citation7,Citation8 Therefore, mTOR has clinical implications in several diseases including cancer, hamartoma syndromes, and allograft rejection, as well as autoimmune, cardiovascular, and metabolic disorders.Citation7
In response to changes in the levels of insulin, nutrients, and energy supply, signaling through these complexes affects a variety of processes, including protein translation and cell proliferation. The efficacy of derivatives of the natural product rapamycin (sirolimus), which functions as an allosteric inhibitor of mTORC1, has validated mTOR inhibition as anticancer treatment. More recently, extensive efforts have been focused on the discovery of ATP-competitive inhibitors of mTOR that would inhibit both mTORC1 and mTORC2 and may provide additional clinical benefits.Citation6,Citation9 These studies have suggested that these inhibitors have a therapeutic superiority to rapalogs (rapamycin analogs) in a number of cancers.Citation6,Citation9
A strong interest now exists for ATP-competitive inhibitors as anticancer agents. The rationale for using ATP-competitive mTOR and mTOR/PI3K dual inhibitors is mainly 1) aberrantly hyperactive signaling by PI3K/AKT/mTOR is a prominent feature of a broad spectrum of human cancers; 2) rapalogs cause activation of AKT through a negative feedback loop; and 3) mTORC2 is also involved in cancer cell growth and survival. Not surprisingly, inhibition of mTORC2 and/or PI3K simultaneously with mTORC1 appears to inhibit more robustly the signaling cascades and negating activation of this feedback loop. Several small-molecule ATP-competitive mTOR kinase inhibitors have been identified and developed as targeted anticancer agents. Because mTOR and PI3K kinase domains are closely related to each other, some of the compounds, it transpires, also potently inhibit the catalytic activity of PI3K, and are thus called mTOR/PI3K dual inhibitors. The first set of ATP-competitive mTOR kinase inhibitors has already entered early clinical trials.Citation10–Citation12
Since no crystallized structure exists for mTOR, we constructed a kinase-domain model to facilitate the rational design of clinically significant inhibitors against this biologically relevant kinase. Using homology modeling, we describe a construction and validation of a three-dimensional (3D) model of the kinase domain of mTOR. We propose a hypothetical binding model deduced from docking studies and available co-crystal structures.
Materials and methods
Sequence analysis and template selection
Sequences of mTOR (IDP42345) and PI3K (IDP48736) were obtained from UniProt (www.uniprot.org). mTOR catalytic domain is localized between amino acids 2,181 and 2,516 and the PI3K (Protein Data Bank [PDB] ID: 3L13) was chosen as a template.
To check the % identity and homology, sequences of mTOR kinase domain were compared to PI3K (kinase domain 282 1037 region) by BLAST using Basic Local Alignment Search Tool (http://blast.ncbi.nlm.nih.gov/Blast.cgi) and ClustalW (https://www.ebi.ac.uk/Tools/msa/clustalw2/).
Ligands selection
A group of ligands known as PI3K and mTOR inhibitors are selected and extracted from the PDB. These ligands were used as an assessment tool of the 3D model of mTOR by docking. summarizes these ligands.
Table 1 Ligands used as tool to assess 3D model of mTOR (protein name phosphatidylinositol 4,5-bisphosphate 3-kinase catalytic subunit gamma isoform)
Homology modeling
Manual alignments of human TOR to template were exported in FASTA format to the Swiss-Model Server.Citation13–Citation15 To generate the 3D model of mTOR catalytic domain (http://swissmodel.expasy.org/), we used a DS Viewer Pro 5.0, PyMol (DeLano Scientific, Palo Alto, CA, USA) (www.pymol.org/funding.html), and the MGL Tools 1.5.6 package of programs from Scripps Research Institute.Citation16,Citation17 PyMOL was used for the production of most figures and for preset analyses of ligand sites.Citation18
Model validation and assessment
The predicted model of mTOR was further assessed by Structural Analysis and Verification Server (version3) (http://nihserver.mbi.ucla.edu/SAVES/). This meta server runs six programs for checking and validating protein structures during and after model refinement.
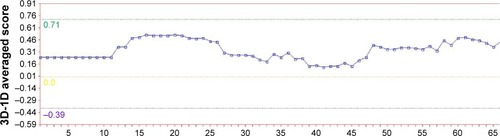
After the first evaluation with Swiss-Model Server, the model was assessed by VERIFY-3D.Citation19 Verify3D analyzes the compatibility of an atomic model (3D) with its own amino acid sequence (1D). Each residue is assigned a structural class based on its location and environment (alpha, beta, loop, polar, nonpolar, etc). A collection of good structures is used as a reference to obtain a score for each of the 20 amino acids in this structural class. The scores (from −1 to +1) were added and plotted for individual residues. The residues falling in the area where the orange line crosses 0.0 have low prediction accuracy and less stable conformationCitation20,Citation21 as shown in .
Figure 1 VERIFY-3D plot analysis of computed mTOR 3D model.
Structural validation of the protein model was done by PROCHECK,Citation22 which determines stereochemical aspects along with main chain and side chain parameters with comprehensive analysis. The model was validated using the Ramachandran plot.Citation23
PROVE was also used to calculate the volumes of atoms in macromolecules using an algorithm that treats the atoms like hard spheres and calculates a statistical Z-score deviation for the model from highly resolved (2.0 Å or better) and refined (R-factor of 0.2 or better) PDB-deposited structures.
Docking methodology and docking analyses
MGL tools 1.5.6 with AutoGrid4 and AutoDock vina (Scripps) were used for docking studies.Citation24 PyMol and DS ViewerPro 5.0 were used to visualize the results.
The docking strategy involved two steps: 1) The first is the preparation of elements for docking. The docking by Autodock vina requires inputs into “.pdbqt” format. The Mgltools is used to transform the ligands in.Mol2 format and receptor in.pdb format on.pdbqt format. The same tool (MglTools) was also used to determine the docking box on the receptor. 2) The second step is docking itself followed by visualization by PyMol.
Results
Choice of the template
Many of the monomer crystals with different resolutions were used as templates () and the obtained results were comparable (data not shown). We deliberately choose the 3L13 template to present the data.
Sequence analysis
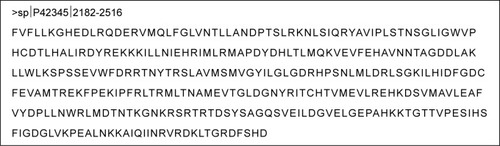
The amino acid sequence of catalytic domain of mTOR protein was retrieved from the Uniprot database. The selected sequence for physiochemical analysis and 3D modeling is given in . Sequence alignment by ClustalW and BLAST showed, respectively, a 16.6% identity and 32% identity between a sequence of the mTOR catalytic domain and the template.
Figure 2 Amino acid sequence of mTOR catalytic domain.
3D structure prediction and model validation
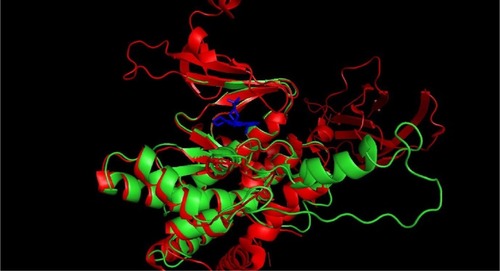
The 3D structure prediction () was carried out by alignment of target sequences with template structures (retrieved from PDB database 3L13), using a Swiss Model Server.Citation13 shows the constructed model and the superposed model with template.
Figure 3 Constructed 3D model of mTOR catalytic domain.
Abbreviations: mTOR, mammalian target of rapamycin; 3D, three-dimensional.
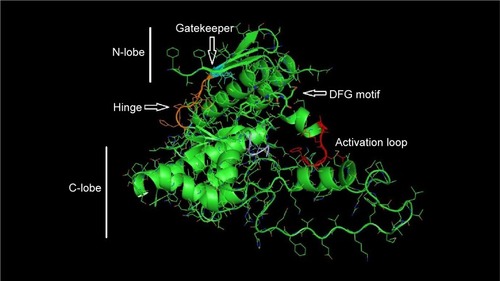
Figure 4 Predictive model aligned to the template (red: template; green: model; blue: ligand).
The quality of the predicted structure of mTOR was further assessed and confirmed by different tools.
Using the VERIFY-3D analysis, shows that most of the residues fall above 0.15–0.4 demonstrating that the model is of good quality.
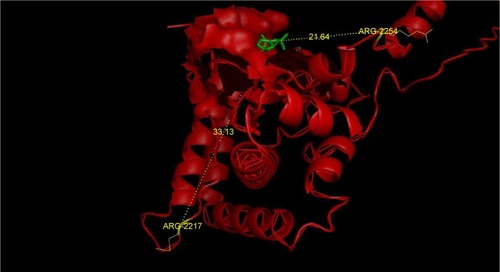
The stereochemical quality and accuracy of the predicted model was evaluated after the refinement process using the Ramachandran Map calculation with the PROCHECK program.Citation22 The structure of catalytic domain of mTOR revealed many segment of helices and the Ramachandran plot showed a tight grouping or clustering of ph~ −50 and ps~ −50. Indeed, in the Ramachandran plot, the residues were classified according to its regions in the quadrangle. The red regions in the graph indicate the most allowed regions, whereas the yellow regions represent allowed regions. Glycine is represented by triangles and other residues are represented by squares in . In our case, PROCHECK analysis reveals in the Ramachandran plot () concluding phi and psi angles to contribute in conformation of amino acids excluding glycine and proline with 81.2% (182 amino acids) residue in the most favored region, 14.3% (32 amino acids) in additional allowed region, 3.6% (8 amino acids) in the generously allowed region and 0.9% (2 amino acids) residue in the disallowed region. The two argi-nine residues (Arg2217 and Arg2254) found in the disallowed region are at very long distances from the pocket as shown in suggesting that those amino acids are structurally and functionally irrelevant to the ligand-binding site.
Figure 5 Ramachandran plot of structural model of mTOR 3D.
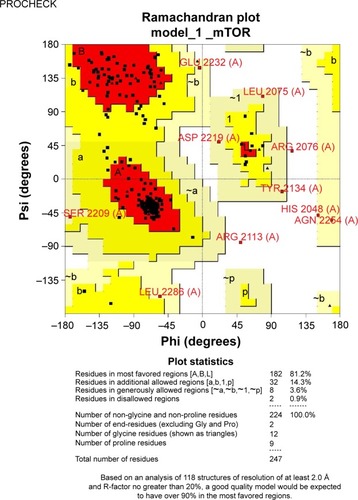
Figure 6 Position of the Arg2217 and Arg2254 found in the disallowed region in Ramachandran plot.
Abbreviation: mTOR, mammalian target of rapamycin.
Docking analysis
Following the construction and validation of our mTOR kinase-domain model, we employed pharmaceutical drug design approaches to virtually “dock” known mTOR kinase inhibitors into the putative ligand-binding pocket of the kinase domain. shows that the model with docked ligand (WYE) is perfectly superimposed on the template 3L13 with its ligand extracted from PDB.
Figure 7 Docking of known inhibitors into 3D model construction.
Abbreviations: PDB, Protein Data Bank; ATP, adenosine triphosphate.
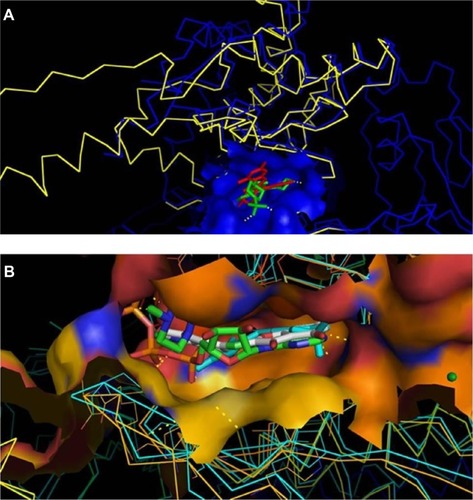
In , we present the docked ligand superposed at ATP into the catalytic site for two crystal structures of PI3K (1E8X and 2A4Z). Data not shown for docking other ligands show similar results.
Discussion
In this paper, we have chosen the approach of homology modeling to determine the catalytic site of the kinase mTOR. Based on ClustalW alignment of the mTOR kinase domain, PI3K has been selected as a template. Homology modeling was performed using the crystallographic structure of PI3Kγ (PDB ID: 3L13) which is closely related to a dual ATP-competitive PI3K/mTOR inhibitor and has a good crystallographic resolution (3.0 Å). Blast results revealed 32% identity between the two aligned kinases domain sequences. Tools used to assess the generated model show good scores. Indeed, compared to similar works,Citation25–Citation27 our PROCHECK results indicated acceptable quality of the structural model with 99.1% of the model’s torsion angles in favorable positions. Earlier studies using PI3Kγ (PDB ID: 1E7U) as a templateCitation25–Citation27 showed 74% (133 amino acids) residues in the most favored regions and 3.4% (9 amino acids) residues in disallowed regions for 179 residues.
Model evaluation by docking gave a good score with ligands that are specific mTOR and dual mTOR/PI3K inhibitors and ATP. Docking analysis showed that the backbone structures of human TOR and PI3KC are comparable.
We are in the process of analyzing all available databases for inhibitors. The validated model will allow us to study different ATP-competitive mTOR inhibitors. These studies will allow us to identify an inhibitor as a drug target.
Acknowledgments
This work was carried out under intramural funding from the University Mohammed the Vth Rabat. We acknowledge support from Volubilis (French-Moroccan Action Intégrée) to AI. This work was also supported by a grant from the NIH for H3Africa BioNet to AI.
Disclosure
The authors report no conflicts of interest in this work.
References
- BrownEJAlbersMWShinTBA mammalian protein targeted by G1-arresting rapamycin–receptor complexNature19943697567588008069
- MurakamiMIchisakaTMaedaMmTOR is essential for growth and proliferation in early mouse embryos and embryonic stem cellsMol Cell Biol200424156710671815254238
- SabatiniDMErdjument-BromageHLuiMTempstPSnyderSHRAFT1: a mammalian protein that binds to FKBP12 in a rapamycin-dependent fashion and is homologous to yeast TORsCell199478135437518356
- KimDHSarbassovDDAliSMGbetaL, a positive regulator of the rapamycin-sensitive pathway required for the nutrient-sensitive interaction between raptor and mTORMol Cell200311489590412718876
- WullschlegerSLoewithRHallMNTOR signaling in growth and metabolismCell2006124347148416469695
- RaughtBGingrasASonenbergNThe target of rapamycin (TOR) proteinsPNAS200198137037704411416184
- McAuliffePFMeric-BernstamFMillsGBGonzalez-AnguloAMDeciphering the role of PI3K/Akt/mTOR pathway in breast cancer biology and pathogenesisClin Breast Cancer2010103S59S6521115423
- RichardDJVerheijenJCZaskARecent advances in the development of selective, ATP-competitive inhibitors of mTORCurr Opin Drug Discov Dev2010134428440
- LvXMaXHuYFurthering the design and the discovery of small molecule ATP-competitive mTOR inhibitors as an effective cancer treatmentExpert Opin Drug Discov201388991101223668243
- ZhangY-JDuanYSteven ZhengXFTargeting the mTOR kinase domain: the second generation of mTOR inhibitorsDrug Discov Today2011167/8326331
- FeldmanMApselBUotilaAActive-site inhibitors of mTOR target rapamycin-resistant outputs of mTORC1 and mTORC2PLoS Biol20097203710383
- ZhouHHuangSCurrent development of the second generation of mTOR inhibitors as anticancer agentsChin J Cancer201231181822059905
- BordoliLKieferFArnoldKBenkertPBatteyJSchwedeTProtein structure homology modeling using SWISSMODEL workspaceNat Protoc2009411319131951
- ArnoldKBordoliLKoppJSchwedeTThe SWISS-MODEL workspace: a web-based environment for protein structure homology modellingBioinformatics20062219520116301204
- KieferFArnoldKKünzliMBordoliLSchwedeTThe SWISS-MODEL repository and associated resourcesNucl Acids Res200937D387D39218931379
- MorrisGMHueyRLindstromWAutoDock4 and AutoDock-Tools4: automated docking with selective receptor flexibilityJ Comput Chem2009302785279119399780
- MorrisGMHueyROlsonAJUsing AutoDock for ligand-receptor dockingCurr Protoc Bioinf2008 Chapter 8:Unit 8.14
- DelanoWThe PyMOL Molecular Graphics System 1.01 Available from: www.pymol.sourceforge.net2009
- EisenbergDLuthyRBowieJUVERIFY3D: assessment of protein models with three dimensional profilesMethods Enzymol19972773964049379925
- BowieJULüthyREisenbergDA method to identify protein sequences that fold into a known three-dimensional structureScience199112253
- LüthyRBowieJUEisenbergDAssessment of protein models with three-dimensional profilesNature19925356
- LaskowskiRAMacArthurMWMossDSThorntonJMPROCHECK – a program to check the stereochemical quality of protein structuresJ Appl Crystallogr199326283291
- RamachandranGNSasisekharanVConformation of polypeptides and proteinsAdv Protein Chem1968232834374882249
- TrottOOlsonAJAutoDock Vina: improving the speed and accuracy of docking with a new scoring function, efficient optimization and multithreadingJ Comput Chem20103145546119499576
- TobakAConstruction of the 3D Structure of the mTOR Kinase-Domain and Discovery of Novel mTOR InhibitorsPhD thesisNewark, NJRutgers University2007
- MohammadAKMajedMASajaAMutasemOTPharmacophore modeling, homology modeling, and in silico screening reveal mammalian target of rapamycin inhibitory activities for sotalol, glyburide, metipranolol, sulfamethizole, glipizide, and pioglitazoneJ Mol Graphics Model2013423949
- TingRTaoLHaoliangYA selectivity study on mTOR/PI3Kα inhibitors by homology modeling and 3D-QSARJ Mol Model201218117118621523553
- ColovosCYeatesTOVerification of protein structures: patterns of nonbonded atomic interactionsProtein Sci19932151115198401235
- JacintoEHallMNTor signaling in bugs, brain and brawnNat Rev Mol Cell Biol2003411712612563289