
Abstract
It has been previously reported that the deregulation of microRNAs in gastric cancer (GC) was correlated with the progression and prognosis. miR-429, a member of the miR-200 family, was previously shown to play an important role in human carcinomas. Our study shows that miR-429 is significantly downregulated in GC tissues compared with matched nontumor tissues. Overexpression of miR-429 in GC cells suppressed cell proliferation. Fascin-1 (FSCN1) was identified as one of the targets of miR-429 and knockdown of FSCN1 mimics the function of miR-429 overexpression. In conclusion, miR-429 acts as a tumor suppressor by targeting FSCN1, suggesting that miR-429 and FSCN1 can both be potential therapeutic targets of GC.
Keywords:
Introduction
Gastric cancer (GC) is the fourth most common type of cancer causing ~800,000 mortalities worldwide each year.Citation1 In general, patients with GC have a 5-year survival rate of about 15% and the median overall survival is <1 year for the ones with advanced GC.Citation2,Citation3 Currently, molecular profiling of GC has suggested that genetic alterations, chromosomal instability, and Helicobacter pylori infections are correlated with GC development and progression.Citation2,Citation4 However, the complex molecular mechanisms still need to be fully elucidated. Therefore, it is essential to identify the deregulated genes in GC and elucidate their roles in GC carcinogenesis and progression.
MicroRNAs (miRNAs) are small noncoding RNA of 19–23 nucleotides that negatively regulate gene expression by partial complementary binding, particularly to 3′ untranslated regions (UTRs) of mRNAs.Citation5 MiRNAs have been implicated in the development of acute myeloid leukemia, breast cancer, non-small-cell lung carcinoma, hepatocellular carcinoma, colon cancer, GC, and other cancers.Citation6–Citation10 In GC, the deregulated miRNAs and their roles in GC development have also attracted much attention, and a set of miRNAs has been implicated in GC carcinogenesis and progression.Citation11–Citation14 Identification of the deregulated miRNAs and their targets may provide promising therapeutic targets for GC treatment.
miR-429, a member of the miR-200 family of miRNAs, was reported able to inhibit invasion in colorectal carcinoma, breast cancer, oral squamous cell carcinoma, and endometrioid adenocarcinoma.Citation15–Citation18 However, its upregulation in patients with serous ovarian carcinoma is correlated with survival.Citation19 Despite the important role of miR-429 in tumor progress, its precise role and the mechanisms involved have not been addressed so far. In the present study, we have explored the role of miR-429 in GC and identified one of the major targets of this miRNA. We found that miR-429 is significantly downregulated in GC tissues as compared with matched nontumor tissues. We also evaluated the biological influence of overexpression of miR-429 in SGC-7901 cells. Furthermore, we identified and validated fascin-1 (FSCN1) as one of the targets of miR-429, which suggests that miR-429 participates in cancer cell biology by regulating FSCN1 expression.
Methods
Cell lines and patient samples
SGC-7901 (a human gastric carcinoma cell line) was purchased from the Type Culture Collection of the Chinese Academy of Sciences (Shanghai, People’s Republic of China). Cells were maintained in RPMI-1640 medium (Hyclone, Logan, Utah, USA) containing 10% fetal bovine serum and 1% penicillin/streptomycin at 37°C in a 5% CO2 incubator.
Tissue samples and paired adjacent nontumor tissue samples were collected from the surgical specimens of 44 patients with gastric carcinoma from the First Affiliated Hospital of Anhui Medical University. This study was approved by the ethics committee of the First Affiliated Hospital of Anhui Medical University and informed consent was obtained from each patient.
RNA extraction and quantitative real-time PCR
Total RNA was extracted from cultured cells or tissue samples using TRIzol Reagent (Thermo Fisher Scientific, Waltham, MA, USA) as per the manufacturer’s instruction. The miR-429 level was quantified by quantitative reverse transcription-PCR (qRT-PCR) using Taqman assay kit (Thermo Fisher Scientific, 4366596) and Realtime PCR Master Mix (QPK-101, Toyobo, Shanghai, People’s Republic of China), with U6 small nuclear RNA as internal normalized reference. For FSCN1 mRNA quantification, cDNA was synthesized by using ReverTra Ace qPCR RT Master Mix with gDNA Remover (Toyobo, FSQ-301). And it was quantificated by KAPA SYBR FAST Universal qPCR kit (Kapa Biosystems, KK4601, Wilmington, Massachusetts, USA) using 18 s as internal reference. The data were measured using an ABI 7900 HT PCR sequencer (Applied Biosystems), and gene expression was calculated using the ∆∆Ct method. All reactions were performed in triplicate.
Plasmid construction
For the luciferase reporter assay, a wild-type 3′UTR of FSCN1 mRNA (Genbank accession no NM_003088.3) was amplified and cloned into the XhoI/NotI site just after the Renilla luciferase reporter gene of the luciferase reporter vector psiCHECK-2, which was named FSCN1-3′UTR-psiCHECK2-WT. FSCN1-3′UTR-psiCHECK2-MUT carried the mutated sequence in the complementary site for the seed region of miR-429 and was generated based on FSCN1-3′UTR-psiCHECK 2-WT by site-specific mutagenesis (Transgene, Beijing, People’s Republic of China), which mutated CAGTATT to AGTGCGA.
For FSCN1-overexpressing plasmid, the human FSCN1-CDS was amplified using the primers as follows: 5′-TAAGAATTCCGCGCAGCGGCCTCTCGTCTAC-3′ (forward) and 5′-TAAGGATCCGTTAGCAGGGAGGGTTGGCAG GAGC-3′ (reverse) and cloned into EcoRI/BamHI site of pcDNA3.1-vector.
Transient transfection with miRNA/siRNA/plasmid
miR-429 mimics was purchased from Shanghai GenePharma Co., Ltd. (Shanghai, People’s Republic of China), and siRNA targeting FSCN1 mRNA (NM_003088.3) was purchased from Sigma-Aldrich Co. (St Louis, MO, USA). Transfection of miRNA mimics or plasmid was conducted using 3 µL Lipofectamine 2000 (Thermo Fisher Scientific). Transfection of siRNA was performed using 3 µL SuperFectin II DNA Transfection Reagent (Pufei, Shanghai, People’s Republic of China). In the rescue experiment, cells were cotransfected with 50 nM miRNA mimics and 2 µg overexpression plasmid using 4 µL Lipofectamine 2000.
EdU assay
A total of 1.2×10⁵ transfected cells were plated into 6-well plates, and DNA synthesis was assessed with a Cell-Light™ EdU Apollo®488 In Vitro Imaging Kit (C10310-3, RiboBio, Guangzhou, People’s Republic of China). Then, nuclei were stained with DAPI (Thermo Fisher Scientific). Finally, cells were visualized and counted with a fluorescent microscope (Leica Microsystems, Wetzlar, Germany). The EdU labeling index was calculated as EdU-positive cells/total DAPI-positive cells.
Dual luciferase reporter assay
For luciferase reporter assay, SGC-7901 cells were cotransfected with miR-429 mimics and plasmid. The luciferase activity was measured using the Dual Luciferase Reporter Assay System (Promega Corporation, Fitchburg, WI, USA). The relative LUC means the ratio of Fluc(the value of firefly fluorescence) and Rluc(the value of renilla fluorescence). Transfections were done in duplicate and repeated at least thrice in independent experiments.
Western blot analysis
Cells were harvested 48 hours post-transfection and lysed in RIPA buffer (Beyotime, Shanghai, People’s Republic of China). Total proteins from tissue samples were extracted by grinding with liquid nitrogen. Proteins were separated by a 10% polyacrylamide gel and transferred to a PVDF membrane, then detected with anti-Fascin antibody (EMD Millipore, Billerica, MA, USA, MAB3582). β-Actin was used as the control. The goat antimouse immunoglobulin G (Licor Co., Lincoln, NE, USA) was used as the secondary antibody. The membranes were scanned with an Odyssey LI-CDR scanner (BD Biosciences, San Jose, CA, USA).
Immunohistochemistry
Sections were dewaxed in xylene, rehydrated in alcohol, and immersed in 3% hydrogen peroxide for 5 minutes to suppress endogenous peroxidase activity. Antigen retrieval was performed by heating at 100°C for 30 minutes in 0.01 mol/L sodium citrate buffer (pH 6.0). After three rinses, sections were incubated for 1 hour in room temperature with anti-Fascin antibody (Millipore). Then sections were incubated with biotin-labeled secondary antibody. After three additional washes, slides were visualized with Horseradish Peroxidase Color Development Kit (DAB) and counterstained with hematoxylin, then observed under the microscope.
MTT assay
SGC-7901 cells were seeded in 96-well plates (1,000 cells/100 µL medium/well) after transfection. Cells were incubated for 1, 2, 3, 4, and 5 days and then incubated for 4 hours in the presence of 20 µL MTT solution (5 g/L, Sigma-Aldrich Co.). An amount of 150 µL/well DMSO was added and OD values at 490 nm were recorded. The assay was performed three times.
Colony formation assay
SGC-7901 cells were treated with oligo RNA and the cells were harvested after 24 hours. The cells were suspended and plated in 6-well plates (800 cells/2 mL medium/well). After being cultured for 7 days, colonies were stained with 0.1% crystal violet and pictured.
Xenograft tumor model
Approximately 106 SGC-7901 cells infected with miR-429-LV were subcutaneously injected into left flanks of nude mice, whereas the SGC-7901/NC-LV cells were inoculated into the right side. Five mice were included in each group. The volume of the implanted tumor was measured every 4 days, using the formula: volume (mm3) =0.5× length × widthCitation2. The mice were killed and the tumors were weighed 25 days after injection.
The 4–5-week-old mice were purchased from Shanghai Super-B&K Laboratory Animal Corp. Ltd. (Shanghai, People’s Republic of China). The animal study was carried out in strict accordance with the recommendations in the guidelines for the Animal Care and Use Committee of the First Affiliated Hospital of Anhui Medical University.
TCGA dataming
The public TCGA (http://cancergenome.nih.gov/) data were used as our primary source of samples. Gene-level summarized (level 3, RPKM and read count) RNA-seq data sets were used. In total, 249 tumors and 33 normal tissues having expression data (date of download: November 2014) were profiled for different expression analysis. DESeq, an R Bioconductor package, was used to test for differentially expressed genes from patient data. TargetScan version 6.2 human miRNA target predictions were obtained online (http://targetscan.org).
Statistical analysis
All statistical analyses were performed by using the SPSS 18.0 version (SPSS Inc., Chicago, IL, USA). Data were tested using two-tailed Student’s t-test and one-way ANOVA. P<0.05 was considered to be statistically significant.
Results
miR-429 is downregulated in GC tissues
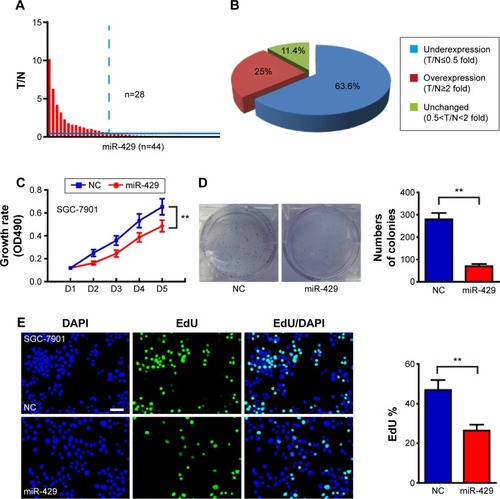
To explore the expression of miR-429 in GC, we analyzed 44 paired GC tumors and non-neoplastic tissues from GC patients (the features of patients are shown in ) by performing quantitative real-time RT-PCR (qRT-PCR). As shown in , the expression of miR-429 was downregulated in 63.6% (28 of 44) of GC tissues as compared with that in their matched controls.
Figure 1 miR-429 is downregulated in GC and reduces GC cancer cell growth rate in vitro.
Overexpression of miR-429 reduces GC growth both in vitro and in vivo
Given that the expression of miR-429 is downregulated in GC, we then determined whether miR-429 functions as a tumor suppressor. The cell proliferation was examined by MTT and colony formation assays. We found that the proliferation of cells expressing miR-429 mimics was significantly decreased as compared with that of negative control (NC) miRNA (). The capacity of colony formation was also evaluated on SGC-7901 cells expressing miR-429 mimics, and the results showed that miR-429 significantly reduced the cells’ proliferation (). EdU staining results also showed that the proportion of cells at S and G2 phase is less in the cells expressing miR-429 than in those with NC, which indicates that miR-429 reduces cell dividing (). To further confirm the biological function of miR-429, an in vivo model was used. Nude mice injected with SGC-7901/miR-429-LV cells showed a significant reduction in tumor size and weight as compared with those of NC (P<0.01) ().
Figure 2 miR-429 reduces gastric cancer (GC) cell growth rate in vivo.
Notes: (A) Stable SGC-7901/NC-LV (negative control [NC]) and SGC-7901/miR-429-LV (miR-429) cells were inoculated into left and right flanks of each nude mouse (upper). The mice were euthanized and the tumors were excised (bottom). (B and C) The volume (mm3) and weight (mg) of each group were measured. The average tumor volume and weight were indicated as mean ± standard error. Results are representative of three independent experiments.
![Figure 2 miR-429 reduces gastric cancer (GC) cell growth rate in vivo.Notes: (A) Stable SGC-7901/NC-LV (negative control [NC]) and SGC-7901/miR-429-LV (miR-429) cells were inoculated into left and right flanks of each nude mouse (upper). The mice were euthanized and the tumors were excised (bottom). (B and C) The volume (mm3) and weight (mg) of each group were measured. The average tumor volume and weight were indicated as mean ± standard error. Results are representative of three independent experiments.](/cms/asset/20074a9c-9ffc-4bd6-97d1-8a999c0e24b1/dott_a_91879_f0002_c.jpg)
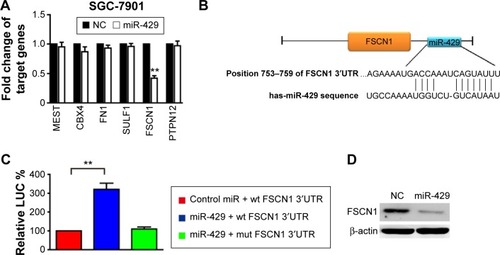
miR-429 directly targets FSCN1 expression
A high-confidence list of 656 candidate miR-429 targets was obtained by choosing evolutionary conservation (TargetScan probability of conserved targeting >0.5). It is recognized that target prediction tools quite often yield many false positive targets. Therefore, predicted targets associated with tumor progression were analyzed () and further validated by examining their expression at the mRNA level upon the transfection of miR-429 in SGC7901 cells. Among these six candidates, the level of FSCN1 was suppressed by miR-429 () and the potential 3′UTR binding site of FSCN1 of miR-429 is shown in . To further verify whether miR-429 targets FSCN1 directly, the WT 3′UTR or the MUT 3′UTR (the putative miR-429 binding site was mutated) of FSCN1 was cloned into the reporter vector and the dual luciferase reporter assay was performed. As shown in , the miR-429 mimics the reduced renilla luciferase activity of the wild-type plasmid (wt FSCN1 3′UTR) which resulted in the increase of relative LUC (Fluc/Rluc)% (P<0.05) but not the mutant plasmid (mut FSCN1 3′UTR). Moreover, the expression level of FSCN1 protein in the cells overexpressing miR-429 mimics was dramatically lower than that of NC miRNA (). These findings suggest that miR-429 directly targets FSCN1 expression by binding to the 3′UTR region of FSCN1.
Figure 3 miR-429 directly targets fascin-1 (FSCN1).
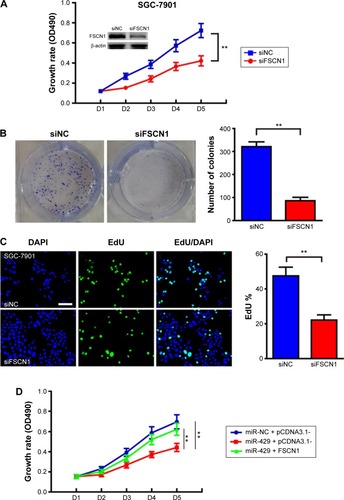
Knockdown of FSCN1 mimics the effects of miR-429 overexpression
To further study the role of FSCN1 in GC development, we investigated whether RNA interference knockdown of FSCN1 could recapitulate the oncogenic effects of miR-429 in SGC-7901 cells. As shown in , FSCN1 knockdown, similar to the transfection of miR-429, significantly reduced cell proliferation and slowed cell cycle progression in SGC-7901 cells. We then performed rescue experiments to further validate that FSCN1 targeting is involved in miR-429-mediated tumor suppression in GC. FSCN1 overexpression vector was used in the experiments. As shown in , overexpression of FSCN1 protein significantly restores the growth defect in SGC-7901 cells transfected with miR-429.
Figure 4 Fascin-1 (FSCN1) depletion mimics the effect of miR-429 and its overexpression rescues the growth defect of miR-429.
To confirm the clinic relevance of our in vitro findings, we also used immunohistochemical analysis to evaluate the FSCN1 level in GC and an increased expression of FSCN1 in GC was observed (). Besides, FSCN1 mRNA expression was also evaluated in GC samples. As shown in , FSCN1 mRNA expression was upregulated in 68.06% (28 of 44) of GC samples, and an inverse correlation with miR-429 expression in GC samples was noticed (, r=−0.83; P<0.01). These findings further suggest that decreased expression of miR-429 leads to the upregulation of FSCN1 in GC and indicate that a reduction of FSCN1 expression can mimic miR-429 in promoting SGC-7901 cells to proliferate.
Figure 5 The correlation between fascin-1 (FSCN1) and miR-429 in clinical specimens.
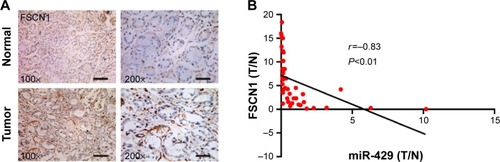
Table 1 The relative expression of miR-429 was quantified using qRT-PCR and normalized by U6 and fascin-1 (FSCN1) was evaluated by immunohistochemical (IHC) staining. IHC scores of FSCN1 in miR-429 low or miR-429 high group
Discussion
The role of miRNA in tumorigenesis has been extensively studied in recent years.Citation7,Citation14 miR-429, a member of the miR-200 family of miRNAs, was downregulated in various types of cancer, including oral squamous cell carcinoma,Citation17 esophageal carcinomas,Citation18 hepatitis B virus-related hepatocellular carcinoma,Citation20 breast cancer,Citation16 colorectal cancer,Citation21 and GC.Citation22 A dynamic negative correlation between miR-429 expression and the colorectal cancer progression was observed as well.Citation21 However, miR-429 was also reported to be upregulated in human colorectal cancer tissues and the miR-429 overexpression suppressed cell apoptosis in HT-29 cells.Citation23 The downstream targets identified are also complex, which seemed to be tissue-dependent. For example, miR-429 inhibits expression of the transcriptional repressors ZEB1 in breast cancer and oral squamous cell carcinoma.Citation16,Citation17 Downregulation of miR-429 in colorectal carcinoma contributes to carcinogenesis by targeting Onecut2.Citation15 Upregulation of miR-429 inhibits invasion and promotes apoptosis in esophageal carcinoma cells by targeting Bcl-2 and SP1 in esophageal carcinoma.Citation18 miR-429 also modulates the expression of c-myc in human gastric carcinoma cells.Citation22 Therefore, additional downstream targets need to be discerned for a more comprehensive understanding of the role of miR-429 in cancer progression, by which it would guide the design of future personalized medicine for cancer patients.
In this study, we showed that miR-429 was significantly downregulated in GC tumor tissues when compared with adjacent normal tissue, which was consistent with a previous study.Citation22 We further used in vitro proliferation assay and in vivo mice model, by which we confirmed the tumor suppressing role of miR-429 in GC cells. To elucidate the underlying molecular mechanisms of miR-429 in cancer cell proliferation, the public TCGA data, gene-level summarized RNA-seq data sets, DESeq, and TargetScan were used. By R package, a total of 168 genes were selected as the different expression genes between tumor and normal samples, of which 127 were upregulated. As shown in , FSCN1 emerged as one of the most prominent upregulated genes in the TCGA stomach adenocarcinoma dataset by hierarchical clustering analysis. Then we demonstrated that the knockdown of FSCN1 mimics the effects of miR-429 overexpression that leads to the growth defect in GC cells. Furthermore, FSCN1 overexpression reversed the inhibitory effect of miR-429 on GC proliferation. In order to seek the clinical relevance, we also evaluate the expression level of FSCN1 in GC tissues and found that its expression is upregulated in GC and negatively correlated with the level of miR-429.
FSCN1, a 55 kDa actin-binding protein, is an important regulatory element in the maintenance and stability of parallel bundles of filamentous actin and plays a central role in the regulation of cell adhering, migration, and invasion.Citation24,Citation25 The overexpression of FSCN1 was associated with aggressive clinical course, poor prognosis, and shorter survival of various tumors including prostate, breast cancer, gastric, esophageal, and pancreatic cancer,Citation26–Citation31 indicating that FSCN1 may play an important role in tumorigenesis. The tumorigenic function of FSCN1 might be conferred by its invasive properties on cancer cells.Citation32 In particular, the knockdown of FSCN1 expression reduced the proliferation and metastasis of GC cellsCitation33 and the higher expression of FSCN1 is correlated with more advanced cancer stages and inversely with survival rates in gastric adenocarcinomas.Citation34 A previous study identified FSCN1 as a target of miR-133b in GC cells.Citation35 In our study, we indicated that FSCN1 was also a direct target of miR-429 in GC cells and demonstrated the inverse correlation of FSCN1 and miR-429 in vivo. So, we speculate that miR-429 may contribute to the inhibition of GC via directly targeting FSCN1 and that miR-429 may serve as a useful biomarker for earlier diagnosis and prognosis of GC.
Acknowledgments
The study was supported by the Natural Science Foundation of Anhui Province, People’s Republic of China (No 1301043022).
Supplementary materials
Figure S1 Cluster miR-429 targets expression profile between normal tissues and gastric tumors.
Notes: Statistical analysis of the miR-429 targets between 33 normal samples and 249 gastric tumor samples predicts 168 differently expressed genes. The color scale denotes the extent of relative upregulation (red) and downregulation (blue). Green and yellow column-wise color codes for 33 normal and 249 tumor samples, respectively. Y-axis displays the gene symbol and the gene fascin-1 (FSCN1) is marked within the red rectangle.
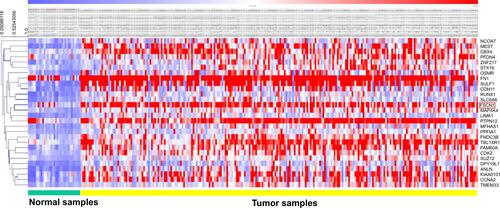
Figure S2 Gene oncology (GO) distributions after microRNA target analysis as grouped by molecular function.
Notes: The BP terms associated with fascin-1 include actin cytoskeleton organization and cell migration. The genes significantly related to our research were marked by red boxes.
Abbreviations: BP, biological process; BMP, bone morphogenetic protein.
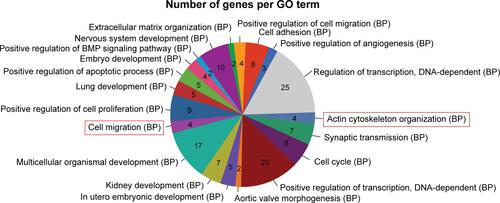
Table S1 The clinicopathologic features of the patients
Disclosure
The authors report no conflicts of interest in this work.
References
- FerroAPeleteiroBMalvezziMWorldwide trends in gastric cancer mortality (1980–2011), with predictions to 2015, and incidence by subtypeEur J Cancer20145071330134424650579
- BangYJAdvances in the management of HER2-positive advanced gastric and gastroesophageal junction cancerJ Clin Gastroenterol201246863764822751336
- DelaunoitTLatest developments and emerging treatment options in the management of stomach cancerCancer Manag Res2011325726621792334
- KimKMKwonMSHongSJGenetic classification of intestinal-type and diffuse-type gastric cancers based on chromosomal loss and microsatellite instabilityVirchows Archiv2003443449150012920592
- FabianMRSonenbergNFilipowiczWRegulation of mRNA translation and stability by microRNAsAnnu Rev Biochem20107935137920533884
- ZhengYSZhangHZhangXJMiR-100 regulates cell differentiation and survival by targeting RBSP3, a phosphatase-like tumor suppressor in acute myeloid leukemiaOncogene2012311809221643017
- NicolosoMSSpizzoRShimizuMRossiSCalinGAMicroRNAs – the micro steering wheel of tumour metastasesNat Rev Cancer20099429330219262572
- MattiskeSSuetaniRJNeilsenPMCallenDFThe oncogenic role of miR-155 in breast cancerCancer Epidemiol Biomarkers Prev20122181236124322736789
- MalleterMJacquotCRousseauBmiRNAs, a potential target in the treatment of non-small-cell lung carcinomasGene2012506235535922732573
- HouYYCaoWWLiLMicroRNA-519d targets MKi67 and suppresses cell growth in the hepatocellular carcinoma cell line QGY-7703Cancer Lett2011307218219021524841
- ChanSHWuCWLiAFChiCWLinWCmiR-21 microRNA expression in human gastric carcinomas and its clinical associationAnticancer Res2008282A90791118507035
- PengWChenZYWangLWangZLiJMicroRNA-199a-3p is downregulated in gastric carcinomas and modulates cell proliferationGenet Mol Res20131233038304724065659
- TsukamotoYNakadaCNoguchiTMicroRNA-375 is down-regulated in gastric carcinomas and regulates cell survival by targeting PDK1 and 14-3-3zetaCancer Res20107062339234920215506
- WuWKLeeCWChoCHMicroRNA dysregulation in gastric cancer: a new player enters the gameOncogene201029435761577120802530
- SunYShenSLiuXMiR-429 inhibits cells growth and invasion and regulates EMT-related marker genes by targeting Onecut2 in colorectal carcinomaMol Cell Biochem20143901–2193024402783
- YeZBMaGZhaoYHmiR-429 inhibits migration and invasion of breast cancer cells in vitroInt J Oncol201546253153825405387
- LeiWLiuYEZhengYQuLMiR-429 inhibits oral squamous cell carcinoma growth by targeting ZEB1Med Sci Monit20152138338925640197
- WangYLiMZangWMiR-429 up-regulation induces apoptosis and suppresses invasion by targeting Bcl-2 and SP-1 in esophageal carcinomaCell Oncol2013365385394
- NamEJYoonHKimSWMicroRNA expression profiles in serous ovarian carcinomaClin Cancer Res20081492690269518451233
- GaoHLiuCmiR-429 represses cell proliferation and induces apoptosis in HBV-related HCCBiomed Pharmacother201468894394925312821
- SunYShenSTangHmiR-429 identified by dynamic transcriptome analysis is a new candidate biomarker for colorectal cancer prognosisOMICS2014181546424237355
- SunTWangCXingJWuDmiR-429 modulates the expression of c-myc in human gastric carcinoma cellsEur J Cancer201147172552255921684154
- LiJDuLYangYMiR-429 is an independent prognostic factor in colorectal cancer and exerts its anti-apoptotic function by targeting SOX2Cancer Lett20133291849023111103
- JayAParsonsMFascin: a key regulator of cytoskeletal dynamicsInt J Cell Biol2010421016141617
- AdamsJCRoles of fascin in cell adhesion and motilityCurr Opin Cell Biol200416559059615363811
- DarnelADBehmoaramEVollmerRTFascin regulates prostate cancer cell invasion and is associated with metastasis and biochemical failure in prostate cancerClin Cancer Res20091541376138319228738
- HashimotoYItoTInoueHPrognostic significance of fascin overexpression in human esophageal squamous cell carcinomaClin Cancer Res20051172597260515814639
- HashimotoYShimadaYKawamuraJYamasakiSImamuraMThe prognostic relevance of fascin expression in human gastric carcinomaOncology2004673–426227015557788
- MaitraAIacobuzio-DonahueCRahmanAImmunohistochemical validation of a novel epithelial and a novel stromal marker of pancreatic ductal adenocarcinoma identified by global expression microarrays: sea urchin fascin homolog and heat shock protein 47Am J Clin Pathol20021181525912109856
- PelosiGPastorinoUPasiniFIndependent prognostic value of fascin immunoreactivity in stage I nonsmall cell lung cancerBr J Cancer200388453754712592367
- Rodriguez-PinillaSMSarrioDHonradoEPrognostic significance of basal-like phenotype and fascin expression in node-negative invasive breast carcinomasClin Cancer Res20061251533153916533778
- MacheskyLMLiAFascin: Invasive filopodia promoting metastasisCommun Integr Biol20103326327020714410
- FuHWenJFHuZLLuoGQRenHZKnockdown of fascin1 expression suppresses the proliferation and metastasis of gastric cancer cellsPathology200941765566020001345
- TsaiWCJinJSChangWKAssociation of cortactin and fascin-1 expression in gastric adenocarcinoma: correlation with clinicopathological parametersJ Histochem Cytochem200755995596217510372
- GuoLBaiHZouDThe role of microRNA-133b and its target gene FSCN1 in gastric cancerJ Exp Clin Cancer Res20143319925433493