
 ?Mathematical formulae have been encoded as MathML and are displayed in this HTML version using MathJax in order to improve their display. Uncheck the box to turn MathJax off. This feature requires Javascript. Click on a formula to zoom.
Abstract
Objective
To investigate the effects of microRNA-122 (miR-122) on proliferation, migration, and invasion in human hepatocellular carcinoma (HCC) cells by activating epithelial–mesenchymal transition (EMT) pathways.
Methods
miR-122 mimics, miR-122 inhibitors, relevant control oligonucleotides, and Wnt1 were transfected into HepG2 and huh7 cell lines which were then divided into six groups: miR-122 group, anti-miR-122 group, miR-negative control (NC) group, anti-miR-NC group, miR-122 + Wnt1 group, and miR-122 + vector group. The miR-122 expressions and mRNA expressions of Wnt1 and EMT-related genes (E-cadherin, vimentin, β-cadherin, and N-cadherin) were quantified by quantitative real-time polymerase chain reaction (qRT-PCR). Protein expression levels of Wnt1, E-cadherin, vimentin, β-cadherin, and N-cadherin were measured by Western blot. Cell proliferation, migration, and invasion were evaluated using 3-(4,5-dimethylthiazol-2-yl)-2,5-diphenyltetrazolium bromide (MTT) assay, wound-healing assay, and Transwell assay, respectively.
Results
Dual luciferase reporter gene results showed that Wnt1 is a direct target gene of miR-122 in both HepG2 and huh7 cell lines. Compared to miR-NC, anti-miR-NC, and miR-122 + Wnt1 groups, miR-122 expression was markedly higher in the miR-122 group and miR-122 + vector group, but was sharply decreased in anti-miR-122 group (both P<0.05), and the mRNA and protein levels of Wnt1, vimentin, β-cadherin, and N-cadherin decreased significantly; also E-cadherin increased, and cell proliferation, migration, and invasion decreased in the miR-122 group and miR-122 + vector group (all P<0.05), but the situation was totally reversed in the anti-miR-122 group (all P<0.05).
Conclusion
Downregulation of miR-122 promoted proliferation, migration, and invasion of human HCC cells by targeting Wnt1 and regulating Wnt/β-catenin pathway which activated the EMT pathways.
Introduction
Hepatocellular carcinoma (HCC) is the third leading cause of cancer-related deaths worldwide, and the mortality rates are mainly related to late diagnosis and high tumor recurrence after surgery.Citation1 The 5-year survival rates vary widely between 27% and 78%, depending on the underlying disease course, and frequent metastasis are observed in clinics. Despite promising therapeutic strategies for HCC, surgical resection or liver transplant remains the best options currently available.Citation2 Several studies explored the underlying mechanisms of HCC progression with a view of understanding key pathways driving HCC and to uncover novel therapeutic targets.Citation2,Citation3 Epithelial–mesenchymal transition (EMT) is a cellular program that enables epithelial cells to lose epithelial properties and acquire mesenchymal phenotype, gaining the ability to invade neighboring tissue or undergo distant metastasis, and the process involves loss of epithelial cell markers (eg, E-cadherin, occludin, and mucin) and the overexpression of mesenchymal markers (eg, N-cadherin, fibronectin, and vimentin).Citation4 EMT is a critical step in HCC metastasis, and is closely related with intrahepatic migration, extensive invasion, and poor survival of HCC patients.Citation5 Alteration in microRNA (miRNA) expression influences tumor growth and metastasis at multiple stages of tumor progression, and deregulated miRNA expression is also found in hepatocarcinogenesis, modulating tumor cell growth, apoptosis, metastasis and invasion, and aggravating HCC.Citation6
miRNAs are 21- to 25-nucleotide-long noncoding RNA molecules that regulate gene expression by binding to complementary sequences in the 3′ untranslated region to promote translational repression or mRNA degradation.Citation7 Up to 30% of genes are regulated by miRNAs in this manner, and important biological pathways, including EMT, are targets of miRNA regulation.Citation8 Some miRNAs function as tumor suppressors by inhibiting EMT, while others serve as oncogenes disrupting the proper assembly of epithelial architecture, leading to tumorigenesis.Citation9 Growing evidence suggests that miRNAs are essential for maintaining the balance between EMT and mesenchymal–epithelial transition (MET) (the reverse process of EMT), and MET can be induced to effectively control tumor growth and progression.Citation10,Citation11 miR-122 is the most abundant miRNA in the liver, accounting for an estimated 70% of the total miRNA population, and the maintenance of liver homeostasis is regulated by miR-122.Citation12 Importantly, miR-122 expression is either undetectable or very low in hepatic carcinoma during hepatic differentiation, intrahepatic metastasis, and invasion.Citation13 It was reported that miR-122 could act as a tumor suppressor by targeting several pathways, including Wnt/β-catenin signaling pathway.Citation14 However, the detailed mechanisms remain unknown. In this study, we examined the associations between miR-122 and human HCC cell proliferation, migration, and invasion, and further studied the role of EMT in human HCC cell migration and invasion.
Materials and methods
Cell collection and culture
Human HCC cell lines HepG2 and huh7 were obtained from the Department of Oncology, The Affiliated Jiangyin Hospital, School of Medicine, Southeast University, Jiangyin, People’s Republic of China. Cell suspension (1 mL) was cultured in Roswell Park Memorial Institute-1640 medium (HyClone, Logan, UT, USA) supplemented with heat-inactivated 10% fetal bovine serum (FBS), 1,000 U/mL penicillin, and 100 mg/mL streptomycin and maintained in a 5% CO2 humidified incubator at 37°C. Cells were digested with pancreatin after they reached 80%–90% confluence and passaged using standard methods.Citation15 All the cell lines were provided from participants in our hospital after they signed the informed consent. The study was approved by the ethics committee of Affiliated Jiangyin Hospital, School of Medicine, Southeast University.
Dual luciferase reporter gene activity analysis
LipofectAMINE 2000 (Invitrogen, Carlsbad, CA, USA) was used to combine luciferase reporter vector pWnt1-Wt and pWnt1-Mut with miR-122 mimics or miR-negative control (NC) respectively, and cotransfection of the combination was conducted in HepG2 and huh7 cells; simultaneously, pRL-TK vector (containing HSV cytosine kinase promoter region, weakly expressing Renilla reniformis luciferase in a variety of cells, and purchased from Cyagen Biosciences Inc., Santa Clara, CA, USA) was cotransfected as a standard internal control. Specific transfection steps followed the LipofectAMINE2000 operating instructions; and the transfected plasmid was 0.8 μg, the miRNA final concentration was 40 μmol/L, and the number of transfected cells was 1×10⁵ (subsequent transfection experiments used the same plasmid mass and cell numbers). After transfection for 36 hours, the cells were harvested and treated according to Promega Dual-Luciferase® Reporter activity assay kit instructions (Fitchburg, WI, USA), and cell luciferase activity was detected by a single photon detector. The relative luciferase activity was calculated as firefly luciferase activity value/R. reniformis luciferase activity. The experiment was repeated three times.
Construction of eukaryotic expression vector p-EGEP-C3-Wnt-1
Gene Bank was used to retrieve the full-length Wnt-1 gene sequence (NM-005430), and the upstream primer and downstream primer was designed and synthesized by Shanghai Invitrogen Biotechnology Company (Shanghai, People’s Republic of China), and Hind III and Kpn I restriction sites were introduced. The upstream primer was 5′-GCAAGCTTATGAGGTGGCTCCTGCCC-3′ (Hind III) and the downstream primer was 3′-GCGGTACCCTAATTGGCAATCTCTTCGAAGTC-5′ (Kpn I). Polymerase chain reaction (PCR) conditions were as follows: predenaturation at 94°C for 5 minutes; a total of 30 cycles of denaturation at 94°C for 40 seconds, annealing at 58°C for 40 seconds, extension at 72°C for 60 seconds; and final extension at 72°C for 10 minutes. The PCR-amplified products were run on a 1.0% agarose gel electrophoresis, and the results were analyzed using the image processing system of Tanon GIS 2010, Shanghai, People’s Republic of China. The PCR-amplified target fragment Wnt-1 and p-EGEP-C3 plasmid were digested by Hind III and Kpn I, and the digested Wnt-1 and p-EGEP-C3 plasmid fragments were run on a 1.0% agarose gel electrophoresis and collected and linked by T4 DNA ligase (Takara Bio, Shiga, Japan) at 16°C overnight, and the product was transformed into Escherichia coli DH5h competent cells which were cultured in Luria–Bertani agar culture plates containing kanamycin (50 mg/L). Ten monoclones were randomly selected, and the colonies were used as templates to conduct PCR initial screening. The eukaryotic expression vector was named p-EGEP-C3-Wnt-1. Correct positive clones were identified and incubated overnight in Luria–Bertani culture medium containing kanamycin (50 mg/L). The recombinant plasmids were extracted and used as templates for PCR and double restriction enzyme digestion identification, and positive clones were sent to Shanghai Invitrogen Biotechnology Company to carry out sequencing.
Cell groups and transfections
In brief, 2×10⁵ cells were cultured in 2 mL Dulbecco’s Modified Eagle’s Medium (DMEM) containing 10% FBS in a six-well plate. Cells were divided into six groups: 1) miR-122 group, transfected with miR-122 mimics; 2) anti-miR-122 group, transfected with miR-122 inhibitor; 3) miR-NC group, transfected with miR NC; 4) anti-miR-NC group, transfected with anti-miR NC; 5) miR-122 + Wnt1 group (cotransfected with miR-122 mimics and p-EGEP-C3-Wnt1 plasmid); and 6) miR-122 + vector group (cotransfected with miR-122 mimics and blank plasmid). The cells were incubated overnight to achieve 50%–60% confluence, and Lipofectamine™ 2000 reagent was used for transfections (the manufacturer’s instructions were followed). The miR-122 sequences are shown in (Shanghai GenePharma Co., Ltd, Shanghai, People’s Republic of China). The transfected cells were placed in a thermostatic incubator at 37°C in 5% CO2 for 6 hours. After culture medium was replaced, the excitation light wavelength of the laser confocal microscopy was adjusted to cy3 fluorescence, and laser confocal microscopy was employed to identify transfected cells.
Table 1 The transfection sequences in miR-122, anti-miR-122, miR-NC, and anti-miR-NC groups
RNA extraction and quantitative real-time PCR
Total RNA was extracted using RNA Iso-plus reagent (Takara Bio). Ultraviolet spectrophotometer was used for measuring RNA concentration and purity. The reverse transcription PCR process was performed using PrimeScript RT Reagent Kit according to the manufacturer’s protocol.Citation16 Primers were designed by Primer 5.0 (Primer-E, Ltd., Plymouth, United Kingdom), (), and the reverse primer for miR-122 and U6 PCR used as internal control was the Uni-miR qPCR Primer offered by the kit.Citation17 The reverse transcription reaction contained 25 μL of total RNA and miRNA PrimeScript RT Enzyme Mix, and the 20 μL real-time PCR (RT-PCR) was performed in the ABI PRISM 7300 Fast Real-Time PCR System (Ambion, Foster City, CA, USA), with the conditions: 95°C for 5 minutes, 95°C for 10 seconds, and 40 cycles at 60°C for 20 seconds. The reaction for Wnt1- and EMT-related genes was performed under conditions of 95°C for 10 seconds, 95°C for 30 seconds, and 40 cycles at 60°C for 30 seconds. The products were separated by electrophoresis on 0.2% agarose gels. The results of RT-PCR were expressed as 2−ΔΔCt.
Table 2 The sequences of forward primers and reverse primers of miR-122, U6, Wnt1, E-cadherin, vimentin, β-cadherin, N-cadherin, and GAPDH
Western blot analysis
After 48-hour transfection, cell debris was removed by centrifugation, and total protein was extracted using RIPA cell lysis buffer. Protein concentration was determined by bicinchoninic acid (BCA) Protein Assay Kit (Pierce, Rockford, IL, USA) and proteins were separated by sodium dodecyl sulfate–polyacrylamide gel electrophoresis and blotted onto polyvinylidene difluoride membranes. The membranes were blocked with bovine serum albumin for 1 hour, and subsequently incubated with primary antibodies overnight at 4°C (Wnt1, 1:1,000; E-cadherin, 1:1,000; vimentin, 1:1,000; β-cadherin, 1:2,000; and N-cadherin, 1:400). After three washes with tris-buffered saline and Tween 20, the blots were incubated with secondary antibody conjugated to horseradish peroxidase (1:10,000) (Chemicon International, Inc., Billerica, MA, USA) at 37°C for 1 hour, and visualized by electrogenerated chemiluminescence (Amersham, Freiburg, Germany). The images were analyzed by Sigma Pro 5.0 software (SPSS Inc., Chicago, IL, USA). Glyceraldehyde-3-phosphate dehydrogenase (GAPDH) was used as an internal reference. Relative protein content = targeted protein gray value/GAPDH gray value. Samples in each group were analyzed three times.
MTT assay
After cell transfection for 24 hours, 1 mL culture medium suspended cells were diluted fivefold to be seeded in 96-well plates (each group with six duplicates) at 24, 48, 72, and 96 hours, respectively. 3-(4,5-Dimethylthiazol-2-yl)-2,5-diphenyl tetrazolium bromide (MTT; 10 μL, 5 mg/mL, Sigma, St Louis, MO, USA) was added into each well, and cells were incubated at 37°C in a 5% CO2 incubator and cultured for 4 hours. The cells were removed out and observed using an inverted microscope, and purple crystals were observed. Medium was discarded and added with 100 μL/well dimethyl-sulfoxide (Sigma) and the violet crystal was dissolved by oscillation. The absorbances of each well at 24, 48, 72, and 96 hours were measured at a wavelength of 490 nm by a microplate reader, and the cell growth curves were analyzed and drawn.
Wound-healing assay
A total of 1×10⁶ cells were seeded into six-well plates (each group with six duplicates) and incubated with mitomycin for 1 hour to inhibit cell division. The six-well plates were scratched with three parallel vertical lines using 200 μL pipettes.Citation18 The cells were washed three times with phosphate-buffered saline and incubated in serum-free DMEM. Cell motility was evaluated by observing, at intervals of 0, 24, and 48 hours, the movement of cells into the scratch area using a microscope. The images were recorded, and eight fields of imaging view were measured.
(1)
Transwell invasion and migration assays
Matrigel was diluted 1:8 with the precooled serum-free DMEM and stored overnight at 4°C. The Transwell chamber coated with Matrigel and the uncoated Transwell chamber (8 μm pore, Corning Inc., Lowell, MA, USA) were used for invasion and migration assays, respectively.Citation19 Cells were transfected with the desired plasmids, and trypsinized after 48-hour transfection. Each upper chamber was seeded with 1×10⁵ cells suspended in 100 μL of serum-free DMEM. The lower chamber was filled with DMEM supplemented with 10% FBS. After incubation at 37°C for 24 hours, the noninvading cells were gently removed with a soft cotton swab. The cells that invaded to the bottom chamber were fixed with 4% paraformaldehyde for 15 minutes, stained with 0.1% crystal violet, and counted by a light microscope at ×200 magnification. Five random fields were selected in the middle portion and the peripheral portion, and cells passing through the 8 μm pore were counted and calculated, which represented the invasion ability of cells. Cell migration assay procedure was similar to invasion assay, but the incubation lasted for 24 or 48 hours; nonmigratory cells on upper filters were also removed using cotton swab, and cells that had migrated on the underside of filters were fixed, stained, and counted.
Statistical analysis
Statistical analyses were performed using SPSS software (Version 19.0; SPSS). The measurement data are presented as mean ± standard deviation. Least Significant Difference- t-test was applied to compare differences. The comparison between groups was performed by applying one-way analysis of variance. All experiments were repeated three times. Differences were considered significant at P<0.05.
Results
Detection results of dual luciferase reporter gene
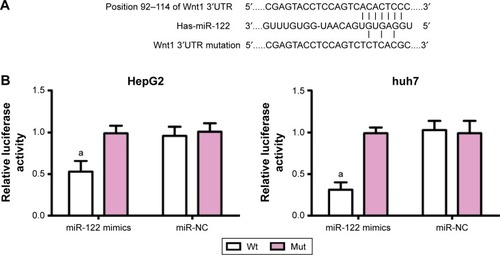
miRNA target gene software predicted that Wnt1 may be the target gene of miR-122 (). To confirm that Wnt1 is a direct target gene of miR-122, luciferase reporter vector reconstructed plasmids, pWnt1-Wt and pWnt1-Mut, that were inserted with Wnt1 mRNA3′-untranslated region. Luciferase activity test results showed that in HepG2 and huh7 cells with the cotransfected miR-122 mimics and recombinant plasmids pWnt1-Wt or pWnt1-Mut, miR-122 mimics had no significant effect on the intensity of luciferase activity in the mutant pWnt1-Mut group, but decreased its intensity by approximately 47% in the wild-type pWnt1-Wt group of HepG2 cells and by approximately 69% in huh7 cells, with statistically significant differences (both P<0.001) (); however, miR-NC had no obvious effects on the luciferase activity intensity of pWnt1-Mut and pWnt1-Wt groups in the HepG2 and huh7 cells.
Figure 1 miR-122 targeting Wnt1.
Abbreviations: miR-122, microRNA-122; NC, negative control; Wt, wild-type; Mut, mutated.
Expressions of miR-122 and mRNA expressions of Wnt1, E-cadherin, vimentin, β-cadherin, and N-cadherin
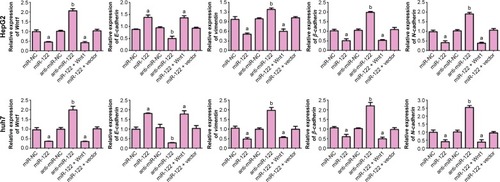
The expression of miR-122 in miR-NC, miR-122, anti-miR-NC, anti-miR-122, miR-122 + vector, and miR-122 + Wnt1 groups was 1.03±0.15, 4.22±0.20, 1.02±0.16, 0.41±0.12, 4.40±0.12, and 0.97±0.10, respectively, in HepG2 cells (F=459.0, P<0.01), while it was 1.05±0.13, 7.09±1.13, 1.01±0.11, 0.25±0.03, 6.85±1.29, and 0.97±0.10, respectively, in huh7 cells. There was no obvious difference in miR-122 expression among miR-NC group, anti-miR-NC group, and miR-122 + Wnt1 group (all P<0.05), but miR-122 expressions in miR-122 group and miR-122 + vector group were markedly higher, and the level in anti-miR-122 group was lower than the miR-NC group, anti-miR-NC group, and miR-122 + Wnt1 group (all P<0.05) (). The mRNA levels of Wnt1, E-cadherin, vimentin, β-cadherin, and N-cadherin were not statistically different among miR-NC group, anti-miR-NC group, and miR-122 + Wnt1 group (all P<0.05); when compared with miR-NC group, anti-miR-NC group, and miR-122 + Wnt1 group, Wnt1, vimentin, β-cadherin, and N-cadherin, the mRNA levels were significantly increased and E-cadherin mRNA level was decreased in miR-122 group and miR-122 + vector group; however, in anti-miR-122 group, Wnt1, vimentin, β-cadherin, and N-cadherin, mRNA levels were upregulated and E-cadherin mRNA level was downregulated (all P<0.05), as shown in .
Figure 2 qRT-PCR detecting miR-122 detection levels after transfection in HepG2 and huh7 cells.
Abbreviations: qRT-PCR, quantitative real-time polymerase chain reaction; miR-122, microRNA-122; NC, negative control.
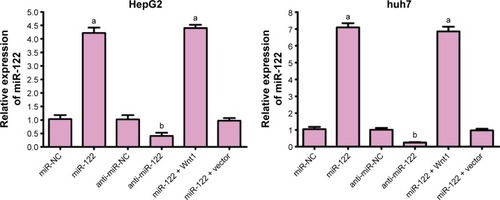
Figure 3 qRT-PCR detecting mRNA expressions of Wnt1- and EMT-related genes.
Abbreviations: qRT-PCR, quantitative real-time polymerase chain reaction; EMT, epithelial–mesenchymal transition; mRNA, messenger RNA; miR-122, microRNA-122; NC, negative control.
Protein levels of Wnt1, E-cadherin, vimentin, β-cadherin, and N-cadherin
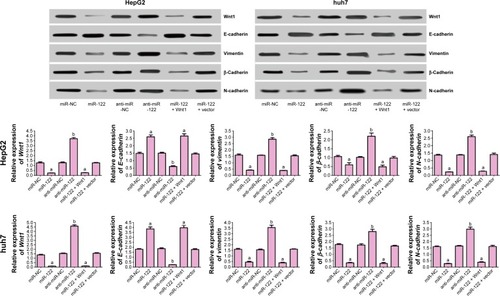
As seen in , protein levels of Wnt1, E-cadherin, vimentin, β-cadherin, and N-cadherin were not different among miR-NC group, anti-miR-NC group, and miR-122 + Wnt1 group (all P<0.05). However, protein levels of Wnt1, vimentin, β-cadherin, and N-cadherin in miR-122 group and miR-122 + vector group were significantly decreased, and E-cadherin protein level was increased, while the protein levels of Wnt1, vimentin, β-cadherin, and N-cadherin were higher and of E-cadherin was lower in anti-miR-122 group in comparison to miR-NC group, anti-miR-NC group, and miR-122 + Wnt1 group (all P<0.05).
Figure 4 Western blot detecting Wnt1 protein and EMT-associated proteins.
Abbreviations: EMT, epithelial–mesenchymal transition; miR-122, microRNA-122; NC, negative control.
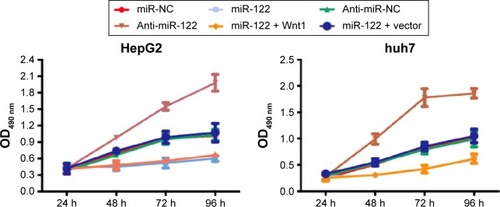
miR-122 in proliferation of HepG2 and huh7 cells
MTT results showed that compared with the miR-NC, anti-miR-NC, and miR-122 + Wnt1 groups, the cell proliferation rate was obviously slowed down in miR-122 group and miR-122 + vector group of HepG2 and huh7 cells, while it was significantly speeded up in anti-miR-122 group after cells were seeded for 48 hours (all P<0.05). The cell proliferation rate showed no statistical significance in the miR-NC group, anti-miR-NC group, and miR-122 + Wnt1 group (all P>0.05) ().
Figure 5 MTT assay detecting the effects of miR-122 on cell proliferation of HepG2 and huh7 cells.
miR-122 in migration capacity of HepG2 and huh7 cells
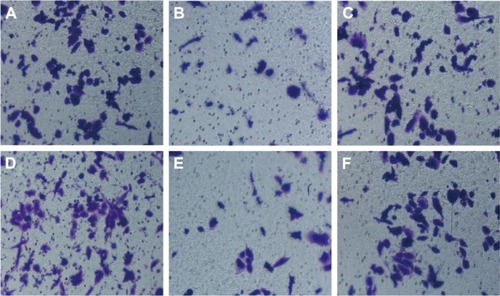
Wound-healing assay showed that HepG2 cell migration rate was not different significantly among miR-NC group, anti-miR-NC group, and miR-122 + Wnt1 group (all P>0.05). Nevertheless, we found that the migration rate was suppressed in miR-122 group and miR-122 + vector group, and the rate was dramatically augmented in anti-miR-122 group, compared to the miR-NC group, anti-miR-NC group, and miR-122 + Wnt1 group (all P<0.05) (). Transwell migration assay showed that the number of cells migrating through the membranes in miR-NC, miR-122, anti-miR-NC, anti-miR-122, miR-122 + vector, and miR-122 + Wnt1 groups was 197.17±13.69, 133.44±10.63, 207.67±12.58, 270.00±7.66, 147.31±17.6, and 199.96±10.87, respectively, in HepG2 cells (F=35.58, P<0.01) () and was 237.33±17.65, 143.69±13.76, 229.38±14.30, 299.31±10.56, 151.00±13.35, and 242.63±12.11, respectively, in huh7 cells (F=27.73, P<0.001) (). There was no difference in migrated HepG2 and huh7 cell numbers among the miR-NC group, the anti-miR-NC group, and the miR-122 + Wnt1 group (all P>0.05). However, the number of migrated HepG2 and huh7 cells was significantly decreased in miR-122 group and miR-122 + vector group, but increased in anti-miR-122 group (all P<0.05).
Figure 6 Transwell assay detecting migration capacity of HepG2 cells (A: miR-NC group; B: miR-122 group; C: anti-miR-NC group; D: anti-miR-122 group; E: miR-122 + vector group; F: miR-122 + Wnt1 group).
Abbreviations: miR-122, microRNA-122; NC, negative control.
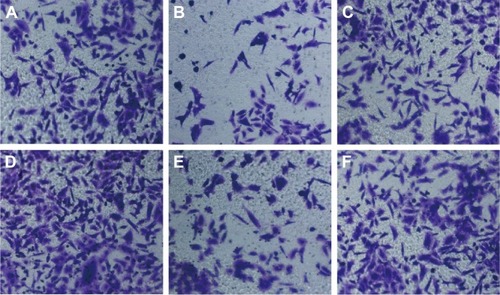
Figure 7 Transwell assay detecting migration capacity of huh7 cells (A: miR-NC group; B: miR-122 group; C: anti-miR-NC group; D: anti-miR-122 group; E: miR-122 + vector group; F: miR-122 + Wnt1 group).
Abbreviations: miR-122, microRNA-122; NC, negative control.
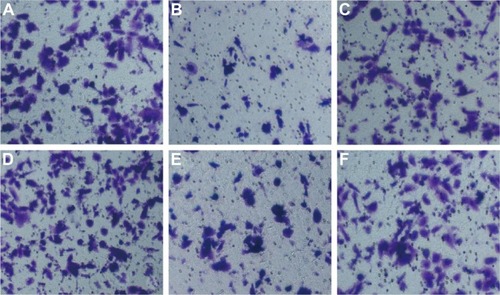
Table 3 Wound-healing assay detecting cell migration rate in HepG2 and huh7 cells at different time points
miR-122 in invasion capacity of HepG2 and huh7 cells
The number of HepG2 cells invading through Matrigel and across the membranes in miR-NC, miR-122, anti-miR-NC, anti-miR-122, miR-122 + vector, and miR-122 + Wnt1 groups was 163.70±16.33, 108.33±15.08, 160.33±17.35, 229.17±15.81, 105.31±11.21, and 167.41±13.42, respectively (F=55.90, P<0.001) (), while the number of huh7 cells invading through Matrigel and across the membranes in miR-NC, miR-122, anti-miR-NC, anti-miR-122, miR-122 + vector, and miR-122 + Wnt1 groups was 209.63±12.87, 109.76±12.39, 210.01±11.17, 355.50±13.11, 97.01±11.60, and 203.09±11.55, respectively (F=175.6, P<0.001) (). There was no obvious difference in invasion capacity among miR-NC group, anti-miR-NC group, and miR-122 + Wnt1 group (all P>0.05). However, the invasion capacity was significantly inhibited in miR-122 group and miR-122 + vector group, and the capacity was dramatically promoted in anti-miR-122 group compared to the miR-NC group, anti-miR-NC group, and miR-122 + Wnt1 group (all P<0.05).
Figure 8 Transwell assay detecting invasion capacity of HepG2 cells (A: miR-NC group; B: miR-122 group; C: anti-miR-NC group; D: anti-miR-122 group; E: miR-122 + vector group; F: miR-122 + Wnt1 group).
Abbreviations: miR-122, microRNA-122; NC, negative control.
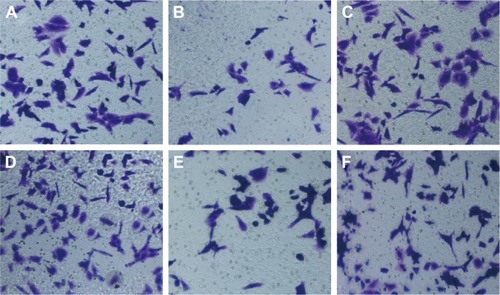
Figure 9 Transwell assay detecting invasion capacity of huh7 cells (A: miR-NC group; B: miR-122 group; C: anti-miR-NC group; D: anti-miR-122 group; E: miR-122 + vector group; F: miR-122 + Wnt1 group).
Abbreviations: miR-122, microRNA-122; NC, negative control.
Discussion
In the present study, we found that the proliferation rate and the migration rate were dramatically augmented in anti-miR-122 group. Transwell migration assay showed that the number of HepG2 and huh7 cells migrating through the membranes was significantly increased in anti-miR-122 group. Transwell invasion assay showed that the invasion capacity was dramatically promoted in anti-miR-122 group. miR-383 might inhibit HCC cell proliferation partially via downregulating APRIL expression.Citation20 Overexpression of miR-224 has been reported to be related with the malignant phenotype of HepG2 cells and played an important role in regulating the migration and invasion of HepG2 cells.Citation21 Besides, it has been shown that miR-1246, by downregulating CADM1, a well-defined tumor suppressor gene, enhances migration and invasion in HCC cells.Citation22
In this study, our main finding demonstrates that downregulation of miR-122 might regulate Wnt/β-catenin pathway, which is a key step in metastasis and invasion of hepatic carcinoma cells. The role of Wnt/β-catenin in HCC was widely studied, and it was suggested that a combination treatment of conventional chemotherapy agents and Wnt/β-catenin pathway inhibitors could derive effective antitumor response.Citation23 Some miRNAs including miR-122, miR-221, miR-1, and miR-21 have been investigated for their functions in suppressing cell cycle, cell invasion and metastasis, and cell proliferation and apoptosis.Citation24 In this context, miR-122 is identified as tumor suppressor, inducing apoptosis in HCC via directly targeting Wnt/β-catenin signaling.Citation25 Our dual luciferase reporter gene activity analysis validated that Wnt1 is a direct target gene of miR-122. Overexpression of miR-122 is associated with negative expression of Wnt1 gene in HepG2 and huh7 cells, thereby decreasing the activities of Wnt/β-catenin pathway by affecting downstream molecules such as E-cadherin, N-cadherin, and vimentin which are related with the EMT process.Citation26,Citation27 The trends of EMT-related gene and protein expressions of miR-122 + Wnt1 group were as the same of those in miR-NC group and anti-miR-NC group, which further verified that miR-122 targeted on Wnt1 to regulate the expressions of EMT-related genes and proteins. During EMT, epithelial markers are lost and mesenchyme-like phenotypes are gained, interfering with intercellular adhesions and promoting fibroblastic properties, which play important roles in the metastatic and invasive behavior of tumors.Citation28 The complex process of EMT is considered a pivotal step permitting metastasis and invasion in various cancers.Citation29,Citation30 EMT is accompanied by loss of cell adhesion proteins such as E-cadherin and gain expression of mesenchymal markers such as N-cadherin, β-cadherin, and vimentin.Citation31 E-cadherin is expressed in most epithelial cells, and downregulation of E-cadherin is a hallmark of EMT process.Citation32 Several pathways exist in various tumors to disrupt E-cadherin adhesion junctions. For example, E-cadherin expression is directly suppressed by transcriptional repressors such as Snail, ZEB1, and ZEB2 or through indirect repressors such as Twist, Goosecoid, FoxC2, and E2.2, which indirectly reduce E-cadherin transcription.Citation33,Citation34 The cadherin/cadherin-based adhesion system affects EMT process, and Wnt/β-catenin activity is capable of releasing β-cadherin to disassemble adherens junctions.Citation35 The loss of Wnt1 and β-cadherin is related to the loss of E-cadherin and subsequent induction of EMT, but suppression of Wnt/β-catenin can stimulate epithelial differentiation and delay EMT.Citation36,Citation37 Translocation of Wnt/β-catenin into the nucleus acts as critical regulator in tumor cell survival and proliferation.Citation38,Citation39 Initiation of aberrant β-catenin and E-cadherin signaling contributes to the early steps of the EMT process to promote tumorigenesis and metastasis.Citation40 In line with our finding, Wang et alCitation41 found that miR-122 triggers MET activation and suppresses HCC motility and invasion by targeting RhoA.
Taken together, we provide evidence that downregulation of miR-122 plays a key role in proliferation, migration, and invasion of HepG2 and huh7 cells by regulating Wnt/β-catenin pathway, which activated the EMT pathway.
Acknowledgments
We acknowledge our instructors for their valuable advice. We also thank the reviewers for their helpful comments on this paper.
Disclosure
The authors report no conflicts of interest in this work.
References
- MaurelMSamaliAChevetEEndoplasmic reticulum stress: at the crossroads of inflammation and metabolism in hepatocellular carcinoma developmentCancer Cell201426330130325203316
- YaoJLiangLHuangSMicroRNA-30d promotes tumor invasion and metastasis by targeting Galphai2 in hepatocellular carcinomaHepatology201051384685620054866
- WongCCWongCMTungEKThe microRNA miR-139 suppresses metastasis and progression of hepatocellular carcinoma by down-regulating Rho-kinase 2Gastroenterology2011140132233120951699
- TsaiJHDonaherJLMurphyDASpatiotemporal regulation of epithelial-mesenchymal transition is essential for squamous cell carcinoma metastasisCancer Cell201222672573623201165
- LiSMoCPengQCell surface glycan alterations in epithelial mesenchymal transition process of Huh7 hepatocellular carcinoma cellPLoS One201388e7127323977005
- ZhengFLiaoYJCaiMYThe putative tumour suppressor microRNA-124 modulates hepatocellular carcinoma cell aggressiveness by repressing ROCK2 and EZH2Gut201261227828921672940
- CeppiPPeterMEMicroRNAs regulate both epithelial-to-mesenchymal transition and cancer stem cellsOncogene201433326927823455327
- HurKToiyamaYTakahashiMMicroRNA-200c modulates epithelial-to-mesenchymal transition (EMT) in human colorectal cancer metastasisGut20136291315132622735571
- KumarswamyRMudduluruGCeppiPMicroRNA-30a inhibits epithelial-to-mesenchymal transition by targeting Snai1 and is downregulated in non-small cell lung cancerInt J Cancer201213092044205321633953
- DingXMMicroRNAs: regulators of cancer metastasis and epithelial-mesenchymal transition (EMT)Chin J Cancer201433314014724016392
- Stahlhut EspinosaCESlackFJThe role of microRNAs in cancerYale J Biol Med2006793–413114017940623
- YangFZhangLWangFModulation of the unfolded protein response is the core of microRNA-122-involved sensitivity to chemotherapy in hepatocellular carcinomaNeoplasia201113759060021750653
- CoulouarnCFactorVMAndersenJBLoss of miR-122 expression in liver cancer correlates with suppression of the hepatic phenotype and gain of metastatic propertiesOncogene200928403526353619617899
- SendiHDual role of miR-122 in molecular pathogenesis of viral hepatitisHepat Mon201212531231422783341
- MaDTaoXGaoFmiR-224 functions as an onco-miRNA in hepatocellular carcinoma cells by activating AKT signalingOncol Lett20124348348823741247
- WatanabeKHarada-ShibaMSuzukiAIn vivo siRNA delivery with dendritic poly(L-lysine) for the treatment of hypercholesterolemiaMol Biosyst20095111306131019823746
- YeRSXiQYQiQDifferentially expressed miRNAs after GnRH treatment and their potential roles in FSH regulation in porcine anterior pituitary cellPLoS One201382e5715623451171
- YanGNLvYFYangLGlioma stem cells enhance endothelial cell migration and proliferation via the Hedgehog pathwayOncol Lett2013651524153024179553
- SuYNiZWangGAberrant expression of microRNAs in gastric cancer and biological significance of miR-574-3pInt Immunopharmacol201213446847522683180
- ChenLGuanHGuCmiR-383 inhibits hepatocellular carcinoma cell proliferation via targeting APRILTumour Biol Epub2015915
- LiQWangGShanJLMicroRNA-224 is upregulated in HepG2 cells and involved in cellular migration and invasionJ Gastroenterol Hepatol201025116417119793168
- SunZMengCWangSMicroRNA-1246 enhances migration and invasion through CADM1 in hepatocellular carcinomaBMC Cancer20141461625159494
- WolfeAThomasAEdwardsGIncreased activation of the Wnt/β-catenin pathway in spontaneous hepatocellular carcinoma observed in farnesoid X receptor knockout miceJ Pharmacol Exp Ther20113381122121430080
- TuratoCSimonatoDQuartaSMicroRNAs and SerpinB3 in hepatocellular carcinomaLife Sci2014100191724496037
- XuJZhuXWuLMicroRNA-122 suppresses cell proliferation and induces cell apoptosis in hepatocellular carcinoma by directly targeting Wnt/β-catenin pathwayLiver Int201232575276022276989
- WuXWuSTongLmiR-122 affects the viability and apoptosis of hepatocellular carcinoma cellsScand J Gastroenterol200944111332133919891584
- TsaiWCHsuSDHsuCSMicroRNA-122 plays a critical role in liver homeostasis and hepatocarcinogenesisJ Clin Invest201212282884289722820290
- NagaiTAraoTFurutaKSorafenib inhibits the hepatocyte growth factor-mediated epithelial mesenchymal transition in hepatocellular carcinomaMol Cancer Ther201110116917721220499
- JouJDiehlAMEpithelial-mesenchymal transitions and hepatocarcinogenesisJ Clin Invest201012041031103420335655
- YangJWeinbergRAEpithelial-mesenchymal transition: at the crossroads of development and tumor metastasisDev Cell200814681882918539112
- ZhouXHuYDaiLMicroRNA-7 inhibits tumor metastasis and reverses epithelial-mesenchymal transition through AKT/ERK1/2 inactivation by targeting EGFR in epithelial ovarian cancerPLoS One201495e9671824816687
- JingYHanZLiuYMesenchymal stem cells in inflammation microenvironment accelerates hepatocellular carcinoma metastasis by inducing epithelial-mesenchymal transitionPLoS One201278e4327222952657
- LeeJYParkMKParkJHLoss of the polycomb protein Mel-18 enhances the epithelial-mesenchymal transition by ZEB1 and ZEB2 expression through the downregulation of miR-205 in breast cancerOncogene201433101325133523474752
- SobradoVRMoreno-BuenoGCubilloEThe class I bHLH factors E2-2A and E2-2B regulate EMTJ Cell Sci2009122Pt 71014102419295128
- HowardSDerooTFujitaYA positive role of cadherin in Wnt/β-catenin signalling during epithelial-mesenchymal transitionPLoS One201168e2389921909376
- HuangJXiaoDLiGEphA2 promotes epithelial-mesenchymal transition through the Wnt/β-catenin pathway in gastric cancer cellsOncogene201433212737274723752181
- GiangrecoALuLVickersCβ-Catenin determines upper airway progenitor cell fate and preinvasive squamous lung cancer progression by modulating epithelial-mesenchymal transitionJ Pathol2012226457558722081448
- ZhangQBaiXChenWWnt/β-catenin signaling enhances hypoxia-induced epithelial-mesenchymal transition in hepatocellular carcinoma via crosstalk with hif-1α signalingCarcinogenesis201334596297323358852
- MacDonaldBTTamaiKHeXWnt/β-catenin signaling: components, mechanisms, and diseasesDev Cell200917192619619488
- Sanchez-TilloEde BarriosOSilesLβ-Catenin/TCF4 complex induces the epithelial-to-mesenchymal transition (EMT)-activator ZEB1 to regulate tumor invasivenessProc Natl Acad Sci U S A201110848192041920922080605
- WangSCLinXLLiJMicroRNA-122 triggers mesenchymal-epithelial transition and suppresses hepatocellular carcinoma cell motility and invasion by targeting RhoAPLoS One201497e10133024992599