
 ?Mathematical formulae have been encoded as MathML and are displayed in this HTML version using MathJax in order to improve their display. Uncheck the box to turn MathJax off. This feature requires Javascript. Click on a formula to zoom.
Abstract
Purpose
This study aimed to identify molecular prognostic biomarkers for gastric cancer.
Methods
mRNA and miRNA expression profiles of eligible gastric cancer and control samples were downloaded from Gene Expression Omnibus to screen the differentially expressed genes (DEGs) and differentially expressed miRNAs (DEmiRs), using MetaDE and limma packages, respectively. Target genes of the DEmiRs were also collected from both predictive and experimentally validated target databases of miRNAs. The overlapping genes between selected targets and DEGs were identified as risk genes, followed by functional enrichment analysis. Human pathways and their corresponding genes were downloaded from the Kyoto Encyclopedia of Genes and Genomes (KEGG) database for the expression analysis of each pathway in gastric cancer samples. Next, co-pathway pairs were selected according to the Pearson correlation coefficients. Finally, the co-pathway pairs, miRNA–target pairs, and risk gene–pathway pairs were merged into a complex interaction network, the most important nodes (miRNAs/target genes/co-pathway pairs) of which were selected by calculating their degrees.
Results
Totally, 1,260 DEGs and 144 DEmiRs were identified. There were 336 risk genes found in the 9,572 miRNA–target pairs. Judging from the pathway expression files, 45 co-pathway pairs were screened out. There were 1,389 interactive pairs and 480 nodes in the integrated network. Among all nodes in the network, focal adhesion/extracellular matrix–receptor interaction pathways, CALM2, miR-19b, and miR-181b were the hub nodes with higher degrees.
Conclusion
CALM2, hsa-miR-19b, and hsa-miR-181b might be used as potential prognostic targets for gastric cancer.
Introduction
Gastric cancer ranks as the fifth most common cancer and the third leading cause for cancer death, with diverse histological and molecular subtypes.Citation1,Citation2 Over the past decades, due to the remarkable advances in diagnosis and treatment, the incidence and mortality of gastric cancer have decreased significantly in most countries globally.Citation3 However, gastric cancer is still a challenge to be tackled, demanding intensive studies.
One of the prerequisites for the effective therapy of gastric cancer is to understand its prognosis status. Recently, several studies have been performed to investigate prognostic biomarkers for gastric cancer and their prognostic effects.Citation4,Citation5 For example, overexpression of stomatin-like protein 2 is reported to be associated with invasion depth, tumor node metastasis stage, as well as lymph node and distant metastases, leading to poor prognosis in gastric cancer.Citation6 Notch-1 has also been proven to be correlated with gastric cancer progression and to exert a predictive role for the poor clinical outcome of gastric cancer.Citation7 Li et alCitation8 have found by analyzing microarray data that a seven-miRNA signature (miR-10b, miR-21, miR-223, miR-338, let-7a, miR-30a-5p, and miR-126) is related to the survival and relapse of gastric cancer. Furthermore, analysis of oncogenic signaling pathways through the genomic and proteomic expression profiles has revealed the effect of their abnormalities on the prognosis of gastric cancer.Citation9 For instance, the vascular endothelial growth factor (VEGF) pathway was reported as a possible prognostic factor for gastric cancer.Citation10 The expression of VEGF is increased in gastric cancer cell lines, facilitating increases in their proliferation, motility, and adhesion.Citation11 Targeted inhibition of the VEGF pathway has been an important strategy to improve prognosis in gastric cancer therapy.Citation12 By constructing an interconnected network, Cheng et alCitation13 showed that deregulation of WNT, NF-κB, and RTK-Ras-PIK3-AKT pathways may be involved in the development of gastric cancer by causing excessive cell proliferation and sustained angiogenesis. However, the prognostic biomarkers that can be applied in the clinic remain rare and thus further investigation of the etiology of gastric cancer is still necessary.
In this study, we aim to screen for highly potential prognostic molecules for gastric cancer by comprehensively analyzing genes, miRNAs, and pathways and thereafter integrating them, to construct an miRNA–target–pathway pairs network, the results of which may be believed to be more credible compared with the separate analysis of each. To our knowledge, this has not been previously reported.
Methods
mRNA and miRNA expression profiles
The mRNA microarray profiles of human gastric cancer samples were retrieved from Gene Expression Omnibus (GEO; http://www.ncbi.nlm.nih.gov/geo). After the first screening, 154 related studies underwent a second screening using the following criteria: 1) the studies should have involved no less than ten samples; 2) tissue samples instead of cell samples should have been studied; 3) gastric tissue samples should be the only research topics; 4) the cancer should not have been caused by chemotherapy and other artificial stimulations; 5) the samples should have only undergone the treatment for microarray analysis; 6) normal control samples or normal adjacent tissues should be available; 7) the platforms should include data on >10,000 genes; 8) the annotation of the samples should be available; 9) the data should not be two-panel data; and 10) the profile should have many overlapping genes with the other profiles. Next, different subtypes of gastric cancer samples were merged as the disease samples, while the normal tissue and adjacent tissue samples were recognized as the control samples. Finally, a total of 13 data sets, comprising 497 disease samples and 425 control samples, were selected for further analysis ().
Table 1 Summary of mRNA expression profiles for gastric cancer
In addition, the miRNA expression profile for gastric cancer (accession number GSE26595) was also downloaded from GEO. A total of 60 gastric samples and eight normal samples were available, based on the GPL8197 platform.
Screening for differentially expressed genes and miRNAs
As the mRNA microarray data were merged from 13 individual data sets, MetaDECitation14 in R language was used to identify the genes whose expressions differed between cancer samples and control samples. Genes with adjusted P-value (false discovery rate or FDR) <0.01 were considered differentially expressed genes (DEGs). For the screening of the differentially expressed miRNAs (DEmiRs), limmaCitation15 in R language was utilized with the threshold of FDR <0.05.
Potential gastric cancer-related genes
The targets of the DEmiRs were first identified from the following four databases: PicTar (http://pictar.mdc-berlin.de/), TargetScan (http://www.targetscan.org/), PITA (http://genie.weizmann.ac.il/pubs/mir07/mir07_data.html), and miRanda (http://www.microrna.org/microrna/getDownloads.do). The targets of a certain miRNA were selected as those predicted by at least three of these four databases. Additionally, miRecords,Citation16 miRTarBase,Citation17 and TarBaseCitation18 were also searched to identify the verified targets of the DEmiRs. Targets from these screenings were merged as the final targets of the DEmiRs. Finally, the targets that overlapped with the DEGs were recognized as the potential gastric cancer-related genes.
Functional enrichment
The potential gastric cancer-related genes were subjected to functional interpretation using the online tools of the bioinformatics resource Database for Annotation, Visualization and Integrated Discovery for function and pathway enrichment. The terms with FDR <0.05 were considered the significant terms of these genes.
Pathway expression profile
The Kyoto Encyclopedia of Genes and Genomes (KEGG; http://www.genome.jp/kegg/pathway.htm) is a database for the functional analysis of genes. All the human pathways and genes in these pathways were downloaded from KEGG for further analysis. Next, the expression level of each pathway in the samples was calculated by computing the expression levels of its genes in each sample, to obtain the pathway expression profile. The expression level of the pathway was calculated using the following formula:
(1)
Here, Pathik is the expression level of pathway i in sample k; g1, g2, g3,…, gn are the expression values in sample k of all genes in pathway i. Pathik remains the same when there are observation errors, abnormal values, and heteroskedastic variances; therefore, it is chosen as the repression of expression levels of pathways.
Screening of co-pathway pairs
To obtain a comprehensive understanding about the roles of abnormal pathways in gastric cancer, the co-pathway pairs that are closely connected were identified by calculating their expression correlations in all samples. The correlation was measured by the value of the Pearson correlation coefficient, which was computed using the following formula:
(2)
Here, PX, Y is the Pearson correlation coefficient between pathways X and Y in all samples.
and
are the average expression values of pathways X and Y, respectively.
Subsequently, the co-pathway pairs highly related to gastric cancer were screened using EquationEquation 3(3) based on the hypergeometric distribution algorithm:
(3)
Here, n represents the common gastric cancer-related genes in the two pathways. N represents all the genes of the co-pathway pairs, M represents cancer-related genes of the co-pathway pairs and C represents the combination of genes of the co-pathway pairs. The co-pathway pairs with P<0.05 were considered to be the significant gastric cancer-related co-pathway pairs.
Construction of miRNA–risk gene–pathway pair integrated network
The common cancer-related genes in the co-pathway pairs were abstracted to merge with the target genes of DEmiRs from the miRNA–risk gene pairs. Subsequently, an integrated network of miRNA–risk gene–pathway pair was constructed, for which the network analysis was carried out based on the Cytoscape softwareCitation19 to calculate the network’s topological features. Additionally, classification of the most important miRNAs in the network was achieved by cross-validation by calculating the receiver operating characteristic (ROC) value.
Results
Screening for DEGs and DEmiRs
The expression profiles of the normal and gastric cancer samples from 13 studies were analyzed for the DEGs using the MetaDE method. Under the threshold of FDR <0.01, a total of 1,260 DEGs were identified, including 1,139 upregulated ones and 121 downregulated ones (). The DEmiRs were identified using limma package; totally, 144 DEmiRs were obtained, comprising 69 upregulated and 75 downregulated ones ().
Table 2 Top ten differentially expressed genes
Table 3 Top ten differentially expressed miRNAs
miRNA–target pairs
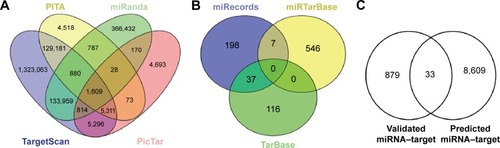
In all, a total of 8,642 predicted target genes for DEmiRs were identified from PicTar, PITA, miRanda, and TargetScan (), while a total of 912 verified target genes were identified from miRecords, miRTarBase, and Tarbase (). Finally, the common genes of potential targets and verified targets were selected for the eventual miRNA–target pairs ().
Figure 1 The numbers of target genes for DEmiRs.
Abbreviation: DEmiR, differentially expressed miRNA.
Potential gastric cancer-related genes
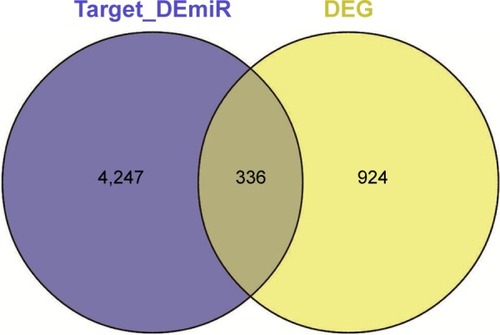
The eventual targets for DEmiRs were merged with DEGs to select the potential gastric cancer-related genes (risk genes), and the miRNA–risk gene pairs were believed to play vital roles in the development of gastric cancer. Totally, 570 miRNA–risk gene pairs were obtained with 35 miRNAs and 336 risk genes ().
Figure 2 The number of risk genes.
Functional enrichment
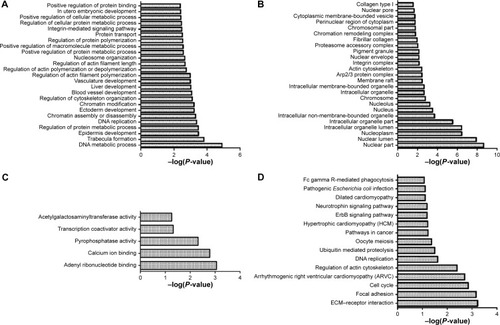
The enrichment analysis showed that DNA metabolic process, trabecula formation, and epidermis development were the most dysfunctional biological processes; nuclear part, nuclear lumen, and nucleoplasm were the most dysfunctional cellular components; adenyl ribonucleotide binding, calcium ion binding, and pyrophosphatase activity were the most dysfunctional molecular functions; extracellular matrix (ECM)–receptor interaction, focal adhesion, and cell cycle were the most dysfunctional pathways ().
Figure 3 Enriched functions and pathways of risk genes.
Abbreviation: ECM, extracellular matrix.
Pathway expression profile and co-pathway pairs
Totally, 239 human pathways were extracted from KEGG to construct the pathway expression profile (). According to the Pearson correlation coefficients, 45 co-pathway pairs were selected as the most closely related pairs. Next, 15 of these co-pathway pairs were chosen as the most significant ones connected with risk genes. The risk gene–pathway pairs were next combined with the miRNA–risk gene pairs for the construction of miRNA–risk gene–pathway pair network. The integrated network consisted of 1,398 interaction pairs and 480 nodes (miRNA, risk genes, co-pathway pairs) ().
Figure 4 Heat map of the pathway expression profile.
Abbreviations: GABA, gamma-aminobutyric acid; TGF-β, transforming growth factor-β; VEGF, vascular endothelial growth factor; cAMP, 3′,5′-cyclic adenosine monophosphate; TNF, tumor necrosis factors; GnRH, gonadotropin-releasing hormone; TRP channels, transient receptor potential channels; AMPK, AMP-activated protein kinase; NOD, nucleotide-binding, oligomerization domain; RIG-I, retinoic acid-inducible gene 1; NF-κB, nuclear factor kappa-light-chain-enhancer of activated B cells; ECM, extracellular matrix; PI3K, phosphatidylinositol 3-kinase; ABC transporters, ATP-binding cassette transporters; HTLV-I, human T-cell lymphotropic virus type 1; cGMP, 3′,5′-cyclic guanosine monophosphate; PPAR, peroxisome proliferator-activated receptors; Jak-STAT, janus kinase-signal transducer and activator of transcription; MAPK: mitogen-activated protein kinase; mTOR, mammalian target of rapamycin.
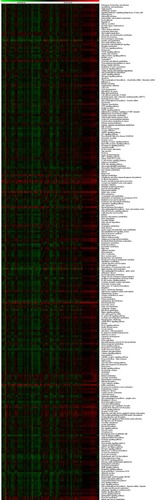
Figure 5 miRNA-risk gene-pathway pair complex network.
Abbreviation: ECM, extracellular matrix.
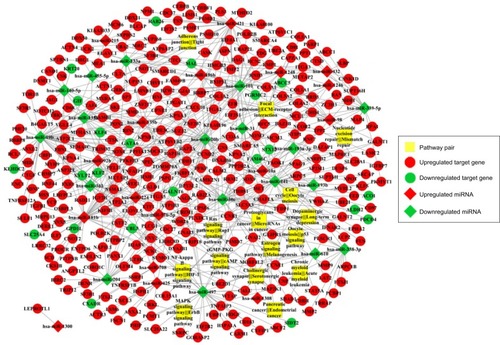
Using Cytoscape, the topological features of the network were calculated (). The co-pathway pairs “Focal adhesion/ECM–receptor interaction”, “Proteoglycans in cancer/MicroRNAs in cancer”, and “3′,5′-cyclic guanosine monophosphate (cGMP)–protein kinase G (PKG) signaling pathway/3′,5′-cyclic adenosine monophosphate (cAMP) signaling pathway” were closely associated with risk genes. cGMP–PKG signaling pathway/cAMP signaling pathway pair was the co-pathway pair with the highest degree. CALM2 was the most important gene in the integrated network, with the highest connecting degree with miRNAs and pathway pairs (; ), such as cGMP–PKG signaling pathway/cAMP signaling pathway, Estrogen signaling pathway/Melanogenesis, and Ras signaling pathway/Rap1 signaling pathway. Moreover, CALM2 was regulated by hsa-miR-193a-3p, hsa-miR-1246, hsa-miR-193b, hsa-miR-19b, hsa-miR-196b, and hsa-miR-181b. The topological features of the top 15 miRNAs with highest degrees are listed in , with hsa-miR-19b and hsa-miR-181b as the top two miRNAs. As these two miRNAs had differential expressions in gastric cancer samples compared with the normal samples (), their ability to classify the disease samples was detected by cross-validation. The results showed that hsa-miR-19b had an ROC value of 0.7281, while hsa-miR-181b had an ROC value of 0.9125 ().
Figure 6 Interactive nodes of risk gene CALM2 in the integrated network of miRNA–risk gene–pathway pair.
Abbreviation: ECM, extracellular matrix.
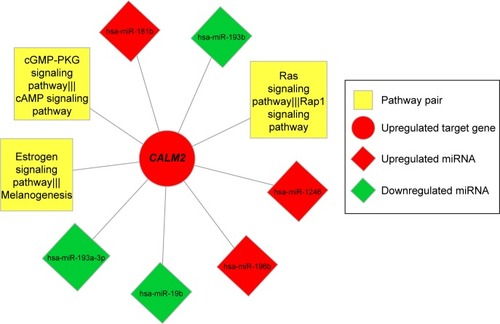
Figure 7 Expressions and classification efficacy of two miRNAs with highest degrees in the integrated network.
Abbreviation: ROC, receiver operating characteristic.
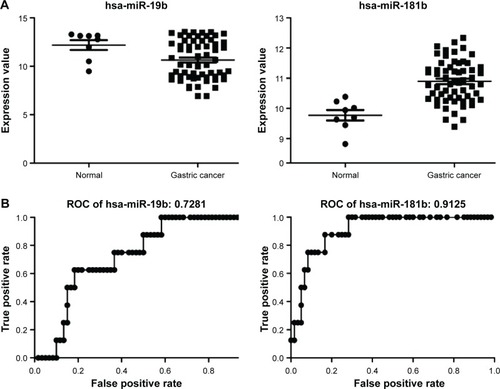
Table 4 Network topological features of 15 pathways
Table 5 Network topological features of the top 15 risk genes with highest degrees
Table 6 Network topological features of the top 15 differentially expressed miRNAs with highest degrees
Discussion
The pathways with higher degrees in the integrated network were considered to be the pathways significantly associated with the occurrence and development of gastric cancer, and the co-pathway pair “Focal adhesion/ECM–receptor interaction” was found to interact with the DEGs of gastric cancer samples. Focal adhesion kinase regulates the intercellular signaling network, which plays a key role in the differentiation and metastasis of cells. Interruption of this pathway inhibits the spread of gastric cancer cells.Citation20,Citation21 It is reported that the connection of Focal adhesion/ECM–receptor interaction induces cascade reactions, and they are both involved in gastric carcinoma.Citation22–Citation24
Calmodulin is a highly conserved Ca2+-binding protein in the calcium signaling process, participating in signaling pathways including motility, proliferation, and cell cycle progression and thus plays important roles in cancer development.Citation25 CALM2, a risk gene with the highest degree in our integrated network, encodes calmodulin 2, which has also been found to be overexpressed in mammary cancer cells.Citation26–Citation28 High expression of CALM2 may promote the activation of a calcium/calmodulin-dependent kinase 2 (CaMKII), which then enhances the metastasis of gastric cancer by upregulating NF-κB and Akt-mediated matrix metalloproteinase-9 production.Citation29,Citation30
miRNAs are evolutionarily conserved small noncoding RNAs, which have shown their roles in the onset and progression of cancers.Citation31 Many miRNAs have been proven to be associated with the prognosis of various solid tumors.Citation32 As a member in the miR-17-92 cluster, miR-19b is recognized as an oncomiR influencing multiple aspects of the phenotypes of gastric cancer.Citation33 The expression of miR-19b is high in gastric cancer tissues and it is significantly associated with its metastasis.Citation34 In gastric cancer, the expression of miR-181 is upregulated.Citation35 Guo et alCitation36 have found that miR-181b is a potential therapeutic target for gastric neoplasms. Moreover, miR-181b also holds great potential to be used as a prognostic biomarker for gastric cancer in the late stage.Citation37 In this study, these two miRNAs showed satisfactory classification of the gastric cancers, with ROC values of 0.7281 and 0.9125, which further confirmed their prognostic roles in gastric cancer. Additionally, this consistency also proved the accuracy of the miRNA–targets–pathway pair network.
It is reported that miRNAs may function in cancer by repressing the expression of target genes via binding to the 3′-untranslated region. A previous studyCitation38 has observed that CALM2 is a target anti-correlated with the DEmiR hsa-miR-130b. However, no researchers have identified the correlations between CALM2 and hsa-miR-19b/hsa-miR-181b. Considering the roles of these two genes and the association between these and CALM2, we assumed that CALM2 might be an important prognostic molecule for gastric cancer.
Conclusion
By constructing the miRNA–target–pathway pair network, our findings indicate that Focal adhesion/ECM–receptor interaction pathway, CALM2, hsa-miR-19b, and hsa-miR-181b might be used as potential prognostic targets for gastric cancer. However, further experimental studies are needed to confirm our conclusion.
Acknowledgments
This study was supported by the China Postdoctoral Science Foundation (grant number: 2014M552576) and the National Natural Science Foundation of China (grant number: 81402433).
Disclosure
The authors report no conflicts of interest in this work.
References
- WangKYuenSTXuJWhole-genome sequencing and comprehensive molecular profiling identify new driver mutations in gastric cancerNat Genet201446657358224816253
- FockKReview article: the epidemiology and prevention of gastric cancerAliment Pharmacol Ther201440325026024912650
- FerroAPeleteiroBMalvezziMWorldwide trends in gastric cancer mortality (1980–2011), with predictions to 2015, and incidence by subtypeEur J Cancer20145071330134424650579
- ZhaoWZhuHZhangSTrop2 is overexpressed in gastric cancer and predicts poor prognosisOncotarget2016756136614526716416
- YingJXuQLiuBZhangGChenLPanHThe expression of the PI3K/AKT/mTOR pathway in gastric cancer and its role in gastric cancer prognosisOnco Targets Ther201582427243326366097
- LiuDZhangLShenZIncreased levels of SLP-2 correlate with poor prognosis in gastric cancerGastric Cancer201316449850423371255
- ZhangHWangXXuJSunYNotch1 activation is a poor prognostic factor in patients with gastric cancerBr J Cancer201411092283229024642622
- LiXZhangYZhangYDingJWuKFanDSurvival prediction of gastric cancer by a seven-microRNA signatureGut201059557958519951901
- LimSMLimJYChoJYTargeted therapy in gastric cancer: personalizing cancer treatment based on patient genomeWorld J Gastroenterol20142082042205024587678
- PenonDCitoLGiordanoANovel findings about management of gastric cancer: a summary from 10(th) IGCCWorld J Gastroenterol201420278986899225083072
- LiuKChenHYouQShiHWangZThe siRNA cocktail targeting VEGF and HER2 inhibition on the proliferation and induced apoptosis of gastric cancer cellMol Cell Biochem20143861–211712424158524
- Abdel-RahmanOTargeting vascular endothelial growth factor (VEGF) pathway in gastric cancer: preclinical and clinical aspectsCrit Rev Oncol Hematol2015931182724970311
- ChengLYangSYangYGlobal gene expression and functional network analysis of gastric cancer identify extended pathway maps and GPRC5A as a potential biomarkerCancer Lett2012326110511322867946
- LiJTsengGCAn adaptively weighted statistic for detecting differential gene expression when combining multiple transcriptomic studiesAnn Appl Stat201159941019
- PatnaikSKKannistoEKnudsenSEvaluation of microRNA expression profiles that may predict recurrence of localized stage I non-small cell lung cancer after surgical resectionCancer Res2010701364520028859
- XiaoFZuoZCaiGKangSGaoXLiTmiRecords: an integrated resource for microRNA-target interactionsNucleic Acids Res200937Database issueD105D11018996891
- HsuSDLinFMWuWYmiRTarBase: a database curates experimentally validated microRNA-target interactionsNucleic Acids Res201139Database issueD163D16921071411
- SethupathyPCordaBHatzigeorgiouAGTarBase: a comprehensive database of experimentally supported animal microRNA targetsRNA200612219219716373484
- ShannonPMarkielAOzierOCytoscape: a software environment for integrated models of biomolecular interaction networksGenome Res200313112498250414597658
- SuGQZhangFXMaoHHResearch of shRNAmir inhibitory effects towards focal adhesion kinase expression in the treatment of gastric cancerOncol Lett20159259560325621028
- ChengYJZhuZXZhouJSSilencing profilin-1 inhibits gastric cancer progression via integrin beta1/focal adhesion kinase pathway modulationWorld J Gastroenterol20152182323233525741138
- HuKChenFIdentification of significant pathways in gastric cancer based on protein-protein interaction networks and cluster analysisGenet Mol Biol201235370170823055812
- YangSShinJParkKHMolecular basis of the differences between normal and tumor tissues of gastric cancerBiochim Biophys Acta2007177291033104017601708
- LiuPWangXHuCHHuTHBioinformatics analysis with graph-based clustering to detect gastric cancer-related pathwaysGenet Mol Res20121133497350423079843
- CoticchiaCMRevankarCMDebTBDicksonRBJohnsonMDCalmodulin modulates Akt activity in human breast cancer cell linesBreast Cancer Res Treat2009115354556018587642
- KrólMSkierskiJRaoNTranscriptomic profile of two canine mammary cancer cell lines with different proliferative and anti-apoptotic potentialJ Physiol Pharmacol200960Suppl 19510619609018
- CalaluceRGubinMMDavisJWThe RNA binding protein HuR differentially regulates unique subsets of mRNAs in estrogen receptor negative and estrogen receptor positive breast cancerBMC Cancer20101012620370918
- RustRVisserLLeijJHigh expression of calcium-binding proteins, S100A10, S100A11 and CALM2 in anaplastic large cell lymphomaBr J Haematol2005131559660816351635
- LiuZHanGCaoYWangYGongHCalcium/calmodulin-dependent protein kinase II enhances metastasis of human gastric cancer by upregulating nuclear factor-κb and Akt-mediated matrix metalloproteinase-9 productionMol Med Rep20141052459246425174603
- SubbannayyaYSyedNBarbhuiyaMACalcium calmodulin dependent kinase kinase 2 – a novel therapeutic target for gastric adenocarcinomaCancer Biol Ther201516233634525756516
- GarofaloMDi LevaGCroceCMMicroRNAs as anti-cancer therapyCurr Pharm Des201420335328533524479801
- UedaTVoliniaSOkumuraHRelation between microRNA expression and progression and prognosis of gastric cancer: a microRNA expression analysisLancet Oncol20101113614620022810
- WangFLiTZhangBMicroRNA-19a/b regulates multidrug resistance in human gastric cancer cells by targeting PTENBiochem Biophys Res Commun2013434368869423603256
- WuQYangZAnYmiR-19a/b modulate the metastasis of gastric cancer cells by targeting the tumour suppressor MXD1Cell Death Dis20145e114424675462
- WangJWangQLiuHHuBZhouWChengYMicroRNA expression and its implication for the diagnosis and therapeutic strategies of gastric cancerCancer Lett2010297213714320797817
- GuoJXTaoQSLouPRChenXCChenJYuanGBmiR-181b as a potential molecular target for anticancer therapy of gastric neoplasmsAsian Pac J Cancer Prev20121352263226722901205
- JiangJZhengXXuXPrognostic significance of miR-181b and miR-21 in gastric cancer patients treated with S-1/oxaliplatin or doxifluridine/oxaliplatinPLoS One201168e2327121876743
- YangJZengYIdentification of miRNA-mRNA crosstalk in pancreatic cancer by integrating transcriptome analysisEur Rev Med Pharmacol Sci201519582583425807437