
Abstract
Objective
Breast cancer (BC) is still a lethal threat to women worldwide. An accurate screening and diagnosis strategy performed in an easy-to-operate manner is highly warranted in clinical perspective. Besides the routinely focused protein markers, blood is full of small molecular metabolites with diverse structures and properties. This study aimed to screen metabolite markers with BC diagnosis potentials.
Methods
A dried blood spot-based direct infusion mass spectrometry (MS) metabolomic analysis was conducted for BC and non-BC differentiation. The targeted analytes included 23 amino acids and 26 acylcarnitines.
Results
Multivariate analysis screened out 21 BC-related metabolites in the blood. Regression analysis generated a diagnosis model consisting of parameters Pip, Asn, Pro, C14:1/C16, Phe/Tyr, and Gly/Ala. Tested with another set of BC and non-BC samples, this model showed a sensitivity of 92.2% and a specificity of 84.4%. Compared to the routinely used protein markers, this model exhibited distinct advantage with its higher sensitivity.
Conclusion
Blood metabolites screening is a more plausible approach for BC detection. Furthermore, this direct MS analysis could be finished within few minutes, which means that its throughput is higher than the currently used imaging techniques.
Introduction
Breast cancer (BC) is the leading cause of cancer-related deaths in women. Although there are many newly emerged screening and therapeutic measures, the morbidity and mortality are still not satisfactorily controlled, posing a great challenge to public health.Citation1 Annually, it is estimated that ~1.3 million new BC cases are diagnosed worldwide.Citation2
A growing body of evidence has demonstrated that BC patients’ outcome is intensely influenced by cancer stage at the point of diagnosis. Early-stage patients have higher 5-year survival rate than those diagnosed at later stage.Citation3 Thus, effective BC screening plays key roles in improving survival rates and prognosis. The discovery of BRCA1/2, ERBB2, ESR1/ER, and relevant genes strengthens our ability to discriminate, screen, and treat BC. Unfortunately, the cost and availability of the relevant facilities prevent routine application of genetic screening, especially in the undeveloped countries. Additionally, utility of solely genetic information for early BC detection is not fully convincing.Citation4
Currently, BC screening largely relies on radiologic and serum protein marker detection strategies.Citation5,Citation6 Magnetic resonance imaging and computed tomography are relatively reliable tactics that help BC diagnosis clinically, but they are not cost-effective and are not easily accessed by citizens living in the undeveloped regions.Citation7 Although mammography checking has claimed to reduce BC-related deaths from 13% to 25%, it is at the expense of ~30% overdiagnosis in addition to the risk of large-dose radiation exposure.Citation8 In addition, this screening needs the presence of potential patients in the whole checking process, making it a time-consuming operation.
Blood tumor marker detection has been widely advocated for BC screening, diagnosis, and prognostic prediction. The widely used markers include, but are not limited to, carcinoembryonic antigen (CEA), cancer antigens (CA 27.29, CA 15.3), tissue polypeptide-specific antigen, and tissue polypeptide antigen (TPA). However, these markers lack desired specificity and sensitivity, underscoring the urgent need for alternative simple, accurate, and easy-to-perform screening approaches.Citation9
Cancer cells show distinct metabolic characteristics compared to their normal counterparts. Although incomplete, our understanding of metabolic remodeling in cancer cells has been largely reinforced since the discovery of the so-called Warburg effect.Citation10–Citation13 The realization of quantitative and qualitative analysis of as many metabolites as possible in a certain system (cell, tissue, or biofluid) in a single run gives birth to the science of metabolomics. Since this conception was firstly coined, metabolomics has been widely used in different aspects of life sciences. The benefited fields include, but are not limited to, disease stratification, biomarker discovery, drug side effect evaluation, and unknown gene function elucidation.Citation14–Citation17
Currently prevailing metabolomic techniques mainly include chromatography–mass spectrometry (MS) and nuclear magnetic resonance (NMR) spectroscopy.Citation18 The former employs chromatography to separate different metabolites firstly, and then detects the eluted analytes by the MS system hyphenated to it. This mechanism means that the whole analysis process will need more time, implying that its throughput will be limited to some extent.Citation14 The latter can directly analyze different raw samples, rendering it a high-throughput feature but usually with low sensitivity.Citation19
In BC metabolomic analysis, utilizing gas chromatography–MS system, beta-alanine, 2-hydroyglutarate, glutamate, and xanthine were found increased and glutamine was found decreased in the estrogen receptor-positive BC tissues.Citation20 Using an NMR-based serum profiling tactic, histidine, glycerol, acetoacetate, pyruvate, mannose, phenylalanine, and glutamate were reported to be valuable in discriminating patients with metastatic or localized BC.Citation21 Unlike blood and tissue metabolomics, urine samples had been explored for screening potential metabolite markers aiding BC diagnosis.Citation22
The entry of MS technology into clinical laboratory was earlier than NMR. The maintenance of MS is easier and cheaper than that of NMR in many aspects. MS-based newborn screening (NS) has been applied for decades.Citation23 What should be mentioned specifically is that NS usually employs dried blood spot (DBS) samples collected by heel or finger puncture to simplify the process. Compared to the traditional venous blood samples, the advantages of DBS are that volume of blood taken is much less, they do not need expensive vacuum sample tubes, and they are easy to transport and store. Furthermore, the utilization of direct infusion MS in NS greatly improves the analysis throughput.Citation24
Since the DBS-based MS analysis technique can be used for newborn metabolic disorders screening, it might also be useful in tumor metabolite marker screening. In light with this, a DBS-based metabolomic study was performed by using direct infusion MS/MS analysis of BC and the control samples in this study. The quantified metabolites include 23 amino acids and 26 acylcarnitines ( and ), which are commonly encountered in NS. Some ratios based on the above metabolites were also calculated to enrich the analysis information (). A regression model was then constructed by using parameters that were differentially changed between the two groups. By employing another set of samples, diagnosis ability was evaluated in view of sensitivity and specificity. The purpose of this study was to answer if the DBS-based direct infusion MS technique could be used to facilitate BC screening and diagnosis.
Materials and methods
Sample information
DBS samples from 258 newly diagnosed BC patients and 159 benign mammary gland disease control patients (including 78 healthy people) were collected from The First Affiliated Hospital of Liaoning Medical University. The average ages of BC patients and the controls were 60.4 years (44–80) and 58.7 (42–83), respectively. Statistical analysis showed no age difference between the two groups (P=0.351, Student’s t-test). The study was approved by the Ethics Committee of The First Affiliated Hospital of Liaoning Medical University. Before DBS collection, written informed consents were acquired from the participants. Of the two groups, metabolomic data from randomly selected 207 patients and 127 age-matched controls (~80% of the total samples) were used as training set to establish regression diagnosis model. The remaining 20% samples were used to evaluate the applicability of the constructed model. All the specimens were fasting blood samples.
Chemicals
Acetonitrile (high-performance liquid chromatography-grade) and high-purity water were obtained from Thermo Fisher (Waltham, MA, USA). 1-Butanol and acetyl chloride were commercially acquired from Sigma-Aldrich (St Louis, MO, USA). Isotope-labeled internal standards of 12 amino acids (NSK-A) and eight acylcarnitine (NSK-B) from Cambridge Isotope Laboratories (Tewksbury, MA, USA) were used for absolute quantification purpose. All the standards were mixed and dissolved in 2 mL pure methanol and stored at 4°C. Working solution was prepared through 100-fold dilution for metabolite extraction. Amino acids and carnitines quality control (QC) standards were provided by Chromsystems (Grafelfing, Germany). The QC samples were treated as real samples and processed according to the provided instructions to ensure the analysis stability.
Sample preparation
Except mentioned specifically, all the tests were conducted at room temperature. A 3 mm (diameter) disc was punched from each DBS paper. The discs were placed into the Millipore MultiScreen HV 96-well plate (Millipore, Billerica, MA, USA) for metabolite extraction. Briefly, every 100 μL working solution was added into each well containing a DBS disc. After 20-minute gentle shaking, the plates were centrifuged at 1,500× g for 2 minutes. The filtrate was collected using new flat-bottom 96-well plates. For each plate, four randomly selected blank wells were added with two low-level and two high-level QC control solutions individually. The QC and filtrate solutions were dried by pure nitrogen gas flow at 50°C. Dried samples were derivatized at 65°C for 20 minutes using 60 μL acetyl chloride/1-butanol (10:90, v/v) mixture. The derivatized samples were dried again as mentioned earlier. For metabolomic analysis, each dried sample was dissolved in 100 μL fresh mobile phase solution.
Metabolomic analysis
The direct injection MS metabolomic analysis was conducted by using an AB Sciex 4000 QTrap system (AB Sciex, Framingham, MA, USA). The equipped ion source was electrospray ionization source. All the analytes were scanned under positive mode, and the detailed scan parameters are given in and .
For each run, every 20 μL sample was injected. The mobile phase was 80% acetonitrile aqueous solution. The initial flow rate was 0.2 mL/min. Subsequently, the flow rate was reduced to 0.01 mL/min within 0.08 minute, kept constant until 1.5 minutes, returned to 0.2 mL/min within 0.01 minute, and held constant for another 0.5 minute. The ion spray voltage was 4.5 kV. Curtain gas pressure was set at 20 psi. A 35 psi pressure was applied to ion source gas 1 and gas 2. The auxiliary gas temperature was maintained at 350°C.
Analyst v1.6.0 software (AB Sciex) was used for system control and data collection. ChemoView 2.0.2 (AB Sciex) was used for data preprocessing. Partial least squares-discriminant analysis (PLS-DA) was performed by using SIMCA-P v12.0 (Umetrics, Umeå, Sweden). For establishment of BC diagnosis model, binary logistic regression was conducted by using MINITAB v16.0 (Minitab, State College, PA, USA). The diagnostic ability was evaluated by area under the receiver operating characteristic curve. The remaining 20% samples of each group were used for diagnosis ability appraisal.
Results
The two groups showed distinct metabolomic difference
To ensure the method robustness, the QC sample data were firstly evaluated. Detected values from the QC samples all fell into the recommended ranges (±2 standard deviation), indicating the satisfactory performance of the analysis (data not shown).
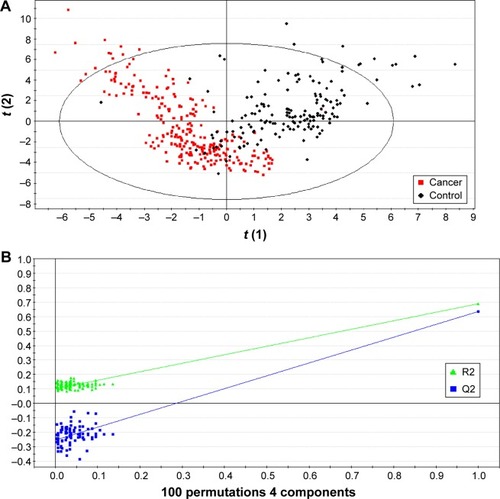
For the real samples, a total of 49 metabolites and 22 ratios were detected and calculated for each sample. Using those parameters, a PLS-DA model was established and it showed a clear separation trend between the BC and control groups (). To test if model overfitting has occurred, a permutation test based on 100 iterations was conducted to appraise fitness of the original model against the randomly permuted models.Citation25 This operation demonstrated that there was less possibility that the overfitting has occurred in the PLS-DA model (). Thus, the analysis implied that there were really some parameters showing distinct levels between the two groups.Citation25
Figure 1 Partial least squares-discriminant analysis of the metabolomic data.
Abbreviation: BC, breast cancer.
Differential parameter selection
Using randomly selected 80% of the BC and control samples, a multivariate analysisCitation26 was carried out to lock potential parameters that had statistic difference between the two groups. It was found that 22 parameters decreased in the BC group and 13 parameters increased in the BC group (). These variables were further reevaluated by t-test, and those of P-values <0.05 were kept. Finally, 21 parameters were verified to be significantly different between the two groups with only C2, C3, and Tyr increased in the BC group ().
Figure 2 SAM analysis results with the false discovery rate set to zero.
Abbreviations: BC, breast cancer; SAM, significance analysis of microarrays.
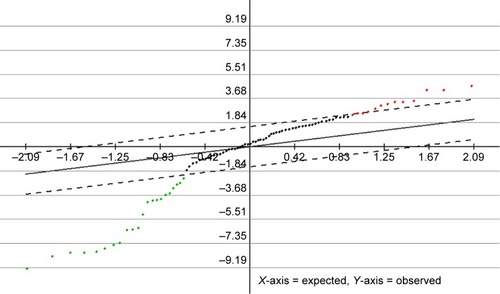
Table 1 Differential parameters between BC and control groups identified using the training set data
Diagnostic regression equation
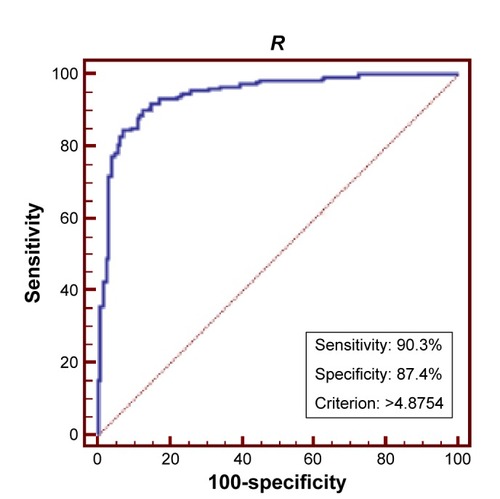
In order to test if the 21 differential parameters could be used for BC diagnosis purpose, a binary logistic regression analysis was conducted. The final equation contained only three amino acids and three calculated ratios, Pip, Asn, Pro, C14:1/C16, Phe/Tyr, and Gly/Ala (). Receiver operating characteristic evaluating the diagnosis model gave a sensitivity and specificity of 90.3% and 87.4%, respectively, when the cutoff was set to 4.8754 (). Area under the curve was 0.944. Further tested by using each remaining 20% samples of each group, the model gave a diagnosis sensitivity of 92.16% and a specificity of 84.38%.
Figure 3 Levels of six metabolites included in the regression model.
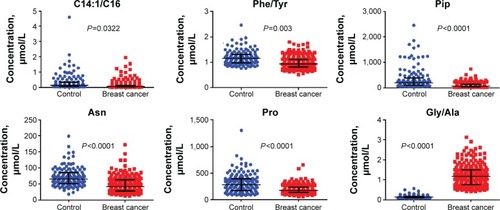
Figure 4 ROC based on the regression model.
Abbreviations: ROC, receiver operating characteristic; R, regression result.
Discussion
One of the major challenges for successful diagnosis and treatment of BC is the lack of reliable molecular predictors. Over the past decades, there have been a rapidly growing number of metabolomic researches aimed at finding biomarkers that could be used to aid BC diagnosis, evaluate response to therapy, and provide treatment guidance.Citation27,Citation28
Although tumor cells show distinct metabolic features, they really share the same metabolic pathways and metabolites with their normal counterparts. Thus, we performed a DBS-based metabolomic assay aimed at amino acids and acylcarnitines, attempted to find valuable clues to help BC diagnosis.
Amino acids are the basic building blocks for nearly all cell types. In the context of cancer metabolomics, many amino acids have been demonstrated to provide valuable clues for studying pathogenesis and to act as potential indicators for diverse malignancies.Citation29 Specific plasma amino acid changes have been reported in patients suffering from breast, lung, and head and neck cancers through metabolomic analysis.Citation30,Citation31
Cascino et al found that Orn, Glu, and Trp increased in the patient plasma.Citation30 Miyagi et al demonstrated that Gln, His, Trp, Tyr, and Phe decreased in the plasma, whereas Gly, Ala, Pro, and Thr increased.Citation32 In this study, only Tyr increased in BC blood, but Cys, Pro, Asn, Pip, Hcy, Trp, Lys, and His decreased (). This discrepancy might be due to the fact that only in this study, the control group included the benign mammary gland diseases and the healthy people simultaneously. Except the disagreement among these studies, Tyr deficiency had been demonstrated to result in BC cell growth arrest.Citation33 Thus, increased blood Tyr might do favor to BC. Of note, blood Tyr is affected by diet. It cannot be de novo synthesized by human body. It is also not easy to exclude the possibility that increased Tyr might be the metabolic adaptation to tumor state.
Except Tyr, there were eight decreased amino acids in the BC blood. It was most likely that such phenomena were the result of excessive consumption of amino acids by BC tissues. As what has been well accepted, tumor cells need more amino acids to sustain their uncontrolled growth.Citation34
Carnitine plays key roles in fatty acids catabolism. It acts as a shutter to bring fatty acids into mitochondria for oxidation. A clear trend in this study was that short-chain carnitine increased in BC plasma (). In a study of myeloma, C2 carnitine was identified as a potential biomarker to indicate disease activity and relapse.Citation35 Increased C2 carnitine was also reported in the urine of patients suffering from hepatocellular carcinoma.Citation36 Also in hepatocellular carcinoma, C3 carnitine was found at high level in cancer tissues.Citation37 Although there was no evidence to correlate short-chain carnitines with BC, they were more likely to be potential markers to indicate the occurrence of many malignancies.
In order to explore the utility of the differentially expressed metabolites, a regression model was constructed by using parameters listed in . The result showed that combined use of six parameters could appropriately differentiate BC from non-BC samples ( and ). Among them, only one ratio, the carnitines C14:1/C16, was included. Increased C14:1/C16 acylcarnitine ratio was closely linked to impaired mitochondria fatty acid beta-oxidation,Citation38 coin ciding with the fact that mitochondrial impairment had been demonstrated in BC cells.Citation39
In the regression model, Pip, Asn, and Pro were the only included free amino acids. Their levels were all decreased. We speculated that the decrease was more likely due to the excessive consumption by tumor cells. Besides the free amino acids, elevated Phe/Tyr and decreased Gly/Ala were closely related to the differentiation of BC and non-BC (). High ratio of Phe/Tyr had been described in malignant histiocytosis and some other cancerous diseases.Citation40,Citation41 As of the decreased Gly/Ala ratio, it was most possible owing to the fact that rapid proliferating tumor cells need more Gly.Citation34
Although the diagnosis specificity (87.4%) of the regression model was not comparable with that of CA 15.3 (93%–95%), CEA (45%–95%), and TPA (~81%), the sensitivity (90.3%) was superior to that of CA 15.3 (44%–64%), CEA (~45%), and TPA (~67%).Citation42,Citation43 Thus, for BC screening purpose, the DBS-based MS technique was a promising tool for early BC discovery.
Conclusion
In summary, a proper diagnostic model with only six blood parameters was established and could be utilized to discriminate BC from non-BC. It could be expected that the DBS-based MS strategy was a promising alternative for BC screening because of its higher sensitivity. Additionally, the whole MS analysis could be completed within few minutes. Unfortunately, the traditional plasma protein tumor markers were not simultaneously measured for these specimens; therefore, the diagnosis ability of combined use of traditional markers and the metabolite markers could not be evaluated. Further analysis should be addressed to the relevant topics to ascertain the exact value of DBS-based MS metabolomic analysis in BC screening and diagnosis.
Acknowledgments
This study was partially supported by the National Natural Science Foundation of China (No 81372695) and by the Department of Science and Technology of Liaoning Province (LNCCC-D27-2015).
Supplementary materials
Table S1 The amino acids detected, corresponding scan modes, equipment settings, and quantification IS used in the study
Table S2 The precursor scan mode-detected carnitines, corresponding equipment settings, and quantification IS used in the study
Table S3 Parameters derived from the quantified metabolites
Disclosure
The authors declare no conflicts of interest in this work.
References
- Abd El-RahmanAAEl-ShafeiSMIvanovaEVCytotoxicity of Trichoderma spp. cultural filtrate against human cervical and breast cancer cell linesAsian Pac J Cancer Prev201415177229723425227819
- JemalABrayFCenterMMGlobal cancer statisticsCA Cancer J Clin2011612699021296855
- ZhangASunHWangXSerum metabolomics as a novel diagnostic approach for disease: a systematic reviewAnal Bioanal Chem201240441239124522648167
- KangESeongMWParkSKThe prevalence and spectrum of BRCA1 and BRCA2 mutations in Korean population: recent update of the Korean Hereditary Breast Cancer (KOHBRA) studyBreast Cancer Res Treat2015151115716825863477
- ShiLRacial differences in breast cancer patternsScience201032959873220595598
- PossematoRMarksKMShaulYDFunctional genomics reveal that the serine synthesis pathway is essential in breast cancerNature2011476736034635021760589
- LuczynskaEHeinze-PaluchowskaSHendrickEComparison between breast MRI and contrast-enhanced spectral mammographyMed Sci Monit2015211358136725963880
- LobergMLousdalMLBretthauerMBenefits and harms of mammography screeningBreast Cancer Res20151716325928287
- AsiagoVMAlvaradoLZShanaiahNEarly detection of recurrent breast cancer using metabolite profilingCancer Res201070218309831820959483
- HanahanDWeinbergRAThe hallmarks of cancerCell20001001577010647931
- LocasaleJWVander HeidenMGCantleyLCRewiring of glycolysis in cancer cell metabolismCell Cycle2010921425321045562
- Vander HeidenMGLocasaleJWSwansonKDEvidence for an alternative glycolytic pathway in rapidly proliferating cellsScience201032959981492149920847263
- LocasaleJWCantleyLCAltered metabolism in cancerBMC Biol201088820598111
- GowdaGADjukovicDOverview of mass spectrometry-based metabolomics: opportunities and challengesMethods Mol Biol2014119831225270919
- WangXXieYGaoPA metabolomics-based method for studying the effect of yfcC gene in Escherichia coli on metabolismAnal Biochem2014451485524513124
- WojakowskaAChekanMWidlakPApplication of metabolomics in thyroid cancer researchInt J Endocrinol2015201525876325972898
- ChahineLMSternMBChen-PlotkinABlood-based biomarkers for Parkinson’s diseaseParkinsonism Relat Disord201420Suppl 1S99S10324262199
- GowdaGAZhangSGuHMetabolomics-based methods for early disease diagnosticsExpert Rev Mol Diagn20088561763318785810
- BathenTFSitterBSjobakkTEMagnetic resonance metabolomics of intact tissue: a biotechnological tool in cancer diagnostics and treatment evaluationCancer Res201070176692669620699363
- BudcziesJBrockmollerSFMullerBMComparative metabolomics of estrogen receptor positive and estrogen receptor negative breast cancer: alterations in glutamine and beta-alanine metabolismJ Proteomics20139427928824125731
- JobardEPontoizeauCBlaiseBJA serum nuclear magnetic resonance-based metabolomic signature of advanced metastatic human breast cancerCancer Lett20143431334124041867
- KimYKooIJungBHMultivariate classification of urine metabolome profiles for breast cancer diagnosisBMC Bioinformatics201011Suppl 2S420406502
- AtkinsonKZuckermanBSharfsteinJMA public health response to emerging technology: expansion of the Massachusetts newborn screening programPublic Health Rep2001116212213111847298
- OmbroneDGiocaliereEForniGExpanded newborn screening by mass spectrometry: new tests, future perspectivesMass Spectrom Rev2016351718425952022
- HuangZLinLGaoYBladder cancer determination via two urinary metabolites: a biomarker pattern approachMol Cell Proteomics20111010M111
- TusherVGTibshiraniRChuGSignificance analysis of microarrays applied to the ionizing radiation responseProc Natl Acad Sci U S A20019895116512111309499
- CurtisCShahSPChinSFThe genomic and transcriptomic architecture of 2,000 breast tumours reveals novel subgroupsNature2012486740334635222522925
- ShahSPRothAGoyaRThe clonal and mutational evolution spectrum of primary triple-negative breast cancersNature2012486740339539922495314
- KimuraTNoguchiYShikataNPlasma amino acid analysis for diagnosis and amino acid-based metabolic networksCurr Opin Clin Nutr Metab Care2009121495319057187
- CascinoAMuscaritoliMCangianoCPlasma amino acid imbalance in patients with lung and breast cancerAnticancer Res19951525075107763031
- KubotaAMeguidMMHitchDCAmino acid profiles correlate diagnostically with organ site in three kinds of malignant tumorsCancer1992699234323481562982
- MiyagiYHigashiyamaMGochiAPlasma free amino acid profiling of five types of cancer patients and its application for early detectionPLoS One201169e2414321915291
- HarvieMNCampbellITHowellAAcceptability and tolerance of a low tyrosine and phenylalanine diet in patients with advanced cancer – a pilot studyJ Hum Nutr Diet200215319320212028515
- JainMNilssonRSharmaSMetabolite profiling identifies a key role for glycine in rapid cancer cell proliferationScience201233660841040104422628656
- LodiATizianiSKhanimFLProton NMR-based metabolite analyses of archived serial paired serum and urine samples from myeloma patients at different stages of disease activity identifies ace-tylcarnitine as a novel marker of active diseasePLoS One201382e5642223431376
- LadepNGDonaACLewisMRDiscovery and validation of urinary metabotypes for the diagnosis of hepatocellular carcinoma in West AfricansHepatology20146041291130124923488
- HuangQTanYYinPMetabolic characterization of hepatocellular carcinoma using nontargeted tissue metabolomicsCancer Res201373164992500223824744
- PooyaSBlaiseSMorenoGMMethyl donor deficiency impairs fatty acid oxidation through PGC-1alpha hypomethylation and decreased ER-alpha, ERR-alpha, and HNF-4alpha in the rat liverJ Hepatol201257234435122521344
- PutignaniLRaffaSPescosolidoRPreliminary evidences on mitochondrial injury and impaired oxidative metabolism in breast cancerMitochondrion201212336336922366096
- NeurauterGGrahmannAVKlieberMSerum phenylalanine concentrations in patients with ovarian carcinoma correlate with concentrations of immune activation markers and of isoprostane-8Cancer Lett2008272114114718701209
- ImashukuSMoriokaYKodoNAbnormal serum phenylalanine-tyrosine ratio and hyperferritinemia in malignant histiocytosisPediatr Hematol Oncol1988542993073152976
- VizcarraELluchACibrianRValue of CA 15.3 in breast cancer and comparison with CEA and TPA: a study of specificity in disease-free follow-up patients and sensitivity in patients at diagnosis of the first metastasisBreast Cancer Res Treat19963732092168825132
- ZhengHLuoRCDiagnostic value of combined detection of TPS, CA153 and CEA in breast cancerDi Yi Jun Yi Da Xue Xue Bao2005251012931294129816234113