
Abstract
Introduction
Immune cell interactions and metabolic changes are crucial in determining the tumor microenvironment and affecting various clinical outcomes. However, the clinical significance of metabolism evolution of immune cell evolution in colorectal cancer (CRC) remains unexplored.
Methods
Single-cell RNA sequencing (scRNA-seq) and bulk RNA sequencing data were acquired from TCGA and GEO datasets. For the analysis of macrophage differentiation trajectories, we employed the R packages Seurat and Monocle. Consensus clustering was further applied to identify the molecular classification. Immunohistochemical results from AOM and AOM/DSS models were used to validate macrophage expression. Subsequently, GSEA, ESTIMATE scores, prognosis, clinical characteristics, mutational burden, immune cell infiltration, and the variance in gene expression among different clusters were compared. We constructed a prognostic model and nomograms based on metabolic gene signatures identified through the MEGENA framework.
Results
We found two heterogeneous groups of M2 macrophages with various clinical outcomes through the evolutionary process. The prognosis of Cluster 2 was poorer. Further investigation showed that Cluster 2 constituted a metabolically active group while Cluster 1 was comparatively metabolically inert. Metabolic variations in M2 macrophages during tumor development are related to tumor prognosis. Additionally, Cluster 2 showed the most pronounced genomic instability and had highly elevated metabolic pathways, notably those associated with the ECM. We identified eight metabolic genes (PRELP, NOTCH3, CNOT6, ASRGL1, SRSF1, PSMD4, RPL31, and CNOT7) to build a predictive model validated in CRC datasets. Then, a nomogram based on the M2 risk score improved predictive performance. Furthermore, our study demonstrated that immune checkpoint inhibitor therapy may benefit patients with low-risk.
Discussion
Our research reveals underlying relationships between metabolic phenotypes and immunological profiles and suggests a unique M2 classification technique for CRC. The identified gene signatures may be key factors linking immunity and tumor metabolism, warranting further investigations.
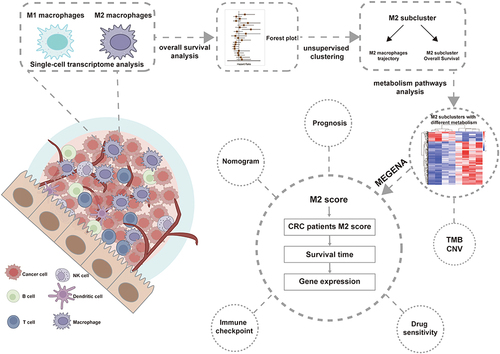
Graphical Abstract
Introduction
In recent decades, colorectal cancer (CRC) has become a primary consideration of cancer-related incidence and mortality around the world.Citation1 The tumor microenvironment (TME) and immune cell interactions play crucial roles in CRC progression and serve as prognostic biomarkers.Citation2 The role of various immune cells in tumor progression has been extensively studied. Immunotherapy has shown a practical therapeutic approach in comprehensive cancer management, showing promising results in multiple types of malignancies.Citation3–6 Specifically, immune checkpoint inhibitors (ICI) have shown efficacy in the treatment of various types of tumors.Citation2 It is worth emphasizing that ICI therapy is affected by the heterogeneity of the TME, which significantly affects tumor occurrence, progression, metastasis, and treatment response,Citation7,Citation8 making it a key determinant.Citation9 High immune cell presence and fully activated anti-tumor immune responses belonging to the “hot tumor” are associated with good therapeutic sensitivity to ICI therapy. Contrarily, a low immune infiltration corresponding to a “cold tumor” frequently denotes impaired treatment response.Citation9
A diverse array of immune cells play multifaceted roles in the progression of tumors. Among these, CD4+ T cells, CD8+ T cells, and macrophages have been the subject of extensive research. Specifically, tumor-associated macrophages (TAMs) have been demonstrated to possess considerable diagnostic and prognostic significance across various types of cancer, such as breast cancer,Citation10 pancreatic cancer,Citation11 hepatocellular cancer,Citation12 and CRC.Citation13 Nevertheless, there is ongoing exploration needed to understand the distribution patterns of TAMs and their phenotypes both within CRC tumors and at the tumor-infiltrating front. It has been suggested that TAMs in tumor tissues can be categorized as either M1 type or M2 type. In the majority of tumors, M2 macrophages are the predominant phenotype among TAMs. Multiple studies demonstrated that the density of macrophages correlated with unfavorable patient prognosis.Citation14 Generally, M1 macrophages are distinguished by their anti-tumor and pro-inflammatory functions, while M2 macrophages display anti-inflammatory and immunosuppressive characteristics.Citation15 Given the widely reported interaction between TAMs and tumors, many recent studies consider TAMs as promising targets for cancer therapy.Citation16 However, there is a contentious debate surrounding the connection between macrophage density and survival in CRC patients, and the role of TAMs in the progression of CRC remains elusive.Citation17 Therefore, we aimed to develop a more effective methodology for appraising the prognostic significance of the M2 subtype in CRC.
The onset and advancement of tumors require metabolic reprogramming in cancer cells. These cells independently adjust their utilization of various metabolic pathways to satisfy increased demands for energy and the production of essential biomolecules, while also reducing oxidative stress. This metabolic adaptation is critical for the proliferation and survival of cancer cells and is considered one of the hallmark features of cancer.Citation18–20 This distinct form of aerobic oxidation, commonly referred to as the Warburg effect, amplifies the proliferation and metastatic potential of cancer cells.Citation21 In recent years, there has been a growing focus on the metabolic alterations of immune cells within the tumor microenvironment.Citation22 The identification of metabolic alterations influencing the intricate dynamics between tumor cells and TAMs constitutes a critical advancement in the quest for innovative therapeutic methods. These approaches aim to specifically address the metabolic reprogramming of immune cells, empowering them to heighten their ability to combat tumors and overcome treatment resistance.Citation23,Citation24
In this study, we conducted an analysis of the bulk RNA and single-cell levels. Subsequently, we developed two heterogeneous clusters from the TCGA-CRC cohort and validated them using two independent external cohorts. These two clusters displayed contrasting expression patterns in crucial metabolic pathways and additionally possessed unique prognostic outcomes, biological traits, genomic alterations, and immune-infiltrated microenvironments. Additionally, we also constructed a prognostic model related to 8 metabolic genes, revealing the correlation between M2 macrophages and metabolic changes in patients with CRC, which may provide new ideas for the treatment of CRC.
Material and Methods
Data Collection and Processing
To obtain a substantial amount of tumor RNA-seq data and clinical information from CRC patients, we gathered data from multiple sources, including the Gene Expression Omnibus (GEO) and The Cancer Genome Atlas (TCGA). In total, we compiled a dataset comprising 976 CRC samples from three distinct cohorts (TCGA, GSE161158,Citation25 and GSE38832).Citation26 Age, gender, clinical information, and tumor characteristics of the CRC cohorts used in this study are summarized in Table S2. Single-cell RNA sequencing data, along with pertinent clinical details from 25 colon cancer samples encompassing 65,994 individual cells, were sourced from GSE166555.Citation27
Single-Cell RNA-Seq Data Analysis
Cell clustering and cell type annotation are accomplished using the R package Seurat. The single-cell RNA-seq data is normalized using the NormalizeData function. Prior to performing cell clustering, the high-dimensional single-cell data are dimensionally reduced using RunPCA. Subsequently, FindNeighbors and FindClusters functions are employed to group cells into different clusters. Two-dimensional visualization of the single-cell data is achieved using t-SNE and UMAP through the RunTSNE and RunUMAP functions, respectively. Finally, cell type annotation is performed using the R package celldex with the Human Primary Cell Atlas reference dataset. Single-cell gene set enrichment analysis is conducted using the irGSEA package, and the enrichment score is calculated using the UCell method.Citation28 Pseudo-time trajectory analysis, which identifies trajectory genes from subclusters, is performed using the Monocle 3 package.
22 Immune Cell Abundance Analysis
In order to assess the distribution of specific cellular components within the immune microenvironment, we employed CIBERSORT to ascertain the relative proportions of 22 different immune cell types. Prognostic analysis was subsequently conducted based on the expression levels of these cells.
Subcluster Identification
ConsensusClusterPlus R package is used to identify the underlying clustering of TCGA patients based on the trajectory genes obtained from single-cell RNA-seq analysis.
Gene-set enrichment analysis and differential expression analysis
Gene-set Enrichment Analysis (GSEA) was performed using the R package clusterProfiler. For the GO gene set enrichment, the gseGO function was utilized with a P-value cutoff of 0.05, focusing on the biological process (BP) ontology. Additionally, KEGG pathway gene enrichment was carried out using the gseKEGG function, also with a P-value cutoff of 0.05. Differential expression analysis was performed using the R package DESeq2 with an adjusted P-value cutoff of 0.05.
Mutation Analysis
Genomic variations, including mutations and copy number variations (CNV), were used to depict the landscape of genetic changes. The maftools R package was employed to visualize somatic variants across different clusters. The primary driver genes in malignant tumors were identified by considering frequently mutated genes (FMGs) with the highest mutation frequencies among the top 20. CNV analysis was also conducted among clusters, leading to the identification of frequently amplified or deleted genes.
Multiscale Embedded Gene Co-Expression Network Analysis (MEGENA)
MEGENA is a method used for the analysis of gene co-expression networks, aiming to uncover the relationships and patterns between genes. The MEGENA was constructed through correlation assessment, construction of a fast planar filtered network (PFN), and multi-scale clustering analysis (MCA).
Construction and Validation of Prognostic Model
The TCGA cohort was used as the training dataset to construct the prognostic model, while the GSE161158 cohort was considered the external verification set. The relationship between candidate cancer genes and patient survival was evaluated in the training set using lasso Cox regression, implemented with the R package glmnet.
Immunotherapy and Chemotherapy Analysis
The association between the prognostic risk score and tumor immune-related genes was assessed using Spearman correlation. A total of 198 drugs for colorectal cancer from the Genomics of Drug Sensitivity in Cancer (GDSC) dataset were selected for the analysis of IC50 (half maximal inhibitory concentration) values within the high-risk and low-risk groups.
Animals Model
AOM Model
Male C57BL/6 mice (8 weeks old) were purchased from Vital River (Beijing, China). After 1 week of acclimation to the respective diets, mice received weekly intraperitoneal injections of 6 doses of azomethane (AOM; 10 mg/kg) to simulate sporadic CRC. Mice were harvested at week 22.Citation29 This study used sodium pentobarbital for anesthesia. Mice were weighed weekly and sacrificed on day 154.
AOM/DSS Model
AOM/DSS has been used to induce colitis-associated cancer (CAC). Each animal was injected intraperitoneally with AOM (10 mg/kg) dissolved in PBS. 7 days later, the animals were provided with drinking water containing 1.5% (w/v) DSS for 7 days, then provided with drinking water for an additional 14 days, and received two additional cycles of 1.5% (w/v) DSS treatment in three-week intervals for a total of 3 cycles.Citation30 Mice were weighed weekly and sacrificed on day 70.
Statistics
All analyses and graphics were generated using GraphPad Prism 9 (GraphPad Software). All data are expressed as mean ± SD. All data on statistical differences were evaluated using the two-tailed Student’s t-test and one-way ANOVA.
Results
M2 Macrophages are Associated with Altered Tumor Immune Infiltration and Poor Prognosis
Single-cell sequencing and Bulk RNA sequencing were used to analyze the heterogeneity of M2 macrophages in CRC patients. To portray the landscape and dynamics of cell subtypes, we conducted single-cell transcriptome analysis coupled with subcluster analysis. We conducted distinct clustering analyses for 36,148 cells originating from tumors and 29,846 cells from non-tumor sources (Figure S1A). Overall, we classified a total of 65,994 cells originating from normal tissue and tumors into 25 clusters (). We successfully classified nine distinct cell types utilizing markers unique to each. Of these, five are associated with the immune system: B cells, natural killer (NK) cells, macrophages, monocytes, and T cells. The remaining four types are non-immune cells, comprising endothelial cells, epithelial cells, smooth muscle cells, and tissue stem cells (). Subsequently, comparisons were made between the changes in the ratios of nine types of cells in normal and tumor tissues, revealing that the proportions of macrophage-monocytes exhibited the most significant alterations among the five immune cell types ().
Figure 1 M2 macrophages are associated with altered tumor immune infiltration and poor prognosis.(A) Single-cell sequencing showed that CRC cells were categorized into 25 major cell subpopulations.(B) The 25 cell subpopulations are mainly categorized into nine cell types and contain five immune cells.(C) Examine the variances in the proportions of nine cell types from tumors and normal tissues in CRC. (D) Results of single-cell genome enrichment analysis showing the involvement of different cell types in the inflammatory response. (E) Infiltration abundance and prognosis of 22 immune cell types were demonstrated by univariate Cox regression analysis of the CRC cohort (GSE161158).(F) Kaplan-Meier survival curves of M0, M1, and M2 macrophage infiltration in CRC patients (GSE161158).(G) Representative images showing CD86 (M1 marker) and CD206 (M2 marker) in tumor tissues of mice induced by AOM (N=6) and AOM/DSS (N=6). *P<0.05; **P<0.0, ***P<0.001.
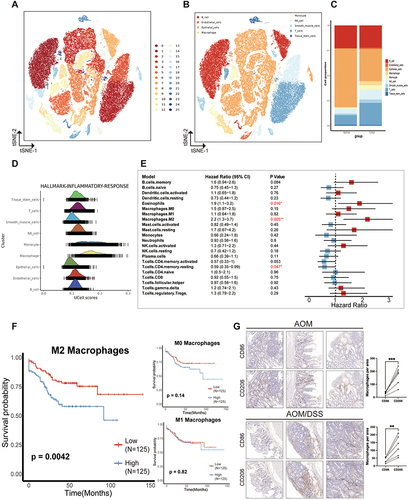
Moreover, the principal five markers for each immune cell cluster were pinpointed (Figure S1B). To delve deeper into the association between the changes in these immune cells within tumor tissues and tumor progression, nine cell types were found to be predominantly involved in the immune response pathway. It was established that macrophages and monocytes are the cell types most significantly engaged in the immune response (), aligning with the observed shifts in cellular proportions. Following this, we conducted a quantitative evaluation of the cellular makeup of the immune infiltration present in the TME. Two publicly accessible CRC cohorts (GSE161158 and GSE38832) were used to assess the prognostic significance of the infiltration of 22 immune cell types, and both cohorts provided overall survival data. A forest plot was used to show the Results of univariate Cox regression analysis. The survival results revealed that the presence of M2 macrophages (HR = 2.2; 95% CI, 1.3–3.7; P = 0.0049) and eosinophils (HR = 1.9; 95% CI, 1.1–3.2; P = 0.016) were correlated with an unfavorable prognosis (GSE161158 dataset). Conversely, the presence of resting CD4 memory T cells (HR = 0.59; 95% CI, 0.35–0.99; P = 0.047) was associated with an improved prognosis (). Similarly, within the GSE38832 dataset, the presence of M2 macrophages (HR = 1.7; 95% CI, 0.2–2.4; P = 0.006), activated NK cells (HR = 1.6; 95% CI, 1.1–2.3; P = 0.012), naïve CD4 T cells (HR = 1.6; 95% CI, 1.1–2.3; P = 0.012) and gamma delta T cells (HR = 1.7; 95% CI, 1.2–2.4; P = 0.006) were linked to an unfavorable prognosis, while the presence of naïve B cells (HR = 0.61; 95% CI, 0.42–0.88; P = 0.008), resting CD4 memory T cells (HR = 0.67; 95% CI, 0.46–0.95; P = 0.026) were associated with a more favorable prognosis (Figure S1C). Kaplan-Meier survival curve analysis revealed that colorectal cancer (CRC) patients exhibiting low M2 macrophage infiltration had significantly improved overall survival (OS) compared to those with high M2 infiltration (; Figure S1D). Conversely, the infiltration levels of M0 and M1 macrophages did not significantly impact the survival outcomes of CRC patients.
An immunohistochemistry assay was employed to explore the role of macrophages in colorectal cancer (CRC) tissues. We specifically assessed the presence of CD86 (a marker of M1 macrophages) and CD206 (a marker of M2 macrophages) in two distinct mouse CRC models: the AOM model and the AOM/DSS model, representative images are depicted in . Our findings reveal that M2 macrophages are more prevalently expressed than M1 macrophages within CRC tumor tissues, with a notable increase in M2 cell content observed in the AOM/DSS model. These observations underscore the variability of M2 macrophages in CRC tumor environments and their association with enhanced inflammatory responses and adverse prognostic outcomes. Consequently, these results suggest that focusing research on M2 macrophages could unveil novel perspectives and therapeutic opportunities in CRC treatment.
Distinctly Different Metabolic Pathways of Two M2 Subclusters
Considering the critical function of macrophages in tumor progression and their complex relationships with tumors, we embarked on a comprehensive analysis and characterization of macrophages at the single-cell level. To explore the evolution of macrophages, we employed tumor-derived macrophages and implemented a series of analytical techniques, such as dimensional reduction, unsupervised clustering, and trajectory analysis. This process led to the identification of three unique macrophage subpopulations (M2-1, M2-2, M2-3), which were subsequently visualized using the UMAP method (). The Monocle algorithm has been employed to track alterations in cell status within the TME as the tumor progresses. Our analysis revealed an increase in the prevalence of M2 cells during the later stages of tumor growth, potentially indicating a poor prognosis (). The transition from M1 macrophages, which enhance immune response, to M2 macrophages, known for suppressing immune function, is a hallmark characteristic of malignant tumors. Genes analyzed through trajectory analysis are utilized to develop prognostic models related to M2 macrophages. The CDF plot showed the distribution of the consensus matrix for various k values, ranging from 2 to 6 (). After careful examination, we concluded that k = 2 was the optimal parameter for separating the training cohort into different subgroups, taking into account criteria such as an adjusted P value < 0.05 and a |log2(FC)| > 1.5 (). We carried out additional investigations into the prognostic importance of these clusters, discovering that Cluster 2 (C2) was associated with a lower OS rate, whereas Cluster 1 (C1) demonstrated a more favorable prognosis (P < 0.05) ().
Figure 2 Distinctly different metabolic pathways of two M2 subclusters. (A and B) Images represent the differentiation trajectory of M2 macrophages in the CRC. (A) using different colors to represent different clusters and (B) using color changes to indicate pseudotime. (C) Depict a plot of the cumulative distribution function (CDF) showing the consensus matrix for each k-value (ranging from 2 to 6) Two clusters are the best choice. (D) Kaplan-Meier survival analysis of M2 subclusters in CRC patients (TCGA dataset). (E) Volcano plots show genes that are differentially expressed in Cluster 1 or Cluster 2. (F) GSEA showing pathways enriched for Cluster 1 (left) and Cluster 2 (right). Cluster 1 was enriched with Metabolic pathways and Cluster 2 was enriched with cell adhesion molecules pathways. (G) GO enrichment analyses for genes up-regulated in cluster 1 and cluster 2. (H) Heatmap showing the results of metabolic pathway-based GSEA analysis in cluster 1 and cluster 2.
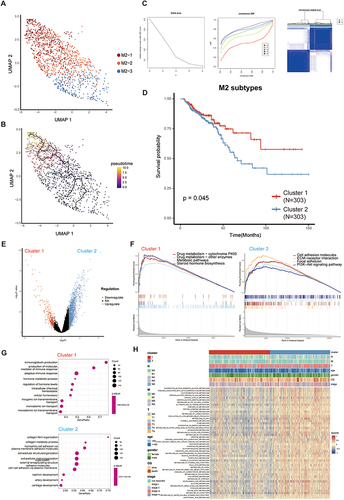
To investigate heterogeneous tumors that play a critical role in which function, respectively, we compared gene expression in C1 and C2 tumor samples and performed pathway enrichment analysis. The results of the differentially expressed genes of the two isoforms are shown in the volcano plot (). Subsequently, we conducted a comparative analysis of the differentially expressed gene sets between C1 and C2, utilizing Gene Ontology (GO) and Kyoto Encyclopedia of Genes and Genomes (KEGG) analyses to elucidate their distinct functional attributes. The KEGG analysis revealed that C1 demonstrated a significantly enhanced enrichment in pathways associated with drug metabolism, steroid hormone biosynthesis, and metabolism compared to C2. Conversely, C2 showed a more pronounced enrichment in pathways pivotal to tumorigenesis and development, including cell adhesion molecules, extracellular matrix (ECM)-receptor interactions, and the PI3K-Akt signaling pathway (Figure S1E, S1F). The analysis conducted by GSEA revealed that there was a notable increase in pathways like metabolic pathways and steroid hormone biosynthesis in C1. Meanwhile, C2 showed a significant upregulation in pathways such as cell adhesion molecules, ECM-receptor interaction, focal adhesion, and the PI3K-Akt signaling pathway. These findings indicate that C2 is associated with the activation of several cancer-related pathways (). The GO analysis revealed that C1 had a higher abundance of pathways related to producing molecular mediators of immune response, adaptive immune response, and hormone metabolic processes (). C2 exhibited enrichment in pathways related to extracellular structure organization, ECM organization, and cell-cell adhesion via plasma-membrane adhesion molecules ().
Since Cluster 1 is closely associated with a variety of metabolic pathways, whereas Cluster 2 is enriched for pathways of cell adhesion, is it possible that the difference in the performance of these two clusters is related to the presence of their different metabolic alterations. To delve into the underlying mechanisms of metabolic reprogramming within these clusters, our investigation centered on 5431 human metabolic genes, which are associated with 72 metabolic pathways as cataloged in the KEGG database (Table S1). We assessed the enrichment scores of these 72 metabolic pathways in each CRC sample within the TCGA cohort using gene-set enrichment analysis (GSEA). This allowed us to unveil the metabolic diversity within the two M2-related clusters ( and Table S1). C1 (50.5% of all tumors, n=305), displayed a hypometabolic pattern across multiple metabolic pathways, including lipid metabolism, vitamin metabolism, and amino metabolism, in comparison to C2, which accounted for 49.5% of all tumors (n=299) (). C2 exhibited significant upregulation in metabolic pathways related to lipids, sphingolipids, steroids, vitamins, and carbohydrates. The heatmap analysis distinctly revealed variations in metabolic pathways between the two M2 subclusters. Subcluster C2 exhibited heightened metabolic activity, whereas its counterpart was associated with a poorer prognostic outcome (). The two clusters demonstrated distinct clinical characteristics, with C2 having a significantly higher pathologic N2 and a more advanced clinical stage (Table S2). Overall, this suggests that targeting the active metabolism within the heterogeneous M2 subtypes in CRC may offer a strategic approach.
High Metabolic Tumor Patterns Play a Role in Promoting the Immunosuppressive Phenotypes in Colorectal Cancer
To further explore whether the metabolic differences seen between the two groups of M2 subtypes are accompanied by other alterations, we analyzed genomic mutations in the M2 subclusters. We investigated and observed the distribution of 20 somatic mutations between the two risk groups. The most frequently mutated genes in the CRC population were APC and TP53. Notably, C2 exhibited a higher mutation burden and altered fraction genome frequencies, while C1 displayed the opposite trend (; Figure S1G, S1H, S1I). The results unveiled a high frequency of TP53 mutation in C2. In light of these findings, we suggest that the upregulation of ECM-related pathways may be accompanied by the upregulation of metabolic pathways. Consequently, there is a potential linkage between the biological process of macrophage metabolism and tumor ECM composition ( and ; Figure S1G).
Figure 3 High metabolic tumor patterns play a role in promoting the immunosuppressive phenotypes in colorectal cancer. (A) The waterfall plot shows the top 20 most frequently mutated genes in Cluster 1. (B) The waterfall plot shows the top 20 most frequently mutated genes in Cluster 2. (C) Percentage abundance of 22 immune cells in two M2 subclusters. (D) Heatmap and box plots illustrating 22 immune cell abundance, ESTIMATE scores, immune scores, and stromal scores for the two M2 subclusters. (E) The expression of MHC-I molecules in the two M2 subclusters. (F and G) The expression of co-stimulatory and co-inhibitory molecules in the two M2 subclusters. ns, no significance; *P<0.05; **P<0.01; ***P<0.001; ****P<0.0001.
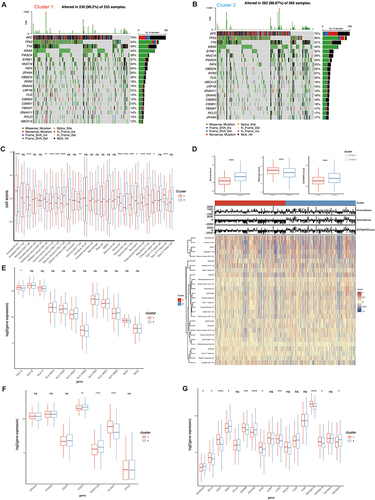
To explore the relationship between distinct metabolic and immune signatures within M2 subclusters, we assess immune infiltration and the expression of immune checkpoint-related genes. Significantly, C1 showed notably higher proportions of infiltrating activated B cells, activated CD8 T cells, CD56 bright natural killer cells, CD56 dim natural killer cells, central memory CD4 T cells, central memory CD8 T cells, effector memory CD4 T cells, effector memory CD8 T cells, neutrophils, and Th17 helper cells compared to C2 ( and ). Conversely, C2 displayed significantly higher proportions of infiltrating gamma delta T cells, macrophages, monocytes, natural killer T cells, plasmacytoid dendritic cells, regulatory T cells, and T follicular helper cells. Previous studies have reported a correlation between high infiltration of gamma delta T cells and poor prognosis in CRC patients,Citation31 although the underlying mechanisms remain unclear. Additionally, the correlation between macrophages and gamma delta T cells has been documented.Citation32 In contrast, C1 exhibited higher stemness scores, while C2 showed higher stromal and ESTIMATE scores (). We performed further analysis to confirm the results. Our study of immune-related genes revealed that the expression of MHC-I-related genes was significantly higher in C2, as shown in . Notably, the first signaling mediated by MHC peptide complexes and the co-stimulated second signaling were essential for anti-tumor immune activation. Therefore, we also investigated the expression levels of co-stimulatory/inhibitory molecules. The results indicate that within the context of CRC, inhibitory ligands are notably overexpressed in C2. In contrast, inhibitory receptors found on immune cells that have infiltrated the tumor are significantly more abundant in C2 compared to C1. Specifically, the following receptors, ADORA2A, CD40, CTLA4, HAVCR2, IL2RA, PDCD1 (PD-1), TIGIT (CD155), TLR4 (toll-like receptor 4), TNFRSF18 (GITR), TNFRSF4 (OX40), and TNFRSF9 (4–1BB), exhibit this pattern of elevated expression ( and ). These findings collectively suggest that CRC creates an immunosuppressive microenvironment, characterized by a prevalence of inhibitory signaling. Consequently, this immunosuppressive environment hinders the infiltration of immune cells into the tumor, potentially contributing to the challenges of mounting an effective immune response against CRC.
Constructing a Prognostic Model Through the Convergence of Metabolic-DEGs and MEGENA Modules
In order to better understand the differences within the M2 subclusters of CRC and identify important metabolic genes with prognostic value, we conducted a differential expression analysis for both M2 subclusters. This analysis uncovered a group of 1218 genes that showed varying levels of expression (Figure S2A). Following this, we employed the hierarchical clustering technique MEGENA to detect 297 target modules with the metabolism-related gene network of CRC (Figure S2B). By analyzing two sets of results, we have identified 101 metabolic genes that have the potential to predict overall survival. Out of these 101 genes, 13 genes have shown significant prognostic value through univariate COX analysis, as depicted in and .
Figure 4 Construction of 8-gene signature prognosis model in TCGA. (A) Venn diagram showing overlap genes of Differential expression genes and MEGENA. (B) Univariate COX analysis results for 13 overlapped genes in CRC patients. (C) Lasso regression of independent factors. (D) Risk profiles of high-risk and low-risk patients for the 8-gene signature prognostic model (TCGA dataset). (E) Scatterplot analysis of risk-survival in high- and low-risk patients with the 8-gene signature prognostic model (TCGA dataset). (F) Heatmap of metabolic gene expression profiles of 8 metabolic genes (TCGA dataset). (G) Kaplan-Meier survival analysis of 8-gene signature prognostic model (TCGA dataset). (H) ROC curve analysis demonstrates the prognostic performance of the 8-gene signature prognostic model in predicting 1-3-5-year survival times in TCGA. *P<0.05; **P<0.01; ***P<0.001.
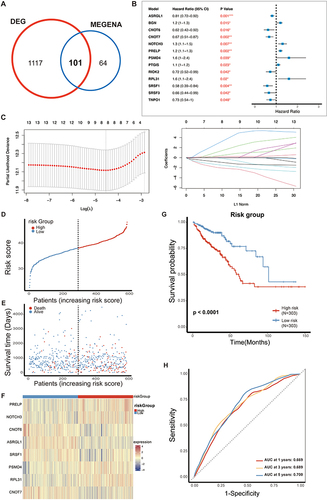
We established the prognosis model using the TCGA cohort and subsequently validated it using the GEO database (GSE161158). To efficiently sift through these genes, we initially conducted a univariate Cox analysis. This analysis led to the identification of 13 genes associated with prognosis (). For further filtering, lasso regression analysis was applied to identify 8 genes (PRELP, NOTCH3, CNOT6, ASRGL1, SRSF1, PSMD4, RPL31, and CNOT7) for constructing the prognosis model ().
Subsequently, we utilized these 8 metabolic genes to construct a prognosis model for CRC patients. Using the median point as the cutoff, we stratified patients in the TCGA into two distinct categories: the high-risk group and the low-risk group. The gene expression profiles showed the following patterns: PRELP, NOTCH3, PSMD4, and RPL31 displayed elevated expression in the high-risk group (HR > 1). In contrast, CNOT6, ASRGL1, SRSF1, and CNOT7 exhibited higher expression levels in the low-risk group (HR < 1), as depicted in . We generated KM survival curves to evaluate the survival rate between the high-risk and low-risk groups (). Notably, the Area Under the Curve (AUC) values for 1-year, 3-year, and 5-year OS prediction in the Receiver Operating Characteristic (ROC) curve all exceeded 0.65 (), indicating a strong performance in predicting survival. Finally, we conducted similar analyses on the GEO dataset, consistently reaching the same Conclusions regarding the importance of the 8 genes (Figure S2C–S2F). Importantly, the 1-year and 3-year AUC values of the ROC curve exceeded 0.6 (Figure S2G), demonstrating the broad potential applicability of this prognosis model for predicting CRC patient outcomes.
Nomogram Was Constructed Based on the 8-Metabolic Genes Model and Determined That the Two Groups Differed in the Sensitivity of Chemotherapy
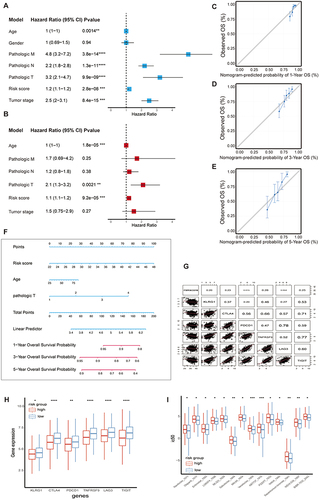
In our analysis, we integrated clinicopathologic characteristics including age, gender, pathological TNM, pathological stage, and risk score for univariate Cox analysis to observe whether these factors could serve as independent prognostic factors. Notably, we observed that risk score, pathologic T, and age were independent prognostic factors (), while other factors were excluded. Based on the results of the univariate analyses, we then incorporated these specific indicators into a multivariate Cox model to analyze whether these factors were influenced by other factors, and ultimately found that age, pathological T, and risk score were the 3 factors that could be used in the next step of the calculation (). Following this, we proceeded to create nomograms, along with 1-year, 3-year, and 5-year calibration curves, utilizing the independent prognostic factors, all of which displayed P-values below 0.05 (). The ultimate predictors incorporated into the nomograms comprised the risk score, pathologic T, and age (). Furthermore, the C-index was determined to be 0.8, indicating excellent discriminative ability of the nomogram prediction model. Consistent with the results obtained with the risk score, the inhibitory immune checkpoint molecules were higher expressed in the high-risk group (worse prognosis) relative to the low-risk group (better prognosis), and we subsequently expanded our study of the expression patterns of these molecules in both the high- and low-risk groups. Indeed, there was a consistent trend where the expression levels of immune checkpoint molecules, specifically LAG3, TIGIT, CTLA4, PDCD1, and HAVCR2, were notably higher in the low-risk group ( and ). Additionally, we conducted an exploration to identify potential chemotherapy drugs that might be sensitive in the high-risk group. This investigation led us to uncover 14 drugs exhibiting negative correlation coefficients, including Olaparib, Sabutoclax, Venetoclax, ABT737 (). These findings strongly indicate the potential efficacy of single drugs or combination treatments, particularly when used in conjunction with immune checkpoint inhibitors, for managing high-risk CRC patients with promising anti-tumor effects.
Figure 5 A nomogram was constructed based on 8 metabolic genes and determined that the two groups differed in the sensitivity of chemotherapy. (A) Univariate COX analysis results for clinical characteristics and risk score. (B) Multivariate COX analysis results for significant clinical characteristics and risk score. (C, D, E) Calibration curves for the nomograms predicting 1-3-5-year OS of CRC patients. (F) Nomogram was conducted of CRC patients with risk scores. (G) Correlation between risk scores and the immune checkpoint molecules. (H) Multiple immune checkpoint molecules of CRC grouped by risk score. (I) The sensitivity to chemotherapies of CRC grouped by risk score. *P<0.05; **P<0.01; ***P<0.001; ****P<0.0001.
Discussion
The heterogeneity and poor prognosis associated with CRC have been well-established.Citation33 With the advancement of guidelines and extensive research, various treatment options are now available for CRC patients. However, even within the same clinical stage, the standardized treatment approaches still exhibit heterogeneity. The diversity in CRC can be explained by the lack of attention given to unique molecular traits in patients. Due to the varying clinical results observed, it is important to study the genomic features of CRC patients and create a new system for classifying them based on molecular characteristics.
Our study utilized advanced technologies to explore the idea of tumor heterogeneity. We performed single-cell RNA-seq analysis to understand the behavior of immune cell subsets and M2 macrophages in the TME. Prior research has highlighted the close relationship between the TME and tumor heterogeneity, highlighting the crucial role of macrophages in regulating immunity.Citation34 M1 macrophages are associated with an anti-tumor role, while M2 macrophages are implicated in tumor cell development. A previous study found that inhibitors targeting MAT2A regulated methionine metabolism in TAMs and tumor cells, revealing that methionine metabolism regulates TAMs polarization in gastric cancer.Citation35 Moreover, both macrophage subtypes have prognostic implications and influence the response to immunotherapy. Our findings demonstrate the activation of immune-inflammatory pathways within immune cell clusters, and we observed a progressive increase in M2 macrophages during tumor progression. We propose that genes along the evolutionary trajectory of M2 macrophages may serve as important prognostic markers and contribute to the heterogeneity of clinical outcomes, thus forming a solid foundation for constructing a molecular classification system.
To uncover heterogeneous molecular clusters, we utilized the CDF algorithm and successfully identified two well-defined clusters within the TCGA-CRC cohort. This clustering was substantiated by multiple evaluation metrics, ensuring its robustness. Upon further examination of the prognostic implications, it became evident that Cluster 2 (C2) displayed an unfavorable prognosis and had the potential to serve as an independent prognostic indicator. In addition, we used GSEA analysis to investigate metabolic pathways in these two M2 clusters. This analysis unveiled an elevated expression of metabolic pathways within the C2. Consequently, the two subclusters of M2 could be further subdivided into a high-metabolism group and a low-metabolism group. In general, M1 macrophages predominantly utilize aerobic glycolysis, while M2 macrophages depend on oxidative metabolism. Metabolic investigations have shed light on the fact that the metabolic profile of TAMs and the presence of specific metabolites in the TME play critical roles in governing the function and polarization of TAMs. Nonetheless, the exact impacts of metabolic reprogramming on both tumors and TAMs remain to be fully comprehended and are still subject to further exploration.Citation22,Citation36
Furthermore, our study aimed to characterize the underlying biology of these two clusters. The subgroup identified as C2, characterized by a high metabolic phenotype, exhibited poor prognosis, aggressiveness, high mutational load, and extensive immune infiltration. The results of the GSEA enrichment analysis concurred in demonstrating that C1 was predominantly linked to immune response pathways, signifying its strong affiliation with immune-related processes. Conversely, C2 exhibited substantial enrichment in pathways related to the ECM, underscoring its involvement in ECM-associated biological activities. Additionally, the two clusters exhibited distinct genomic signatures. Somatic mutations and CNVs emphasized that C2 demonstrated pronounced genomic instability. Prior research has consistently demonstrated that patients with TP53 mutations tend to have a higher likelihood of experiencing immune evasion and a less favorable prognosis.Citation37 In line with these established findings, our study illuminated that C2, which was distinguished by the highest TP53 mutation burden, indeed experienced a poorer prognosis. In contrast, patients within C1 were more inclined to display anti-tumor activity, derive benefits from immunotherapy, and showcase favorable clinical outcomes, all while maintaining stable genomic features. As previously discussed, C2 is distinguished by heightened levels of cell adhesion molecules, significant genomic instability, a pronounced malignant phenotype, and an unfavorable prognosis. Consequently, it necessitates meticulous attention to enhance patient prognosis and therapeutic effectiveness. In clinical settings, it’s important to recognize that certain patients may respond favorably to specific drug treatments, while others might experience adverse drug effects.
To identify key genes that shape the distinct metabolic patterns of M2 macrophage subclusters in CRC, we intersected DEGs between the two M2 clusters with MEGENA results to identify key molecules in the CRC that are associated with M2 macrophages and linked to metabolic alterations. Eight important overlapped genes were identified: PRELP, NOTCH3, CNOT6, ASRGL1, SRSF1, PSMD4, RPL31, and CNOT7. We proceeded to construct a prognostic model and subsequently validated its predictive performance both internally and externally with 8 genes, making use of the TCGA-CRC database. Furthermore, we extended our analysis by integrating clinical factors that exhibited significant prognostic value, leading to the successful creation of a nomogram. This nomogram demonstrated a relatively strong discriminatory capability.
Within our prognosis model, it was observed that four genes, namely PRELP, ASRGL1, CNOT6, and CNOT7. A study has shown that the loss of PRELP reduces cell-cell adhesion and facilitates epithelial-mesenchymal transition (EMT).Citation38 ASRGL1 plays a protective role in endometrial carcinoma by participating in asparagine catabolism via L-aspartic acid.Citation39 CNOT6 and CNOT7 are members of the CCR4-NOT transcription complex.Citation40 Notably, the knockdown of CNOT7 has been found to have inhibitory effects on cell proliferation, reduce cell migration and invasion abilities in cancer, and simultaneously promote cell apoptosis and autophagy. These findings suggest that targeting CCR4-NOT, particularly CNOT7, could hold promise as a therapeutic approach in certain disease scenarios.Citation41,Citation42 The other four genes within the prognosis model, which are associated with the regulation of metabolism, demonstrated diagnostic potential for distinguishing between normal and colorectal tumor tissues. These genes are NOTCH3, SRSF1, PSMD4, and RPL31. Overexpression of NOTCH3 is positively associated with poor clinical outcomes.Citation43,Citation44 The overexpression of NOTCH3 has been positively linked to poor clinical outcomes. SRSF1 impedes the progression of hepatocellular carcinoma (HCC) by inhibiting the ERK signaling pathway.Citation45,Citation46 On the other hand, PSMD4 has been observed to increase autophagy, enhance antigen presentation, and activate CD4+ T and natural killer cells when inhibited.Citation47 RPL31 was found to restrict CRC cell proliferation, migration, and colony formation while enhancing cell apoptosis when its expression was knocked down.Citation48
Our research has identified two distinct clusters and suggested personalized treatment approaches. However, it is crucial to recognize certain limitations. Primarily, all the samples in this study are retrospective, underscoring the importance of prospective studies to authenticate and corroborate the outcomes obtained in this investigation. Secondly, it is imperative to conduct additional research utilizing multicenter large sample datasets that include eligible patients who have undergone immunotherapy. This is crucial for a comprehensive evaluation of clinical efficacy. Thirdly, further investigation and exploration of potential therapeutic drugs through more research is necessary to translate research findings into tangible clinical applications for patient benefit.
Conclusions
Our study has uncovered tumor metabolism and immune cell populations as sources of intertumoral and intratumoral heterogeneity in CRC. Notably, we have linked the M2 macrophage subtype to an unfavorable prognosis in patients with CRC, showcasing remarkable metabolic disparities in this context. Through differential gene analysis and MEGENA, we have identified eight genes highly correlated with the M2 subtype and metabolism. Based on these findings, we have formulated a risk model to forecast the response to immunotherapy by employing a gene signature associated with M2 macrophages. We aspire that the collaborative analysis of single-cell RNA-seq and bulk RNA-seq data can advance a new era of colorectal cancer immunotherapy and precision therapy.
Ethics Approval and Consent to Participate
Approval of human data: The public data of CRC patients used in the present study were approved by the Ethics Committee of Zhongnan Hospital of Wuhan University (Approval number: 2024062K). Approval of animal data: All animal experiments were approved by the Experimental Animal Welfare Ethics Committee, Zhongnan Hospital of Wuhan University (Wuhan, China) and performed in compliance with the Guidelines of Wuhan University for the Care and Use of Laboratory Animals (approval number: WP20230250).
Author Contributions
All authors made a significant contribution to the work reported, whether that is in the conception, study design, execution, acquisition of data, analysis and interpretation, or in all these areas; took part in drafting, revising or critically reviewing the article; gave final approval of the version to be published; have agreed on the journal to which the article has been submitted; and agree to be accountable for all aspects of the work.
Disclosure
All authors declare that they have no conflicts of interest in this work.
Acknowledgments
Fengxing Huang, Youwei Wang and Yu Shao are co-first authors for this study. Qiu Zhao and are Lan Liu co-correspondence authors for this study.
Data Sharing Statement
Publicly available datasets were analyzed in this study; these can be found in the UCSC Xena browser (https://xenabrowser.net/datapages), Gene Expression Omnibus database (https://www.ncbi.nlm.nih.gov/geo), and GSEA database (https://www.gsea-msigdb.org/gsea/index.jsp).
Additional information
Funding
References
- Siegel RL, Wagle NS, Cercek A, Smith RA, Jemal A. Colorectal cancer statistics, 2023. CA a Cancer J Clinicians. 2023;73(3):233–254. doi:10.3322/caac.21772
- Mazzoccoli G. Colorectal cancer prognosis and PPARd/b expression in the tumor microenvironment. J Gastroenterol. 2014;49(3):564–565. doi:10.1007/s00535-013-0913-z
- Lepski G, Bergami-Santos PC, Pinho MP, et al. Adjuvant vaccination with allogenic dendritic cells significantly prolongs overall survival in high-grade gliomas: results of a phase II Trial. Cancers. 2023;15(4):1239. doi:10.3390/cancers15041239
- Bloemendal M, Bol KF, Boudewijns S, et al. Immunological responses to adjuvant vaccination with combined CD1c + myeloid and plasmacytoid dendritic cells in stage III melanoma patients. OncoImmunology. 2022;11(1):2015113. doi:10.1080/2162402X.2021.2015113
- Kang Y-K, Chen L-T, Ryu M-H, et al. Nivolumab plus chemotherapy versus placebo plus chemotherapy in patients with HER2-negative, untreated, unresectable advanced or recurrent gastric or gastro-oesophageal junction cancer (ATTRACTION-4): a randomised, multicentre, double-blind, placebo-controlled, Phase 3 trial. Lancet Oncol. 2022;23(2):234–247. doi:10.1016/S1470-2045(21)00692-6
- Janjigian YY, Shitara K, Moehler M, et al. First-line nivolumab plus chemotherapy versus chemotherapy alone for advanced gastric, gastro-oesophageal junction, and oesophageal adenocarcinoma (CheckMate 649): a randomised, open-label, phase 3 trial. Lancet. 2021;398(10294):27–40. doi:10.1016/S0140-6736(21)00797-2
- Quail DF, Joyce JA. Microenvironmental regulation of tumor progression and metastasis. Nat Med. 2013;19(11):1423–1437. doi:10.1038/nm.3394
- Jin M-Z, Jin W-L. The updated landscape of tumor microenvironment and drug repurposing. Signal Transduct Target Ther. 2020;5(1):166. doi:10.1038/s41392-020-00280-x
- Duan Q, Zhang H, Zheng J, Zhang L. Turning cold into hot: firing up the tumor microenvironment. Trends Cancer. 2020;6(7):605–618. doi:10.1016/j.trecan.2020.02.022
- Zhao X, Qu J, Sun Y, et al. Prognostic significance of tumor-associated macrophages in breast cancer: a meta-analysis of the literature. Oncotarget. 2017;8(18):30576–30586. doi:10.18632/oncotarget.15736
- Yu M, Guan R, Hong W, et al. Prognostic value of tumor-associated macrophages in pancreatic cancer: a meta-analysis. Cancer Manag Res. 2019;11:4041–4058. doi:10.2147/CMAR.S196951
- Zhang J, Chang L, Zhang X, Zhou Z, Gao Y. Meta-analysis of the prognostic and clinical value of tumor-associated macrophages in hepatocellular carcinoma. J Invest Surg. 2021;34(3):297–306. doi:10.1080/08941939.2019.1631411
- Yang Z, Zhang M, Peng R, et al. The prognostic and clinicopathological value of tumor-associated macrophages in patients with colorectal cancer: a systematic review and meta-analysis. Int J Colorectal Dis. 2020;35(9):1651–1661. doi:10.1007/s00384-020-03686-9
- Fakih M, Ouyang C, Wang C, et al. Immune overdrive signature in colorectal tumor subset predicts poor clinical outcome. J Clin Invest. 2019;129(10):4464–4476. doi:10.1172/JCI127046
- Martinez FO, Helming L, Gordon S. Alternative activation of macrophages: an immunologic functional perspective. Annu Rev Immunol. 2009;27(1):451–483. doi:10.1146/annurev.immunol.021908.132532
- Han Y, Sun J, Yang Y, et al. TMP195 exerts antitumor effects on colorectal cancer by promoting m1 macrophages polarization. Int J Biol Sci. 2022;18(15):5653–5666. doi:10.7150/ijbs.73264
- Wang H, Tian T, Zhang J. Tumor-associated macrophages (TAMs) in colorectal cancer (CRC): from mechanism to therapy and prognosis. Int J Mol Sci. 2021;22(16):8470. doi:10.3390/ijms22168470
- Hanahan D, Weinberg RA. Hallmarks of cancer: the next generation. Cell. 2011;144(5):646–674. doi:10.1016/j.cell.2011.02.013
- Pavlova NN, Zhu J, Thompson CB. The hallmarks of cancer metabolism: still emerging. Cell Metab. 2022;34(3):355–377. doi:10.1016/j.cmet.2022.01.007
- Tennant DA, Durán RV, Gottlieb E. Targeting metabolic transformation for cancer therapy. Nat Rev Cancer. 2010;10:267–277.
- Oliveira PF, Martins AD, Moreira AC, Cheng CY, Alves MG. The Warburg effect revisited--lesson from the Sertoli cell. Med Res Rev. 2015;35(1):126–151. doi:10.1002/med.21325
- Li M, et al. Metabolism, metabolites, and macrophages in cancer. J Hematol Oncol. 2023;16(1):80. doi:10.1186/s13045-023-01478-6
- Liu S, Shen YY, Yin LY, Liu J, Zu X. Lipid metabolic regulatory crosstalk between cancer cells and tumor-associated macrophages. DNA Cell Biol. 2023;42(8):445–455. doi:10.1089/dna.2023.0071
- Yu L, et al. Macrophage-to-endothelial cell crosstalk by the cholesterol metabolite 27HC promotes atherosclerosis in male mice. Nat Commun. 2023;14(1):4101. doi:10.1038/s41467-023-39586-z
- Szeglin BC, Wu C, Marco MR, et al. A SMAD4 -modulated gene profile predicts disease-free survival in stage II and III colorectal cancer. Cancer Rep. 2022;5(1):e1423. doi:10.1002/cnr2.1423
- Tripathi MK, et al. Nuclear factor of activated T-cell activity is associated with metastatic capacity in colon cancer. Cancer Res. 2014;74(23):6947–6957. doi:10.1158/0008-5472.CAN-14-1592
- Uhlitz F, Bischoff P, Peidli S, et al. Mitogen-activated protein kinase activity drives cell trajectories in colorectal cancer. EMBO Mol Med. 2021;13(10):e14123. doi:10.15252/emmm.202114123
- Andreatta M, Carmona SJ. UCell: robust and scalable single-cell gene signature scoring. Comput Struct Biotechnol J. 2021;19:3796–3798. doi:10.1016/j.csbj.2021.06.043
- Yang J, Wei H, Zhou Y, et al. High-fat diet promotes colorectal tumorigenesis through modulating gut microbiota and metabolites. Gastroenterology. 2022;162(1):135–149.e2. doi:10.1053/j.gastro.2021.08.041
- Jin B-R, Chung K-S, Lee M, An H-J. High-fat diet propelled AOM/DSS-induced colitis-associated colon cancer alleviated by administration of aster glehni via STAT3 signaling pathway. Biology. 2020;9(2):24. doi:10.3390/biology9020024
- Bossard C, Bézieau S, Matysiak‐Budnik T, et al. HLA-E/β2 microglobulin overexpression in colorectal cancer is associated with recruitment of inhibitory immune cells and tumor progression. Int J Cancer. 2012;131(4):855–863. doi:10.1002/ijc.26453
- Tirier SM, Mallm J-P, Steiger S, et al. Subclone-specific microenvironmental impact and drug response in refractory multiple myeloma revealed by single-cell transcriptomics. Nat Commun. 2021;12(1):6960. doi:10.1038/s41467-021-26951-z
- Guo L, Wang Y, Yang W, et al. Molecular profiling provides clinical insights into targeted and immunotherapies as well as colorectal cancer. Prog Gastro. 2023;165(2):414–428.e7. doi:10.1053/j.gastro.2023.04.029
- Xiao L, Wang Q, Peng H. Tumor-associated macrophages: new insights on their metabolic regulation and their influence in cancer immunotherapy. Front Immunol. 2023;14:1157291. doi:10.3389/fimmu.2023.1157291
- Zhang Y, Yang H, Zhao J, et al. Activation of MAT2A-RIP1 signaling axis reprograms monocytes in gastric cancer. J Immunother Cancer. 2021;9(2):e001364. doi:10.1136/jitc-2020-001364
- Ngambenjawong C, Gustafson HH, Pun SH. Progress in tumor-associated macrophage (TAM)-targeted therapeutics. Adv Drug Deliv Rev. 2017;114:206–221. doi:10.1016/j.addr.2017.04.010
- Z H, et al. CAR T-Cell therapy for the management of mantle cell lymphoma. Mol Cancer. 2023;22:1.
- J H, et al. PRELP regulates cell-cell adhesion and EMT and inhibits retinoblastoma progression. Cancers. 2022;14:1.
- T F, et al. Asparaginase-like protein 1 expression in curettage independently predicts lymph node metastasis in endometrial carcinoma: a multicentre study. BJOG. 2018;125:1.
- M M, et al. Hepatic posttranscriptional network comprised of CCR4-NOT deadenylase and FGF21 maintains systemic metabolic homeostasis. Proc Natl Acad Sci USA. 2019;116:1.
- CNOT7 modulates biological functions of ovarian cancer cells via AKT signaling pathway - PubMed. https://pubmed.ncbi.nlm.nih.gov/33412213/.Accessed July 3 2024.
- Y M, J L, B F, L S. MicroRNA-126-5p inhibits the migration of breast cancer cells by directly targeting CNOT7. Technol Cancer Res Treat. 2020;19:1.
- L L, et al. Enhancer remodeling activates NOTCH3 signaling to confer chemoresistance in advanced nasopharyngeal carcinoma. Cell Death Dis. 2023;14:1.
- K S, et al. LIN28B promotes cell invasion and colorectal cancer metastasis via CLDN1 and NOTCH3. JCI Insight. 2023;8:1.
- Feng Z, Ke S, Wang C, et al. RNF125 attenuates hepatocellular carcinoma progression by downregulating SRSF1-ERK pathway. Oncogene. 2023;42(24):2017–2030. doi:10.1038/s41388-023-02710-w
- Arif W, Mathur B, Saikali MF, et al. Splicing factor SRSF1 deficiency in the liver triggers NASH-like pathology and cell death. Nat Commun. 2023;14(1):551. doi:10.1038/s41467-023-35932-3
- Du T, Song Y, Ray A, et al. Ubiquitin receptor PSMD4/Rpn10 is a novel therapeutic target in multiple myeloma. Blood. 2023;141(21):2599–2614. doi:10.1182/blood.2022017897
- Sharen G, Li X, Sun J, et al. Silencing eL31 suppresses the progression of colorectal cancer via targeting DEPDC1. J Transl Med. 2022;20(1):493. doi:10.1186/s12967-022-03663-6