
Abstract
Background
Obesity is reaching epidemic proportions in the developed world. The biosynthesis and degradation of human glycoproteins take place at the highest level in the liver. However, the association between glycosylation and the factors affecting obesity and metabolism-associated steatohepatitis (MASH) is still unclear.
Materials and Methods
Gene expression data of liver samples from obese patients were retrieved from GSE83452 and GSE89632 databases. Difference analysis and machine learning were used to identify hub genes involved in glycosylation and associated with the response of weight loss treatment. A total of 7 glycosylation-related hub genes were identified and then subjected to correlation analysis, immune cells infiltration analysis and ROC (Receiver Operating Characteristic) analysis. We also evaluated the potential function of 7 hub genes in obesity patients. MASH mice were used to validate the glycosylation-related hub genes.
Results
A total of 25 overlapped glycosylation-related genes were identified by DEGs analysis. ACER2, STX17, ARF5, GPC4, ENTPD5, NANP, and DPY19L2 were identified as hub genes. Among these hub genes, ACER2, STX17, ARF5, and ENTPD5 were also differential expressed in MASH patients. ENTPD5 showed increased transcription in obese MASH mice.
Conclusion
The current study identified seven glycosylation-related genes, ACER2, STX17, ARF5, GPC4, ENTPD5, NANP, and DPY19L2, that might play key roles in the development of obesity. ENTPD5 might play a key role in the development of MASH. These findings provide fresh perspectives for expanding the investigation of obesity and MASH.
Keywords:
Introduction
Obesity-induced diseases are important issues threatening human health.Citation1 In the past 20 years, the economic development and urbanization of many countries have led to sedentary lifestyles and over-nutrition eating habits, laying the groundwork for the epidemic of obesity.Citation2 Diet control and bariatric surgery are the main means to reduce weight. However, not everyone will benefit from these treatments. Thus, we need to explore the key factors that affect the efficiency of weight loss treatments.
Glycosylation is a diverse protein post-translational modification.Citation3 During inflammation, glycosylation regulates protein function in various complex ways, thereby playing a key role in promoting inflammation.Citation4 In recent years, proton nuclear magnetic resonance (1H-NMR) spectroscopy has become increasingly available, enabling compounds such as metabolites, lipoproteins, and glycoproteins to be detected. This technique has been used to study 5 glycoprotein variables: GlycA, GlycB, and GlycF, and the height-to-width ratio (H/W) of GlycA and GlycB. It has been documented that GlycA, a marker of inflammation, is associated with patient mortality.Citation5,Citation6 However, the role of glycosylation in obesity and MASH was still uncertain.
In this study, we obtained gene expression data from the Gene Expression Omnibus (GEO) database and identified DEGs between response and non-response patients to weight loss treatment. The function of these DEGs was further explored. Glycosylation-related DEGs were also extracted. Three machine-learning approaches were used to screen hub genes in glycosylation-related DEGs: Random Forest, Least absolute shrinkage and selection operator (Lasso), and Support vector machines (SVM). A total of 7 hub genes were identified and then subjected to correlation analysis, immune cells infiltration analysis and ROC analysis. Hub genes were validated in MASH mice.
Materials and Methods
Acquisition of Datasets
Gene expression profiles of GSE83452 and GSE89632 were downloaded from the Gene Expression Omnibus (GEO) database (http://www.ncbi.nih.gov/gds/). Both gene expression profiles were acquired from human liver samples. For GSE83452, a total of 21 liver samples of obesity patients response to weight loss treatments and 17 liver samples of obesity patients non-response to weight loss treatments were enrolled. For GSE89632, 19 liver samples from metabolism-associated steatohepatitis (MASH) patients and 24 liver samples from control groups were enrolled. Glycosylation-related genes were obtained from published work.Citation7 The diagnosis of steatohepatitis in the human liver samples was confirmed by histologic examination as reported in the original studies from which the data were obtained (GSE83452 and GSE89632).
Identification of Differentially Expressed Genes and Selection of Potential Target Genes
To identify DEGs between non-response and response patients, we performed differentially expressed gene analysis based on gene expression profiles of GSE83452 using the “limma” package. The cut-off value was set to P-value < 0.05. The overlapped genes were chosen for subsequent analysis.
Enrichment Analysis
We performed Gene Ontology (GO) and Kyoto Encyclopedia of Genes and Genomes (KEGG) enrichment analysis using the R package “clusterProfiler” package to comprehend the biological significance of selected genes.
Construction of Protein-Protein Networks
For overlapping partial genes, we created protein-protein interaction (PPI) networks using the STRING (https://string-db.org) database and GeneMINIA (http://genemania.org/) database.
Identification of Hub Genes
To identify hub genes associated with response to weight loss treatments, three machine learning approaches were used to screen hub genes in glycosylation-related DEGs, including Random forest (R package “randomForest”), Least absolute shrinkage and selection operator (Lasso, R package “glmnet”), and Support vector machines (SVM, R package “kernlab”).
Random Forest is a supervised learning algorithm that combines multiple decision trees to create a model. It is an ensemble learning method in which a group of uncorrelated decision trees are constructed and combined to form a more accurate and stable prediction model. In each tree, a random subset of the training data is used to grow the tree, and the final prediction is made by aggregating the predictions of all the trees.
Lasso (Least Absolute Shrinkage and Selection Operator) is a linear regression algorithm that performs variable selection and regularization to prevent overfitting. It adds a penalty term to the cost function, which reduces the magnitude of the coefficients of less important features to zero while keeping the most significant features. Lasso can be used for feature selection and dimensionality reduction tasks.
Support Vector Machine (SVM): Support Vector Machine is a powerful supervised learning algorithm that can be used for classification, regression, and outlier detection tasks. SVM finds a hyperplane that maximizes the margin between two classes, where the margin is the distance between the closest points of different classes. SVM uses a kernel function to transform the input data into a higher dimensional space, making it easier to find a separating hyperplane. SVM can handle non-linearly separable data using different kernel functions such as polynomial, RBF, sigmoid, etc.
Microenvironment Analysis
R package “GSVA” was used to evaluate liver samples’ immune cell infiltration level. The correlation of gene expression with immune cells was calculated and displayed.
Gene Regulatory Network
The gene regulatory network of hub genes was analyzed using the Regnetwork database (www.regnetworkweb.org). Cytoscape software was used to visualize the network.
Animals and Diets
Six-week-old male C57BL/6J mice were obtained from Charles River Laboratories and housed in a specific pathogen-free (SPF) facility at Zhejiang University in China. The mice were kept under controlled conditions with a constant temperature of 20–22°C and a 12-hour light-dark cycle. To induce non-alcoholic fatty liver disease (NAFLD), the mice were treated with a two-week course of antibiotics (ampicillin 1 g/L, gentamicin 1 g/L, metronidazole 1 g/L, and vancomycin 0.5 g/L), followed by a high-fat, high-carbohydrate (HFHC) diet. The HFHC diet used was the Surwit model from Trophic Animal Feed High-Tech Co., Ltd, China, which contained 18.9 g glucose and 23.1 g fructose per liter of tap water. At week 16, the mice were sacrificed, and various samples were collected. In intervention experiments, some mice were fed with 3-HPAA at a 75 μg/mL concentration after the antibiotic treatment and then continued on the HFHC diet until week 16. Weekly measurements were taken of the mice’s body weight and food intake. Before sample collection, the mice were fasted for 12 hours, and blood was collected from the retro- orbital sinus. The mice’s body weights were recorded, and the liver was promptly excised and weighed. All animal procedures were conducted following the approval of the Zhejiang University Experimental Animal Ethics Committee.
Serum Detection
Upon collection, blood samples obtained from the orbital vein of the mice were allowed to stand at room temperature for 30 minutes. Subsequently, the samples underwent centrifugation at 4°C and 3000 rpm for 5 minutes. The resulting supernatant was carefully collected and stored in 100 μL aliquots at −80°C for future use. To determine the serum concentrations of alanine aminotransferase (ALT), the ALT/GPT activity assay kit was employed (Applygen, Beijing, China). Similarly, the serum concentrations of aspartate aminotransferase (AST) were determined using the AST/GOT activity assay kit (Applygen, Beijing, China). For the measurement of serum triglyceride (TG) levels, the GPO-PAP method-based triglyceride assay kit was utilized (Nanjing Jiancheng Bioengineering Institute, Jiangsu, China).
Histological Analysis
The liver tissues were immersed in 4% paraformaldehyde for 24 hours. Following this, a dehydration process using a gradient solution was performed, and the tissues were subsequently embedded in paraffin for slicing into 4μm thick sections. Hematoxylin and eosin (H&E) staining (Solarbio, Beijing, China), as well as Sirius red staining (Abcam), were employed. To evaluate the progression of NAFLD, we utilized the NAFLD activity score (NAS) system, which encompasses steatosis, lobular inflammation, and hepatocellular ballooning. This system assigns scores ranging from 0 to 2 for non-MASH, 3–4 for MASH borderline, and 5 to 8 for MASH. To further assess the extent of liver fibrosis, Sirius red staining was employed. Liver tissues intended for frozen sections were initially rapidly frozen using liquid nitrogen and subsequently embedded in an Optimal cutting temperature compound (OCT). These frozen tissues were then sliced at −20°C into sections with a thickness of 8μm. Oil red O staining (Solarbio, Beijing, China) was performed to quantify the area occupied by lipid droplets and evaluate fat accumulation in the liver.
RNA Extraction and Quantitative Real-Time PCR
The RNA extraction from liver and ileum tissues was conducted using the RNA-Quick Purification Kit (ESscience, China). The extracted RNA samples were subjected to absorption measurements to evaluate their quality and quantity. Subsequently, the RNA was reverse-transcribed into complementary DNA (cDNA) using the Evo M-MLV RT Premix kit (Vazyme Biotech Co., Ltd). The cDNA was combined with Hifair™ qPCR SYBR Green Master Mix to form a mixture (Accurate Biology, China), and the expression levels of the target genes were assessed using an ABI 7900HT Real-Time PCR system (Applied Biosystems, USA). For comparative data analysis, the 2-ΔΔCt method was applied. The relative expression differences between the comparison groups were determined. All reactions were conducted in triplicate to ensure reliable results.
Statistical Analyses
The experiments were replicated at least three times, and the data is expressed as mean ± SD. Statistical analysis was performed using GraphPad Prism version 8.0 (www.graphpad.com). Student’s t-tests were primarily utilized for comparisons between the two groups. For comparisons involving three or more groups, one-way or two-way analysis of variance (ANOVA) followed by Tukey’s post hoc test was applied. Statistical significance was considered at *P <0.05, **P <0.01 ***P <0.001.
Results
Identification of DEGs
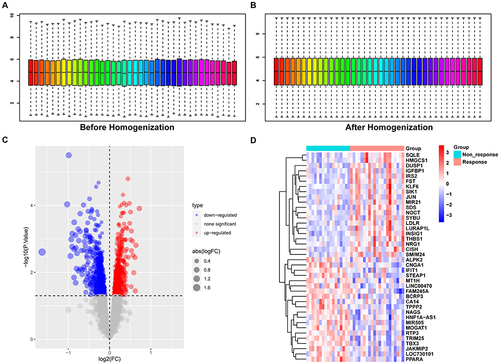
We first normalized the expression profile of GSE83452 ( and ). The DEGs were screened using GSE83452 according to the cut-off criterion of P-value < 0.05. The volcanic diagram and heatmap of DEGs are shown in and . In GSE83452, 688 genes were up-regulated in the non-response group and 649 genes were down-regulated.
Figure 1 Identification of differentially expressed genes.
Enrichment Analysis of DEGs
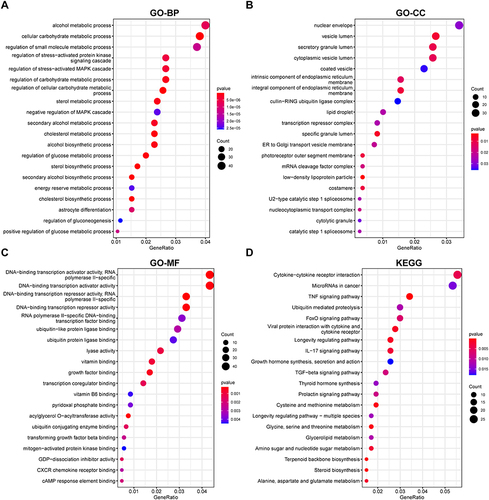
We performed GO and KEGG enrichment analysis based on 688 up-regulated DEGs and 649 down-regulated DEGs. GO analysis showed that DEGs were mainly related to the alcohol metabolic process and cellular carbohydrate metabolic process in biological process (BP) (), nuclear envelope and vesicle lumen in cellular component (CC) () and DNA−binding transcription activator activity and ubiquitin protein ligase binding in molecular function (MF) (). For the results of KEGG, Cytokine−cytokine receptor interaction, TNF signaling pathway, Ubiquitin mediated proteolysis, FoxO signaling pathway, and TGF−beta signaling pathway were enriched ().
Figure 2 Enrichment analysis of DEGs.
Identification of Glycosylation-Related DEGs
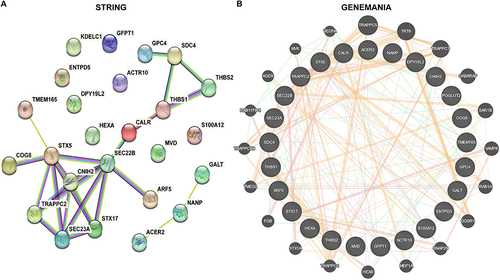
We next obtained glycosylation-related genes and selected these from DEGs. Results indicated that among 572 glycosylation-related genes, 7 genes were up-regulated in the non-response group and 18 genes were down-regulated ( and ). KEGG analysis suggested that these 25 glycosylation-related DEGs were enriched in Phagosome, Amino sugar and nucleotide sugar metabolism, SNARE interactions in vesicular transport, and ECM−receptor interaction ( and ). We further displayed the volcanic map (), heatmap () and differential expression boxplot () between non-response and response groups. We also explored the protein-protein interaction network between 25 glycosylation-related DEGs using String and GeneMANIA database ( and ).
Figure 3 Identification of glycosylation-related DEGs.
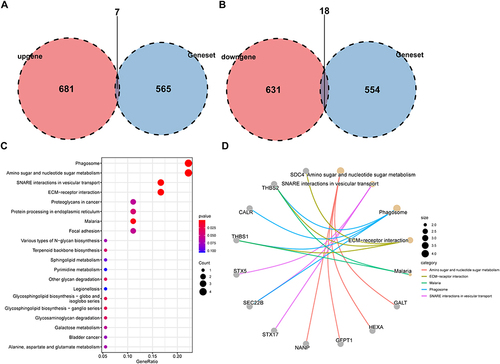
Figure 4 Exhibition of glycosylation-related DEGs.
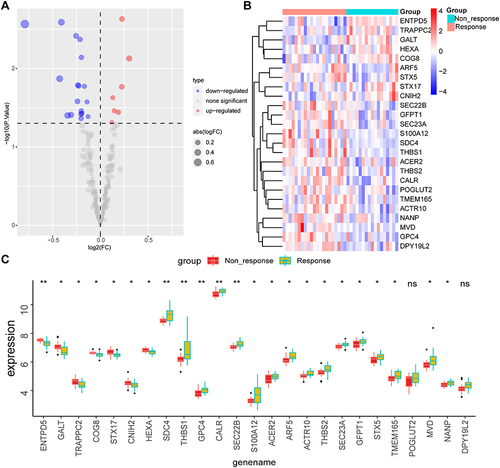
Figure 5 PPI network for DEGs.
Selection of Hub Genes via Machine Learning
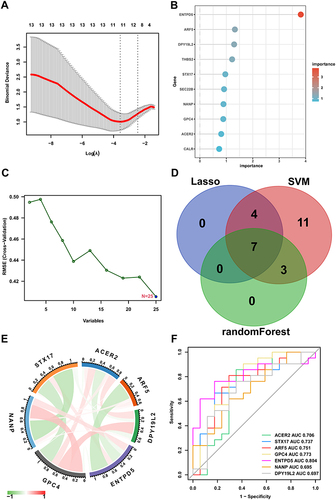
Three algorithms were utilized for screening hub genes among key glycosylation-related DEGs. For the LASSO algorithm, we selected the minimum criteria for building the LASSO classifier due to higher accuracy by comparisons and 11 characteristic genes were identified (). For the random forest algorithm, the top 10 characteristic genes with relative importance > 0.5 were determined (). For the SVM-RFE (Support Vector Machine-Recursive Feature Elimination) algorithm, the classifier had the minimum error when the feature number was 25 (). Following the intersection, 7 characteristic genes shared by the three algorithms were finally identified (ACER2, STX17, ARF5, GPC4, ENTPD5, NANP, and DPY19L2; ). The expression profiles of the 7 genes were significantly correlated (). Besides, we also estimated the prediction performance of each hub gene in predicting response to weight loss treatment. The AUC (Area Under Curve) values of ROC curves were illustrated in , indicating that these hub genes enabled the estimate of the response to weight loss treatment.
Figure 6 Selection of hub genes via machine learning.
Immune Cell Infiltration Analysis
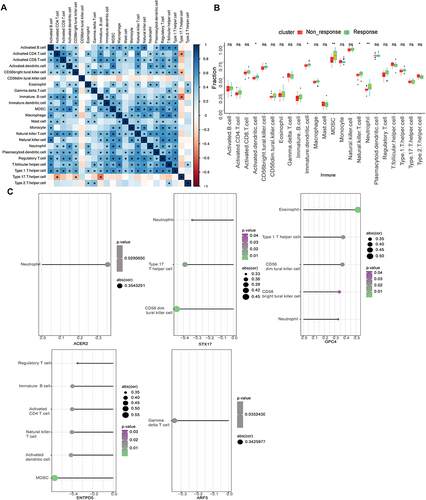
The ssGSEA algorithm of R package “GSVA” was used to evaluate the infiltration level of 23 immune cells using GSE83452 (). The differences between non-response and response groups were compared. Results indicated that the infiltration levels of 5 of 23 immune cells were lower in liver tissues of non-response patients, indicating that patients who are non-response to weight loss treatment have less immune cell levels (). The correlation of hub genes with 23 immune cell infiltration levels was analyzed (only show results with p < 0.05; ).
Figure 7 The correlation analysis of immune cell infiltration.
Characteristics of Glycosylation-Related Hub Genes
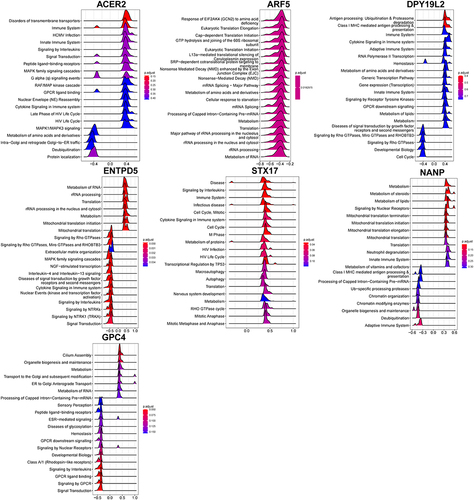
Correlation analysis between 7 hub genes and all genes was carried out and the 50 genes with the strongest positive correlation were displayed by heatmap respectively (). For example, ENTPD5 was positively correlated with KLHDC7A, PIPOX, and TOLLIP. Based on the results of correlation analysis, the GSEA analysis of a single gene based on Reactome was prosecuted to evaluate signaling pathways involved in the hub genes (). ENTPD5 was associated with Metabolism, Mitochondrial translation, and MAPK family signaling cascades.
Figure 8 The Co-expression analysis of hub genes.
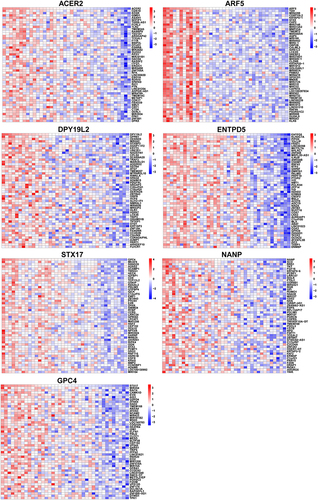
Figure 9 GSEA of hub genes.
Establishment of the miRNA-TF-Genes Network
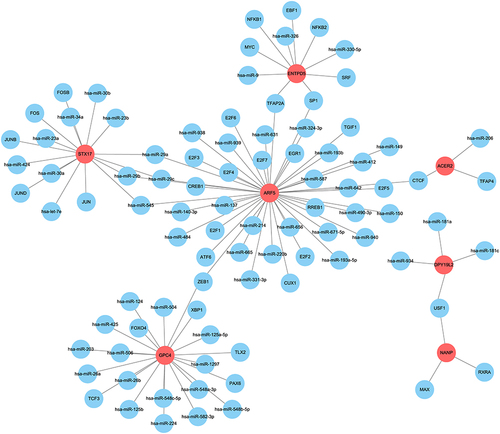
To investigate the molecular mechanism, the RegNetwork database was utilized to identify upstream miRNAs and TFs (transcription factors) of the 7 target genes (). For example, ACER2 was predicted to be regulated by has-miR-206, TFAP4, and CTCF in this network. NANP was predicted to be regulated by USF1, RXRA, and MAX.
Figure 10 Establishment of the miRNA-TF-genes network.
Validation of Glycosylation-Related Hub Genes
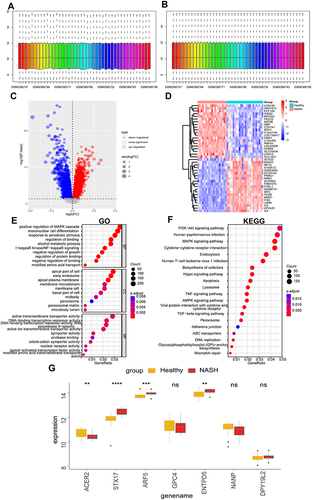
Since obesity is closely related to MASH, we next explored the relationship of these glycosylation-related hub genes with MASH. We normalized the expression profile of GSE89632 ( and ). The DEGs were screened using GSE89632 according to the cut-off criterion of P-value < 0.05. The volcanic diagram and heatmap of DEGs are shown in and . We performed GO and KEGG enrichment analyses based on DEGs. GO analysis showed that DEGs were mainly related to positive regulation of MAPK cascade and mononuclear cell differentiation in BP, apical part of the cell and early endosome in CC, and active transmembrane transporter activity in MF (). For the results of KEGG, the PI3K−Akt signaling pathway, MAPK signaling pathway, and Cytokine−cytokine receptor interaction were enriched (). Among 7 hub glycosylation-related genes, we found that ACER2 was down-regulated in MASH patients while STX17, ARF5, and ENTPD5 were up-regulated in MASH patients ().
Figure 11 Validation of glycosylation-related hub genes.
Validation of Hub Genes in MASH Mice
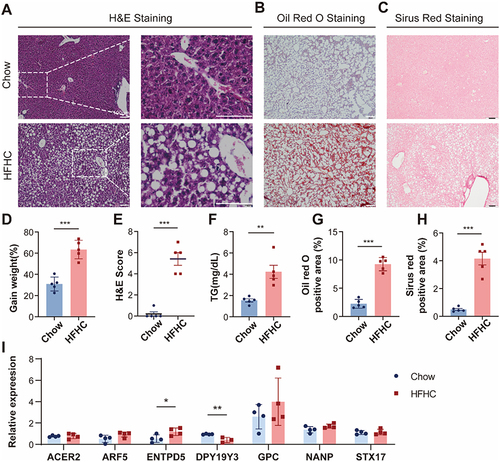
To investigate the role of hub genes in vivo, we established a murine model of MASH by subjecting them to a high-fat high-carbohydrate (HFHC) diet. After a 16-week modeling period, the HFHC group exhibited evident hepatic steatosis ( and ), increased fibrosis ( and ), and a significant increase in body weight (). Biochemical analysis of blood samples revealed elevated levels of triglycerides (TG) in the HFHC group mice (). In the liver tissues of both groups, quantitative real-time PCR (qPCR) analysis identified significant differences in the transcription levels of two genes out of the hub genes we screened. Specifically, ENTPD5 showed increased transcription in obese mice, while DPY19Y3 exhibited decreased transcription, consistent with our previous predictions (). These findings prove that the predicted hub genes play a role in MASH.
Figure 12 Validation of hub genes in HFHC mice.
Discussion
Obesity is a serious disease worldwide, and in the past decades, obesity has become a growing global public health problem.Citation8,Citation9 For example, in China, obesity is strongly associated with hypertension, angina, diabetes, and arthritis.Citation10 Theoretically, obesity is an excessive accumulation or abnormal distribution of body fat.Citation11 The complications of obesity are numerous and include, but are not limited to, diabetes, MASH, cardiovascular disease, stroke, dyslipidemia, hypertension, osteoarthritis, sleep apnea, etc.Citation12,Citation13 Obese patients also have a higher incidence of various types of tumors and worse survival rates.Citation14,Citation15
Surgery, lifestyle modification, and medications are the current mainstay of treatment for obesity.Citation16,Citation17 However, many patients are non-response to these treatment modalities. Finding the underlying mechanisms and hub genes that affect therapeutic sensitivity is particularly important.
Glycosylation is a diverse protein post-translational modification.Citation3 During inflammation, glycosylation regulates protein function in various complex ways, thereby playing a key role in promoting inflammation.Citation4 However, the role of glycosylation in obesity was still uncertain.
In our work, integrated bioinformatics, including differential expression analysis and machine learning, were performed to identify hub genes associated with response to weight loss treatment. We first screened DEGs between non-response and response groups. GO and KEGG analysis showed that DEGs were mainly related to the Alcohol metabolic process, Cytokine−cytokine receptor interaction, TNF signaling pathway, ubiquitin-mediated proteolysis, FoxO signaling pathway, and TGF−beta signaling pathways. Studies have shown that excessive alcohol consumption can lead to weight gain.Citation18 Our findings suggested that alterations in alcohol metabolism, as well as other important pathways, may be associated with sensitivity to weight loss therapy in obese patients.
We next obtained glycosylation-related genes and selected these from DEGs. Three algorithms were utilized for screening hub genes among key glycosylation-related DEGs. For the LASSO algorithm, we selected the minimum criteria for building the LASSO classifier due to higher accuracy by comparisons and 11 characteristic genes were identified. For the random forest algorithm, the top 10 characteristic genes with relative importance > 0.5 were determined. For the SVM-RFE algorithm, when the feature number was 25, the classifier had the minimum error. Following the intersection, 7 characteristic genes shared by the three algorithms were finally identified (ACER2, STX17, ARF5, GPC4, ENTPD5, NANP, and DPY19L2). The AUC values of ROC curves were also illustrated. ENTPD5 has the highest AUC value (0.804) among the 7 genes.
To investigate the molecular mechanism of 7 hub genes, the RegNetwork database was utilized to identify upstream miRNAs and TFs of the 7 target genes. For example, ACER2 was predicted to be regulated by has-miR-206, TFAP4, and CTCF. NANP was predicted to be regulated by USF1, RXRA, and MAX.
Since obesity is closely related to MASH, we next explored the relationship of these glycosylation-related hub genes with MASH. Among 7 hub glycosylation-related genes, we found that ACER2 was down-regulated in MASH patients while STX17, ARF5, and ENTPD5 were up-regulated in MASH patients. These results indicated that these hub genes also correlated with MASH.
Impaired protein N-glycosylation is known to induce ER stress, which can lead to either adaptive survival or maladaptive apoptosis. Oxidative stress plays a central role in sarcopenic obesity, particularly through mitochondrial dysfunction and ER stress.Citation19 In our study, we identified several glycosylation-related genes that may influence these pathways. Specifically, ENTPD5, which showed increased transcription in obese MASH mice, is known to be involved in protein folding and ER stress response. Future studies should explore the mechanistic link between these glycosylation-related genes and ER stress pathways to better understand their roles in obesity and MASH. Our findings on glycosylation-related genes could also be extended to investigate their potential involvement in oxidative stress pathways. For instance, STX17, identified as a hub gene in our study, has been implicated in mitochondrial function and could be a link between glycosylation, oxidative stress, and sarcopenic obesity. Further research should include oxidative stress markers and mitochondrial function assays in both human and animal models.
The connection between MASH and sarcopenia is indeed significant, and the scarcity of suitable animal models has limited research in this area. Additionally, we recognize the challenges in defining and diagnosing sarcopenia, as highlighted in “Intern Emerg Med. 2023”.Citation20 To address this, we propose to include standardized criteria for sarcopenia diagnosis in future studies, such as muscle strength and mass measurements, to ensure consistency and comparability of results.
ACER2 is involved in the metabolism of sphingolipids, which are critical components of cell membranes and play a role in cell signaling. Dysregulation of sphingolipid metabolism can lead to inflammation and insulin resistance, contributing to obesity and liver steatosis. Zhang et alCitation21 found that ACER2 (alkaline ceramidase 2) was involved in obesity-induced adipose dysfunction which is a major contributor to atherosclerosis.
STX17 (syntaxin 17) is essential for autophagy, a process that degrades and recycles cellular components. In the context of MASH, STX17 homocysteinylation and ubiquitination can block autophagy, leading to increased inflammation and fibrosis. Xu et alCitation22 found that STX17 induced obesity-related cardiac impairment. STX17 homocysteinylation and ubiquitination leads to a block in autophagy during MASH progression.Citation23 Supplementary vitamin B12 and folate restore STX17 expression and autophagy to decrease inflammation and fibrosis in MASH.Citation23
GPC4 (serum glypican 4) is an adipokine associated with insulin resistance in adipose tissue. Elevated levels of GPC4 have been linked to increased obesity and insulin resistance. Targeting GPC4 could improve insulin sensitivity and reduce adipose tissue inflammation, thereby addressing metabolic dysfunctions associated with obesity. Serum GPC4 levels were increased with increasing degrees of obesity in adults and children.Citation24 Zhang et alCitation25 reported that GPC4 is an adipokine associated with adipose tissue insulin resistance, and may be a marker for adipose tissue insulin resistance in Chinese north obese populations, was involved in liver metabolic.
ENTPD5 is involved in protein folding and glycosylation in the endoplasmic reticulum. It has been implicated in liver metabolism and is upregulated in models of Type 2 Diabetes and obesity. Wei et alCitation26 proposed that ENTPD5 (ectonucleoside triphosphate diphosphohydrolase 5) was involved in liver metabolism and may act as a potential drug target for obesity, fatty liver disease, and insulin resistance associated with the metabolic syndrome. ENTPD5 is also upregulated in the db/db mouse model of Type 2 Diabetes and Obesity.Citation27
NANP (N-acetylneuraminic acid phosphatase) is associated with sialic acid metabolism, which plays a role in cell signaling and inflammation. Dysregulation of sialic acid metabolism can contribute to hyperlipidemia and insulin resistance. Targeting NANP could modulate these pathways, offering therapeutic benefits for metabolic disorders. In rats, NANP was reported to be associated with hyperlipidemia and insulin resistance.Citation28
ARF5 (ADP-ribosylation factor 5) is involved in intracellular vesicle trafficking and lipid metabolism. Although its role in obesity and NASH is not well-documented, ARF5 could influence lipid droplet formation and secretion, impacting liver steatosis. ARF5 was required for oocyte meiosis and quality control.Citation29 DPY19L2(dpy-19-like 2) is involved in cell adhesion and migration. DPY19L2 deletion was a major cause of globozoospermia.Citation30 However, ARF5 and DPY19L2 have not been reported in obesity or MASH. Further research is needed to elucidate its specific functions and potential as a therapeutic target.
To validate the role of these hub genes in vivo, we established a MASH mice model. In the liver tissues, ENTPD5 showed increased transcription in obese mice, while DPY19Y3 exhibited decreased transcription, consistent with our previous predictions. These findings prove that the predicted hub genes play a role in MASH. Our results suggest that glycosylation-related genes are not only crucial in the pathogenesis of obesity but also in the progression of MASH. Specifically, ENTPD5 was identified as a potential key player in MASH development, showing increased transcription in both obese patients and MASH mice. This highlights the potential of ENTPD5 as a therapeutic target for obesity-related liver diseases.
It is important to note that while the HFHC diet induces fatty liver and fibrosis in mice, it does not fully recapitulate the classical steatohepatitis or fatty liver disease observed in humans. This limitation should be considered when interpreting the results of our animal experiments. The observed hepatic steatosis and fibrosis in our mouse model provide valuable insights but may not entirely represent the complexity of human MASH.
Future research should focus on further validating these findings through expanded animal studies, including protein expression analysis, functional studies, and comprehensive biochemical assessments. These additional experiments will provide deeper insights into the molecular mechanisms underlying obesity and MASH, and may pave the way for the development of targeted therapies.
Conclusion
In conclusion, our study provides new perspectives on the role of glycosylation in obesity and MASH, emphasizing the importance of glycosylation-related genes in these conditions. These findings offer a promising direction for future research aimed at understanding and treating obesity and its related complications.
Ethics Approval and Consent to Participate
All methods were performed in accordance with the relevant guidelines and regulations. The study is reported in accordance with ARRIVE guidelines, Basel Declaration and the ethical guidelines by the International Council for Laboratory Animal Science (ICLAS). All animal procedures were conducted following the approval of the Zhejiang University Experimental Animal Ethics Committee.
Disclosure
The authors declare no conflicts of interest in this work.
Acknowledgments
Weihua Yu and Jionghuang Chen should be considered as co-first authors. We acknowledge GEO database for providing their platforms and contributors for uploading their meaningful datasets. Our study is based on open-source data, so there are no ethical issues and other conflicts of interest.
Data Sharing Statement
Raw data of this study are available from the corresponding author Xiujun Cai upon request.
Additional information
Funding
References
- Reinehr T, Wabitsch M. Childhood obesity. Curr Opin Lipidol. 2011;22(1):21–25. doi:10.1097/MOL.0b013e32833f9c37
- Piché M-E, Tchernof A, Després J-P. Obesity phenotypes, diabetes, and cardiovascular diseases. Circ Res. 2020;126(11):1477–1500. doi:10.1161/CIRCRESAHA.120.316101
- Paone P, Suriano F, Jian C, et al. Prebiotic oligofructose protects against high-fat diet-induced obesity by changing the gut microbiota, intestinal mucus production, glycosylation and secretion. Gut Microbes. 2022;14(1):2152307. doi:10.1080/19490976.2022.2152307
- Radovani B, Gudelj I. N-Glycosylation and Inflammation; the Not-So-Sweet Relation. Front Immunol. 2022;13:893365. doi:10.3389/fimmu.2022.893365
- Gruppen EG, Kunutsor SK, Kieneker LM, et al. GlycA, a novel pro-inflammatory glycoprotein biomarker is associated with mortality: results from the PREVEND study and meta-analysis. J Intern Med. 2019;286(5):596–609. doi:10.1111/joim.12953
- Carmona-Maurici J, Amigó N, Cuello E, et al. Bariatric surgery decreases oxidative stress and protein glycosylation in patients with morbid obesity. Eur J Clin Invest. 2020;50(11):e13320. doi:10.1111/eci.13320
- Liu P, Zhou Q, Li J. Integrated multi-omics data analysis reveals associations between glycosylation and stemness in hepatocellular carcinoma. Front Oncol. 2022;12:913432. doi:10.3389/fonc.2022.913432
- Shukla A, Kumar K, Singh A. Association between obesity and selected morbidities: a study of BRICS countries. PLoS One. 2014;9(4):e94433. doi:10.1371/journal.pone.0094433
- Cabrera-Fuentes HA, Aragones J, Bernhagen J, et al. From basic mechanisms to clinical applications in heart protection, new players in cardiovascular diseases and cardiac theranostics: meeting report from the third international symposium on ”New frontiers in cardiovascular research”. Basic Res Cardiol. 2016;111(6):69. doi:10.1007/s00395-016-0586-x
- Mayoral LP-C, Andrade GM, Mayoral EP-C, et al. Obesity subtypes, related biomarkers & heterogeneity. Indian J Med Res. 2020;151(1):11–21. doi:10.4103/ijmr.IJMR_1768_17
- Cabrera-Fuentes HA, Alba-Alba C, Aragones J, et al. Meeting report from the 2nd International Symposium on New Frontiers in Cardiovascular Research. Protecting the cardiovascular system from ischemia: between bench and bedside. Basic Res Cardiol. 2016;111(1):7. doi:10.1007/s00395-015-0527-0
- Bray GA. Evaluation of obesity. Who are the obese? Postgrad Med. 2003;114(6):19–38. doi:10.3810/pgm.2003.12.1544
- Romero-Corral A, Somers VK, Sierra-Johnson J, et al. Accuracy of body mass index in diagnosing obesity in the adult general population. Int J Obes. 2008;32(6):959–966. doi:10.1038/ijo.2008.11
- Marengo A, Rosso C, Bugianesi E. Liver cancer: connections with obesity, fatty liver, and cirrhosis. Annu Rev Med. 2016;67(1):103–117. doi:10.1146/annurev-med-090514-013832
- Grohmann M, Wiede F, Dodd GT, et al. Obesity drives STAT-1-dependent NASH and STAT-3-dependent HCC. Cell. 2018;175(5):1289–1306.e20. doi:10.1016/j.cell.2018.09.053
- Jackson VM, Breen DM, Fortin J-P, et al. Latest approaches for the treatment of obesity. Expert Opin Drug Discov. 2015;10(8):825–839. doi:10.1517/17460441.2015.1044966
- Lee K, Kruper L, Dieli-Conwright CM, Mortimer JE. The impact of obesity on breast cancer diagnosis and treatment. Curr Oncol Rep. 2019;21(5):41. doi:10.1007/s11912-019-0787-1
- Traversy G, Chaput J-P. Alcohol consumption and obesity: an update. Curr Obes Rep. 2015;4(1):122–130. doi:10.1007/s13679-014-0129-4
- Gonzalez A, Simon F, Achiardi O, Vilos C, Cabrera D, Cabello-Verrugio C. The critical role of oxidative stress in sarcopenic obesity. Oxid Med Cell Longev. 2021;2021:4493817. doi:10.1155/2021/4493817
- Tarantino G, Sinatti G, Citro V, Santini S Jr, Balsano C. Sarcopenia, a condition shared by various diseases: can we alleviate or delay the progression? Intern Emerg Med. 2023;18(7):1887–1895. doi:10.1007/s11739-023-03339-z
- Zhang X, Zhang Y, Wang P, et al. Adipocyte hypoxia-inducible factor 2α suppresses atherosclerosis by promoting adipose ceramide catabolism. Cell Metab. 2019;30(5):937–951.e5. doi:10.1016/j.cmet.2019.09.016
- Xu H, Yu W, Sun M, et al. Syntaxin17 contributes to obesity cardiomyopathy through promoting mitochondrial Ca2+ overload in a Parkin-MCUb-dependent manner. Metabolism. 2023;143:155551. doi:10.1016/j.metabol.2023.155551
- Tripathi M, Singh BK, Zhou J, et al. Vitamin B12 and folate decrease inflammation and fibrosis in NASH by preventing syntaxin 17 homocysteinylation. J Hepatol. 2022;77(5):1246–1255. doi:10.1016/j.jhep.2022.06.033
- Leelalertlauw C, Korwutthikulrangsri M, Mahachoklertwattana P, et al. Serum glypican 4 level in obese children and its relation to degree of obesity. Clin Endocrinol. 2017;87(6):689–695. doi:10.1111/cen.13435
- Zhang K, Zhu H, Wang L, Yang H, Pan H, Gong F. Serum glypican4 and glycosylphosphatidylinositol-specific phospholipase D levels are associated with adipose tissue insulin resistance in obese subjects with different glucose metabolism status. J Endocrinol Invest. 2021;44(4):781–790. doi:10.1007/s40618-020-01372-9
- Wei J, Yuan Y, Chen L, et al. ER-associated ubiquitin ligase HRD1 programs liver metabolism by targeting multiple metabolic enzymes. Nat Commun. 2018;9(1):3659. doi:10.1038/s41467-018-06091-7
- Xiang L, Jiao Y, Qian Y, Li Y, Mao F, Lu Y. Comparison of hepatic gene expression profiles between three mouse models of Nonalcoholic Fatty Liver Disease. Genes Dis. 2022;9(1):201–215. doi:10.1016/j.gendis.2021.02.008
- Yida Z, Imam MU, Ismail M, Ismail N, Ideris A, Abdullah MA. High fat diet-induced inflammation and oxidative stress are attenuated by N-acetylneuraminic acid in rats. J Biomed Sci. 2015;22(1):96. doi:10.1186/s12929-015-0211-6
- Zhou C-X, Wang Y, Shi L-Y, et al. GTPases Arf5 and Arl2 function partially distinctly during oocyte meiosis. J Cell Biochem. 2021;122(2):198–208. doi:10.1002/jcb.29839
- Koscinski I, Elinati E, Fossard C, et al. DPY19L2 deletion as a major cause of globozoospermia. Am J Hum Genet. 2011;88(3):344–350. doi:10.1016/j.ajhg.2011.01.018