
Abstract
Purpose
Hospitalized hypertensive patients rely on blood pressure medication, yet there is limited research on the sole use of amlodipine, despite its proven efficacy in protecting target organs and reducing mortality. This study aims to identify key indicators influencing the efficacy of amlodipine, thereby enhancing treatment outcomes.
Patients and Methods
In this multicenter retrospective study, 870 hospitalized patients with primary hypertension exclusively received amlodipine for the first 5 days after admission, and their medical records contained comprehensive blood pressure records. They were categorized into success (n=479) and failure (n=391) groups based on average blood pressure control efficacy. Predictive models were constructed using six machine learning algorithms. Evaluation metrics encompassed the area under the curve (AUC), accuracy, sensitivity, specificity, positive predictive value (PPV), and negative predictive value (NPV). SHapley Additive exPlanations (SHAP) analysis assessed feature contributions to efficacy.
Results
All six machine learning models demonstrated superior predictive performance. Following variable reduction, the model predicting amlodipine efficacy was reconstructed using these algorithms, with the light gradient boosting machine (LightGBM) model achieving the highest overall performance (AUC = 0.803). Notably, amlodipine showed enhanced efficacy in patients with low platelet distribution width (PDW) values, as well as high hematocrit (HCT) and thrombin time (TT) values.
Conclusion
This study utilized machine learning to predict amlodipine’s effectiveness in hypertension treatment, pinpointing key factors: HCT, PDW, and TT levels. Lower PDW, along with higher HCT and TT, correlated with enhanced treatment outcomes. This facilitates personalized treatment, particularly for hospitalized hypertensive patients undergoing amlodipine monotherapy.
Introduction
Hypertension refers to a clinical syndrome characterized by elevated systemic arterial blood pressure, with the main features being a systolic blood pressure (SBP) ≥140 mm Hg and a diastolic blood pressure (DBP) ≥90 mm Hg. This condition often leads to functional or organic damage in vital organs such as the heart, brain, and kidneys,Citation1,Citation2 with its prevalence on the rise.Citation3,Citation4 The 2020 International Society of Hypertension (ISH) Global Hypertension Practice Guidelines classify different stages of blood pressure as follows: a) Normal BP: SBP <130 mm Hg and DBP <85 mm Hg, b) High-normal BP: SBP 130–139 mm Hg and/or DBP 85–89 mm Hg, c) Grade 1 hypertension: SBP 140–159 mm Hg and/or DBP 90–99 mm Hg, and Grade 2 hypertension: SBP ≥160 mm Hg and/or DBP ≥100 mm Hg.Citation5 Risk factors for hypertension encompass age, weight, smoking, alcohol consumption, genetic factors, dietary habits (such as high-salt diet), and lack of exercise.Citation6,Citation7 According to the American College of Cardiology/American Heart Association (ACC/AHA) guidelines, antihypertensive drug treatment should be added in patients with an SBP ≥140 mm Hg or a DBP ≥90 mm Hg.Citation7
Treatment for hospitalized hypertensive patients focuses on medication to control blood pressure,Citation8 aiming to minimize the risk of cardiac, kidney, and vascular complications, and reduce hypertension-related mortality.Citation1 For patients with blood pressure in the grade 1 hypertension range and no evident cardiovascular disease at baseline, antihypertensive therapy often yields beneficial effects on cardiovascular outcomes, with statistically significant reductions observed in stroke, cardiovascular mortality, and total mortality.Citation9
Although existing guidelines primarily address outpatient hypertension management and lack specific recommendations for hospitalized patients.Citation10 It’s crucial to acknowledge the potential for adverse reactions with antihypertensive drugs, necessitating careful monitoring and regimen adjustments.Citation11 Therefore, understanding the most effective pharmacological treatments for hypertension is essential to mitigate cardiovascular mortality, disease burden, and socioeconomic stress.Citation12
The latest hypertension guidelines advocate calcium channel blockers (CCB) as potential first-line agents for hypertension treatment.Citation13 Among them, amlodipine, the most widely prescribed CCB, stands out for its ability to not only to protect target organs but also to reduce mortality, morbidity, and adverse cardiovascular events.Citation14,Citation15 Clinical research has shown that amlodipine is commonly prescribed within 6 hours of severe hospitalized hypertension onset, maintaining its antihypertensive effect for over 24 hours per single dose.Citation16 Furthermore, in Asian populations with mild to moderate hypertension, titrating amlodipine from 5 mg/day to 10 mg/day significantly reduced SBP.Citation17 Moreover, a pharmacoeconomic review of amlodipine demonstrated its cost-effectiveness and anticipated cost savings compared to conventional treatment.Citation17 However, it’s noteworthy that at a dose of 10 mg, amlodipine is associated with an incidence of edema, dizziness, flushing, and palpitations was 10.8%, 3.4%, 2.6%, and 4.5%, respectively.Citation18 Given these findings, the objective of this study is to develop a clinically feasible analytical method to assist doctors and patients in predicting the effectiveness of amlodipine usage.
Currently, Electronic Health Records (EHRs) are extensively used in hospitals for creating risk models and revealing changes in disease progression.Citation19 Machine learning, with its emphasis on optimal predictive modeling methods, plays a crucial role in analyzing complex clinical characteristics and medication usage in hypertension treatment. By utilizing advanced algorithms, it deepens our understanding of patient-specific factors and their interactions, contributing to the development of predictive models. This application assists healthcare professionals in optimizing hypertension management and enhancing overall patient care.Citation20 In summary, this study employed common machine learning models to develop an amlodipine efficacy prediction model and screen for key factors that affect efficacy. The aim was to help doctors pre-evaluate the effectiveness of amlodipine monotherapy in hypertensive patients, with the goal of improving treatment outcomes.
Materials and Methods
Study Design and Subjects
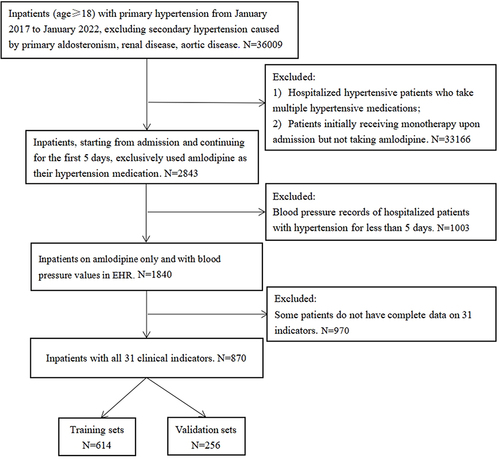
In this multicenter retrospective study, data were collected from hypertensive inpatients at 7 hospitals in Chongqing, China. Initially, from January 2017 to January 2022, a cohort of 36,009 inpatients aged 18 and above, diagnosed with primary hypertension, formed the study population. Patients with secondary hypertension attributed to primary aldosteronism, renal disease, or aortic disease were excluded from the analysis. Subsequent screening led to the exclusion of 33,166 patients, including those hospitalized hypertensive patients taking multiple medications for hypertension, as well as patients initially receiving monotherapy upon admission but not prescribed amlodipine. Among the remaining patients, a subset of 2843 individuals with primary hypertension who exclusively received amlodipine within the first 5 days of hospitalization was identified. Following rigorous screening, 870 patients were successfully enrolled, providing daily blood pressure records and complete data for 31 indicators. The administered dosage of amlodipine ranged from 1 to 10 mg. The initiation day of antihypertensive treatment served as the reference point. Starting from this reference point, we assessed the average blood pressure over a consecutive 5-day period to determine if the expected results had been achieved.
In this study, all blood pressure records of the enrolled patients were obtained from ward rounds, ensuring comprehensive data collection. It is noteworthy that all blood pressure measurements were conducted by trained nurses in the wards under the direction of physicians, ensuring the accuracy and consistency of the recorded values.
Patients were considered to be in the successful group (n=479) if their mean SBP was < 140 mmHg and mean DBP was < 90 mmHg within 5 days after taking amlodipine. Conversely, patients were classified into a failure group (n=391) if the blood pressure criteria were not met, based on the Electronic Health Record (EHR) data. For internal validation, the group was randomly divided (7:3) into a training set (n=614) and a validation set (n=256). This partitioning strategy aimed to evaluate the predictive model’s performance and ensure its generalizability within the study population.
The study received approval from the Ethics Committee of Chongqing Medical University. Written informed consent for participation was not required due to the retrospective design of the study. The research was conducted in compliance with national legislation and institutional requirements.
Inclusion and Exclusion Criteria
The inclusion criteria include the following: (1) enrollment between January 2017 and January 2022; (2) diagnosis of primary hypertension; (3) age ≥ 18 years; (4) starting from admission and continuing for the first 5 days, the patient exclusively used amlodipine as the hypertension medication; (5) documentation of blood pressure readings in the daily ward rounds records for each patient; (6) availability of comprehensive records of 31 clinical indicators.
The exclusion criteria include the following: (1) secondary hypertension caused by primary aldosteronism, kidney disease, aortic disease, etc; (2) concurrent administration of multiple antihypertensive drugs after admission; (3) amlodipine usage for less than 5 days; (4) lack of response to amlodipine within the initial 5 days after admission, leading to a switch to other antihypertensive medications; (5) incomplete records of 31 clinical indicators for patients; (6) absence of complete blood pressure readings in the patient’s ward round records.
The selection process is illustrated in .
Figure 1 Data Processing and Analysis Flowchart.
Research Indicators
Following expert recommendations and relevant research, the initial measurement within the first 24 hours of admission encompassed 44 indicators. However, within the cohort of hospitalized patients included in this study, high rates of missing values were observed for 13 indicators. Consequently, to enhance data integrity, we made the strategic decision to refine our study design, ultimately focusing on a curated set of 31 specific indicators.
The general information included age, sex, SBP, and DBP. The blood routine examination included the coefficient of variation of the red blood cell distribution width (RDW-CV), red blood cell (RBC), mean corpuscular volume (MCV), mean corpuscular hemoglobin (MCH), mean corpuscular hemoglobin concentration (MCHC), mean platelet volume (MPV), PDW, platelet count (PLT), hemoglobin concentration (Hb), and neutrophil count (NEUT#). The coagulation tests covered TT, prothrombin time (PT), and HCT. The biochemical indicators consisted of low-density lipoprotein cholesterol (LDL-C), high-density lipoprotein cholesterol (HDL-C), triglycerides(TG), creatinine (Cr), serum potassium (K), serum chlorine (Cl), serum sodium (Na), aspartate aminotransferase (AST), total cholesterol (TCHO), total bilirubin (TBIL), total protein(TP), serum urea (Urea), serum uric acid (UA). Additionally, the dosage of amlodipine administered to the patients was incorporated into the analysis. The measurement methods and laboratory equipment used in our study were standardized and operated by trained medical personnel to ensure the consistency and comparability of the measurement results.
Statistical Analysis
Excel 2016 was used for data preprocessing, and SPSS 25.0, R4.2.1, and Python 3.9.12 were used for statistical analysis. The enumeration data were expressed as counts and percentages, and the chi-square test was used for comparison between groups. The normality test was performed on the quantitative data. If the data followed the normal distribution, then they were expressed as mean± sd. The t-test was used for comparison between groups. If the data did not follow the normal distribution, then they were expressed as a median and interquartile range [M(P25, P75)]. The Mann–Whitney U-test was used for comparison between groups.
Machine Learning Algorithms
Currently, there are various machine learning models used for predicting hypertension medication efficacy in the literature, such as Support Vector Machine (SVM), Random Forest (RF), and LightGBM.Citation21,Citation22 Among these, RF stands out for its excellent classification accuracy, tolerance to outliers and noise, and avoidance of overfitting.Citation23 Each algorithm possesses unique strengths, including robustness to noise and outliers, computational efficiency, strong predictive performance, automatic handling of categorical features, ensemble learning capability, and support for parallel and distributed computing. The effectiveness and robust performance of these algorithms have been demonstrated in similar studies. Therefore, we selected six algorithms, including RF, eXtreme Gradient Boosting (XGBoost), Gradient Boosting Decision Tree (GBDT), Categorical Boosting (CatBoost), Adaptive Boosting (AdaBoost), and LightGBM. By leveraging these diverse algorithm sets, we established robust and versatile predictive models for analyzing the short-term efficacy of amlodipine in hypertension treatment, ensuring that our research results are both reliable and interpretable.
The models underwent comprehensively evaluated using metrics such as accuracy, sensitivity, specificity, PPV, NPV, and AUC of the receiver operating characteristic (ROC) curve. Additionally, five feature screening methods were employed: recursive feature elimination (RFE), Linear Regression, RF, Pearson Correlation Coefficient (Corr)., and Maximal Information Coefficient (MIC). These rigorous methodologies were implemented to ensure the robustness and reliability of our study’s predictive models, in alignment with the standards of scientific research.
Moreover, the results of the five feature selection algorithms were combined with the model importance ranking. This integration, while maintaining overall performance, facilitated the identification of variables crucial to treatment efficacy. Subsequently, a more streamlined and interpretable model was reconstructed, with the intent of providing enhanced support for clinical decision-making and healthcare practices.
By leveraging a diverse set of machine learning algorithms and rigorous evaluation methodologies, we ensured the robustness and reliability of our predictive models. This comprehensive approach not only enhances predictive accuracy but also provides valuable insights for clinical decision-making and healthcare practices, ultimately improving patient outcomes.
SHapley Additive exPlanations
To enhance the interpretability of machine learning model predictions, we employed the SHAP analysis method. SHAP assigns a Shapley value to each feature, where the positive or negative nature of the value reflects the feature’s positive or negative contribution to the prediction results. This approach provides users with a more comprehensive understanding of the model’s decision-making process and the impact of each feature on the overall performance.
For a more intuitive presentation of the SHAP analysis results, we utilized the Beeswarm plot. These visualizations effectively showcase the SHAP values assigned to each feature, emphasizing their significance in predicting outcomes and facilitating the interpretation of the model’s behavior.
Subgroup Analyses
This study aims to conduct subgroup analysis using the LightGBM model, which demonstrates optimal performance, to categorize patients based on various factors during amlodipine treatment. These factors include whether patients underwent surgery, used hypolipidemic drugs, took antidiabetic medications, belonged to high-risk populations, and their Charlson Comorbidity Index (CCI) scores. Evaluation of the model’s performance focuses on metrics such as accuracy, sensitivity, and AUC, aiming to reveal disparities in treatment outcomes among different patient subgroups and explore key factors influencing treatment efficacy.
The CCI is an assessment method for comorbidities based on assigning scores according to International Classification of Diseases (ICD) codes. It considers patients’ underlying diseases and comorbidities, weighting various chronic conditions to calculate a score reflecting overall health status and survival risk. In this study, the severity of patients’ comorbidities is categorized on a scale of 10 points to reflect their comorbidity burden and overall health status.
According to the 2020 International Society of Hypertension (ISH) Global Hypertension Practice Guidelines, patients with hypertension grades 2 or 3 are classified as high-risk individuals, while those with grade 1 hypertension or normal high values are classified as low-risk individuals.
Given that hypertensive patients often suffer from various conditions such as hyperlipidemia and diabetes, requiring multiple medications simultaneously, we conducted subgroup analysis on hypertensive patients taking hypolipidemic and antidiabetic drugs. This analysis aims to further explore the impact of these factors on the study results and better understand their influence on treatment outcomes.
Results
Subject Characteristics
This study enrolled a total of 870 hypertensive patients, among whom 423 were male (48.62%), with an average age of 68 years (Table S1). The training set included 614 patients, with 337 categorized as successful cases and 277 as failures. In the successful group, 167 patients were male (49.55%) with a median age of 67 years. Conversely, in the failure group, 168 patients were male (46.21%) with a median age of 69 years. Statistical analysis revealed significant differences in DBP, HCT, SBP, RBC, LDL-C, TCHO, and TP (P < 0.05). However, no significant differences were observed in other variables (). Following categorization based on factors such as undergoing surgery during amlodipine treatment, usage of hypolipidemic drugs, usage of antidiabetic drugs, high-risk status, and Charlson scores, demographic analysis was conducted separately (Tables S2–S6).
Table 1 Baseline Characteristics of the Population in the Training Set
Building Machine Learning Models
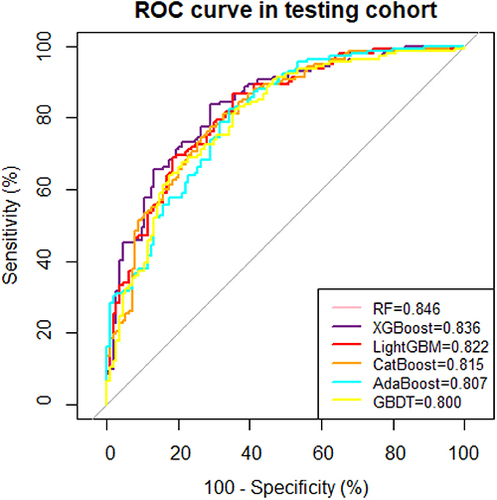
After comprehensively evaluating the performance of six machine learning models using 31 indicators, our study has uncovered remarkable insights into the predictive abilities of various algorithms. Among these, the RF model emerged as the superior choice, exhibiting an AUC score of 0.846, slightly outperforming the XGBoost model with an AUC of 0.836 and the LightGBM model with an AUC of 0.822 (, ).
Table 2 Performance Evaluation of Six Machine Learning Prediction Models Using 31 Indicators
Figure 2 ROC curves for the validation set model with 31 indicators.
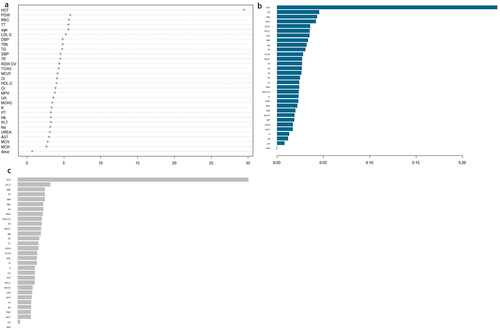
After ranking the importance of the top three models based on comprehensive performance, HCT, LDL-C, TBIL, TT, TG, SBP, Age, TP, NEUT#, RDW-CV, TCHO, PLT, Cr, HDL-C, and PDW all demonstrated significant influence (). Feature rankings were recorded for each algorithm, with higher numerical rankings denoting a more significant impact of the feature. Subsequently, weights corresponding to the average ranking were calculated. Notably, TG, RBC, PDW, HDL-C, TT, TP, MPV, K, HCT, TCHO, Cl, RDW-CV, LDL-C, DBP, and SBP, consistently demonstrated robust performance across all feature selection algorithms, establishing them as key factors influencing the efficacy of amlodipine ().
Table 3 Results of ML Models for Feature Selection
Figure 3 Ranking of feature importance in three machine learning model. (a) Ranking of feature importance in the RF model, (b) Ranking of feature importance in the XGBoost model, (c) Ranking of feature importance in the LightGBM model.
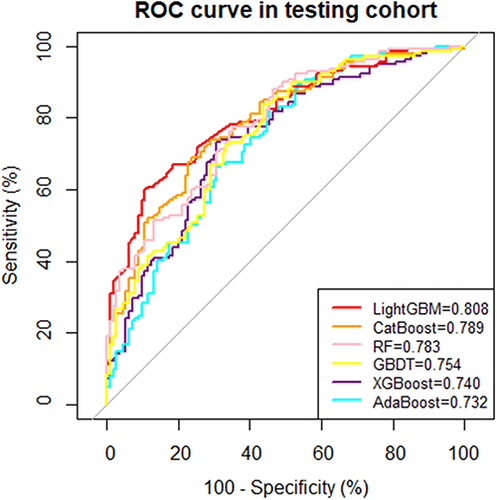
In our analysis of model importance and feature selection algorithms, eight independent factors stood out as having a significant impact on the predictions: HCT, TT, TG, SBP, TP, DBP, TCHO, and PDW—had a significant impact on predictions. The process of variable reduction effectively eliminated non-significantly associated independent variables, contributing to the streamlining of the model’s complexity. In reconstructing the model to predict the efficacy of amlodipine, we implemented the six mentioned machine learning algorithms. Among them, LightGBM once again exhibited exceptional performance, achieving an AUC of 0.808 (, ).
Table 4 Performance Evaluation of Six Machine Learning Prediction Models Using 8 Indicators
Figure 4 ROC curves for the validation set model with 8 indicators.
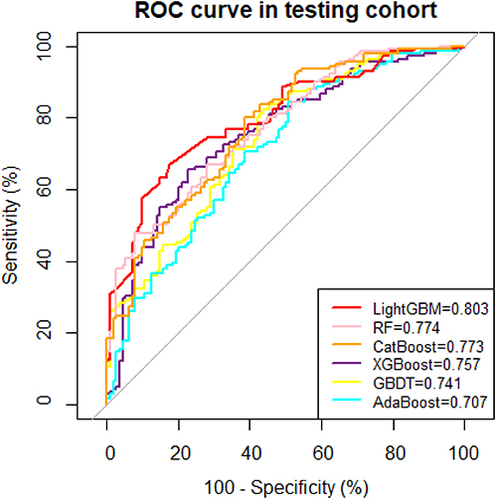
Through meticulous analysis of model configurations with 6, 5, 4, and 3 variables, we observed that reducing the model to 3 key variables (TT, HCT, and PDW) not only maintained outstanding performance but also yielded more intuitive results in reflecting the effectiveness of hypertensive patients when using amlodipine(Table S7, Figure S1). The highlight of this study lies in our successful streamlining of the model structure, focusing attention on essential influencing factors, thereby enhancing the model’s interpretability and practicality. Notably, LightGBM consistently demonstrated the best overall performance, achieving an AUC of 0.803 even with the simplified model structure (, ). This finding further underscores the versatility and robustness of LightGBM, positioning it as a promising candidate for future applications in personalized medicine and precision healthcare.
Table 5 Performance Evaluation of Six Machine Learning Prediction Models Using 3 Indicators
Figure 5 ROC curves for the validation set model with 3 indicators.
SHAP Analysis
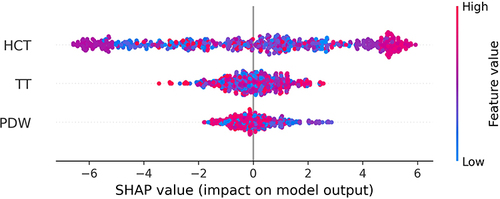
To provide a more comprehensive understanding of the model’s decision-making process, we conducted SHAP interpretability analysis on our LightGBM model, which demonstrated superior performance. This analysis offers valuable insights into the contribution of each feature towards the prediction results, uncovering the critical factors that influence the model’s decisions.
In the SHAP plot, the horizontal axis represents the SHAP values of the model, indicating the impact of each feature on the prediction outcome. The color of the points corresponds to the magnitude of the feature values, with red indicating higher values and blue indicating lower ones. The features are sorted from top to bottom based on their importance, with the most influential features positioned at the top.
In this analysis, HCT emerged as the most significant feature influencing the model’s predictions. Our findings reveal a positive correlation between higher HCT values and better efficacy of amlodipine in hypertensive patients, further validating the importance of HCT levels. This insight underscores the importance of considering HCT levels in predicting the effectiveness of amlodipine treatment in hypertensive individuals ().
Figure 6 SHAP of the LightGBM model.
By integrating the outcomes of the SHAP analysis, we obtain a deeper understanding of the model’s predictions, enabling us to confidently explain its decision-making process. These insights provide actionable information that can guide the refinement of future clinical practices and research directions. Moreover, the validation of the SHAP analysis highlights its crucial role as an interpretative tool, enhancing the transparency and interpretability of the model, thereby fostering trust and confidence in its predictions.
Subgroup Analyses
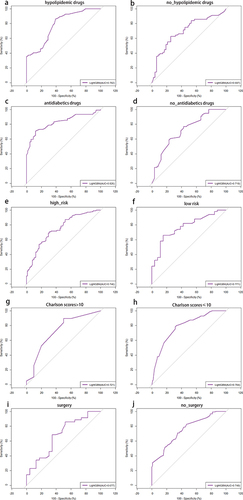
This study established the optimal predictive model, LightGBM, and conducted subgroup analysis to further explore the impact of various factors on the research results, including whether patients received additional drug treatments, belonged to high-risk populations, or underwent surgery or experienced complications during amlodipine treatment. For patients using hypolipidemic drugs, the predictive model demonstrated an accuracy of 0.742, sensitivity of 0.787, specificity of 0.724, and an AUC of 0.782. Conversely, for patients not using hypolipidemic drugs, the model showed slightly lower performance metrics with an accuracy of 0.651, sensitivity of 0.604, specificity of 0.700, and an AUC of 0.697. Similarly, the predictive model’s performance varied based on the usage of antidiabetics drugs, high-risk status, Charlson scores (>10), and whether patients underwent surgery. Overall, these results highlight the impact of different patient characteristics on the predictive model’s performance and underscore the need for personalized treatment approaches in clinical practice. (, )
Table 6 Subgroup Analysis Using LightGBM Model
Figure 7 (a–j) The ROC curves for subgroup analysis based on the LightGBM model.
Discussion
Hospitalized hypertensive patients necessitate antihypertensive drug therapy. As a commonly used hypertension medication, amlodipine not only controls blood pressure over a 24-hour period but also effectively lowers blood pressure, thus preventing strokes and myocardial infarctions. Additionally, amlodipine can effectively manage blood pressure in different racial groups, elderly individuals, diabetic patients, and those with chronic kidney disease without worsening blood glucose levels or kidney function.Citation17 However, existing medication guidelines primarily focus on outpatient hypertension management, lacking specific recommendations for hospitalized patients. Therefore, this study aims to assist physicians in predicting the effectiveness of amlodipine monotherapy in hypertensive patients and improving treatment outcomes. Clinical data from 870 patients were utilized to create six machine learning models predicting the efficacy of amlodipine in hypertensive patients, with LightGBM exhibiting the best overall performance. The efficacy of amlodipine was found to be increased in hypertensive patients with lower PDW values, and higher HCT and TT values.
HCT, or hematocrit, is a whole blood parameter that reflects the ratio between red blood cells and plasma. An elevation in HCT is typically accompanied by high blood viscosity and an increase in the number of red blood cells.Citation24,Citation25 Additionally, increased viscosity is considered to be a determinant of vascular resistance, increasing blood pressure by imposing an additional load on the cardiovascular system.Citation26 The prevalence of hypertension is at least twofold higher in individuals with HCT levels (10 units higher), which is a risk factor for the development of hypertension.Citation25,Citation27 Ravindra’s study indicates that amlodipine can reduce hematocrit (HCT) and blood viscosity, accompanied by blood dilution. This decrease in blood viscosity leads to a significant reduction in blood pressure.Citation28 These findings shed light on the potential mechanism by which amlodipine exerts its antihypertensive effects, modulating both hematocrit levels and blood viscosity to improve blood flow dynamics and lower blood pressure. Considering this dynamic interaction, monitoring HCT levels in hypertensive patients undergoing amlodipine therapy may be essential for optimizing treatment outcomes. Further research is needed to fully understand the precise mechanisms underlying the relationship between altered HCT levels and amlodipine efficacy in hypertension management.
TT refers to the determination of the time required for the onset of fibrin filaments after the addition of a standardized thrombin solution to the plasma under examination. This test serves as an indicator of the anticoagulant substances in the body and is commonly employed to detect abnormalities in fibrinogen levels or the presence of thrombin inhibitors.Citation29,Citation30 A decrease in TT levels indicates a reduction in the concentration of anticoagulant substances.Citation31 In the context of elevated blood pressure, it can lead to the release of relevant coagulation factors, potentially resulting in coagulation dysfunction.Citation32 High blood pressure may affect patients’ coagulation function, increasing the risk of thrombosis and cardiovascular events. Therefore, assessing and monitoring coagulation function may be crucial in the treatment of hypertension. Effective management of blood pressure helps maintain normal coagulation function. Untreated hypertensive patients may have abnormalities in blood coagulation function, as elevated blood pressure may lead to the release of relevant coagulation factors, thereby affecting the body’s coagulation function.Citation33 Amlodipine’s vasodilatory effects may further support this by improving blood flow and reducing the likelihood of thrombotic events. However, while the impact of hypertension on coagulation function is recognized, the correlation between prothrombin time and the effectiveness of antihypertensive drugs remains underexplored. Establishing a causal relationship in this regard requires further validation through prospective cohort studies, which involve observing a group of individuals over time to assess potential causal relationships between variables. Conducting such studies will provide a deeper understanding of how prothrombin time may influence or be influenced by the efficacy of antihypertensive medications. Therefore, future research should focus on addressing this knowledge gap and elucidating the intricate connections between antihypertensive drug efficacy and coagulation parameters as prothrombin time.
Platelet Distribution Width (PDW) is a widely used platelet parameter for assessing platelet volume heterogeneity.Citation34 In individuals with hypertension, elevated pulmonary artery blood pressure can induce vascular endothelial dysfunction, triggering platelet activation. This activation enhances platelets’ propensity to adhere to the endothelium of locally injured pulmonary arteries, thereby promoting thrombus formation. Additionally, PDW anomalies can also be exacerbated by active platelet coagulation or localized thrombosis.Citation35 However, the specific mechanism by which PDW influences the efficacy of amlodipine therapy remains unclear. One potential mechanism is the interaction between platelet activation and endothelial function.Citation36 Elevated PDW levels may indicate increased platelet activation, leading to endothelial dysfunction and impaired nitric oxide production.Citation37 Consequently, this could diminish the vasodilatory effects of amlodipine, thereby limiting its ability to effectively lower blood pressure. Although the importance of platelets in hypertensive disease and their potential contribution to cardiovascular health is well recognized, the effect of PDW on the efficacy of amlodipine remains to be fully explored. Future studies, especially by focusing on PDW and additional studies using a prospective study design, are expected to provide more comprehensive insights that will advance our understanding of the field.
In subgroup analysis, we found that the predictive model performed better in patients receiving other drug treatments, particularly in terms of AUC. This may be attributed to drug interactions or synergistic effects, resulting in a more accurate prediction of amlodipine’s efficacy in these patients. Additionally, we observed a slight decline in the predictive model’s performance in the surgical group and among patients not using lipid-lowering medications, although it still maintained a certain level of accuracy. These findings underscore the importance of individual differences in medical decision-making and provide valuable insights for developing personalized treatment strategies tailored to specific patient populations.
The performance evaluation of the model showed that LightGBM has good comprehensive performance. The LightGBM algorithm is a novel model based on a decision tree algorithm with fast training speed and low memory utilization.Citation38,Citation39 This algorithm is more powerful and efficient than traditional algorithms.Citation40 In a study by Yang et al, LightGBM was employed to investigate the reduction in all-cause in-hospital mortality among critically ill hypertensive patients treated with ACEI/ARB drugs.Citation41
WANG T et al have shown that higher ALT and SBP, as well as lower AST, TBIL, and urea levels, contributed to the classifier’s prediction of amlodipine efficacy.Citation22 However, Liu Chunyu et al’s research identified clinical characteristics such as Cr, FPG, Age, Cys, Urea, HCT, K, HB, TC, PLT, UA, Na, LDL, HDL, and Sex as key factors influencing the efficacy of amlodipine, with creatinine and cystatin C being pivotal in optimizing the effectiveness of most targeted antihypertensive drugs.Citation21 Through comparative analysis with other relevant studies, we have not only identified new key influencing factors but also further emphasized the variability in variables among different studies. These differences may stem from various factors such as research design, sample selection, data collection, and analytical methods. Nonetheless, these discrepancies provide us with additional perspectives and considerations, assisting us in gaining a more comprehensive understanding of the influencing factors and mechanisms of amlodipine’s efficacy. These comprehensive discussions offer significant references for our deeper understanding of the influencing factors and mechanisms of amlodipine’s efficacy, and they also provide more scientific evidence for the formulation of individualized treatment strategies. In future research, further exploration of the interactions and mechanisms between these influencing factors, as well as the investigation of how to optimize amlodipine’s therapeutic effects by adjusting these factors, can contribute to the provision of more precise and effective treatment options for patients with hypertension.
Our study successfully developed six machine learning models to identify the main influences on the success of blood pressure control with amlodipine in patients with primary hypertension as HCT, TT, and PDW. The derived variables were common laboratory and clinical indicators, enhancing the feasibility of implementation. However, the study is subject to several limitations that warrant consideration. Firstly, the evaluation of the antihypertensive effect primarily relies on changes in blood pressure, which may not fully capture other hypertensive damages, such as diastolic function in patients with hypertension-related heart disease. Additionally, the model is based on the short-term effects observed over a five-day period, lacking long-term monitoring results, which may affect the long-term reliability of the findings. Despite our efforts during the study design phase to ensure patients were not prescribed antihypertensive medications or amlodipine prior to admission, the retrospective design introduces the possibility of residual confounding factors related to prior medication use. While we made every effort to mitigate this issue, complete control over this factor was not feasible. This oversight may have introduced confounding factors associated with alternative antihypertensive drug use, potentially skewing the accurate assessment of amlodipine’s efficacy. Moreover, as a retrospective study, it is susceptible to selection bias during the screening of the study population. Therefore, future research should comprehensively consider and control for the use of other antihypertensive medications, while conducting a comprehensive assessment of various hypertensive manifestations beyond changes in blood pressure. Additionally, incorporating long-term monitoring is crucial to ensuring the sustainability of observed effects. Adopting prospective study designs helps reduce selection bias and enhance the robustness of the research findings.
Conclusion
In this study, a prediction model for the efficacy of amlodipine was developed. The findings indicated that hypertensive patients with lower PDW values, and higher HCT and TT values exhibited better efficacy with amlodipine. The integration of demographic characteristics and clinical risk factors aims to predict amlodipine efficacy, facilitating personalized application, particularly in hospitalized hypertensive patients receiving amlodipine monotherapy.
Abbreviations
RDW-CV, red blood cell distribution width; RBC, red blood cell; MCV, mean corpuscular volume; MCH, mean corpuscular hemoglobin; MCHC, mean corpuscular hemoglobin concentration; MPV, mean platelet volume; PDW, platelet distribution width; PLT, platelet count; Hb, hemoglobin concentration; NEUT#, neutrophil count; TT, thrombin time; PT, prothrombin time; HCT, hematocrit; LDL-C, low-density lipoprotein cholesterol; HDL-C, high-density lipoprotein cholesterol; TG, triglycerides; Cr, creatinine; K, serum potassium; Cl, serum chlorine; Na, serum natrium; AST, aspartate aminotransferase; TCHO, total cholesterol;
TBIL, total bilirubin; TP, total protein; Urea, serum urea; UA, serum uric acid.
Ethics Approval and Consent to Participate
The Ethics Committee of Chongqing Medical University has reviewed the proposed use of human subjects in the above mentioned projects. It is recognized that the rights and the welfare of the subjects are adequately protected; the potential risks are outweighed by potential benefits. The Ethics Committee of Chongqing Medical University approved the project implementation according to plan. (Reference Number: 2023034) We confirm that all methods were performed in accordance with the relevant guidelines and regulations. All methods were performed in accordance with the Declaration of Helsinki and the relevant guidelines. Due to all the data were anonymized data in this study, the Ethics Review Committee of Chongqing Medical University has waived the informed consent.
Author Contributions
All authors made a significant contribution to the work reported, whether that is in the conception, study design, execution, acquisition of data, analysis and interpretation, or in all these areas; took part in drafting, revising or critically reviewing the article; gave final approval of the version to be published; have agreed on the journal to which the article has been submitted; and agree to be accountable for all aspects of the work.
Disclosure
The authors declare no conflicts of interest in this work.
Acknowledgments
We acknowledged all the authors in this article.
Data Sharing Statement
The author will provide raw data that supports the conclusions of this article without reservation. Requests to access these datasets should be directed to T.W. (Tingting Wang), [email protected].
Additional information
Funding
References
- Noone C, Dwyer CP, Murphy J. et al. Comparative effectiveness of physical activity interventions and anti-hypertensive pharmacological interventions in reducing blood pressure in people with hypertension: protocol for a systematic review and network meta-analysis. Syst Rev. 2018;7(1):128. doi:10.1186/s13643-018-0791-9
- Franco C, Sciatti E, Favero G, et al. Essential hypertension and oxidative stress: novel future perspectives. Int J Mol Sci. 2022;23(22):14489. doi:10.3390/ijms232214489
- Manosroi W, Williams GH. Genetics of human primary hypertension: focus on hormonal mechanisms. Endocr Rev. 2019;40(3):825–856. doi:10.1210/er.2018-00071
- Lu Z, Teng Y, Wang L, et al. Analysis of the prevalence and related factors of primary hypertension among adolescents and children in the Taicang area. BMC Pediatr. 2023;23(1):265. doi:10.1186/s12887-023-04061-7
- Zheng Y, Cai GY, Chen XM. The enlightenment and thinking of the ISH 2020 global hypertension practice guidelines on the management of renal hypertension in China]. Zhonghua Yi Xue Za Zhi. 2020;100(42):3281–3284. doi:10.3760/cma.j.cn112137-20200519-01579
- Ondimu DO, Kikuvi GM, Otieno WN. Risk factors for hypertension among young adults (18-35) years attending in Tenwek Mission Hospital, Bomet County, Kenya in 2018. Pan Afr Med J. 2019;33:210. doi:10.11604/pamj.2019.33.210.18407
- Whelton PK, Carey RM, Aronow WS, et al. ACC/AHA/AAPA/ABC/ACPM/AGS/APhA/ASH/ASPC/NMA/PCNA guideline for the prevention, detection, evaluation, and management of high blood pressure in adults: a report of the American College of cardiology/American heart association task force on clinical practice guidelines. J Am Coll Cardiol. 2018;71(19):e127–e248. doi:10.1016/j.jacc.2017.11.006
- Gottlieb ER, Gottlieb SS. A retrospective cohort study of the association of inpatient amlodipine dose with renal complication rates and hospital length of stay. Cureus. 2023;15(9):e46237. doi:10.7759/cureus.46237
- Sundström J, Arima H, Jackson R, et al. Effects of blood pressure reduction in mild hypertension: a systematic review and meta-analysis. Ann Intern Med. 2015;162(3):184–191. doi:10.7326/M14-0773
- Penmatsa KR, Teki P, Gupta A. Hypertension in the hospitalized patient: an update. Nefrologia. 2021;41(6):605–611. doi:10.1016/j.nefro.2020.12.020
- Loas G, Van de Borne P, Darquennes G, et al. Association of amlodipine with the risk of in-hospital death in patients with COVID-19 and hypertension: a reanalysis on 184 COVID-19 patients with hypertension. Pharmaceuticals. 2022;15(3):3. doi:10.3390/ph15030380
- Lee JH, Kim KI, Cho MC. Current status and therapeutic considerations of hypertension in the elderly. Korean J Intern Med. 2019;34(4):687–695. doi:10.3904/kjim.2019.196
- Unger T, Borghi C, Charchar F, et al. 2020 international society of hypertension global hypertension practice guidelines. Hypertension. 2020;75(6):1334–1357. doi:10.1161/HYPERTENSIONAHA.120.15026
- Kim DK, Ahn JH, Lee KH. Ambulatory blood pressure response to S-amlodipine in Korean adult patients with uncontrolled essential hypertension: a prospective, observational study. J Clin Hypertens. 2022;24(3):350–357. doi:10.1111/jch.14442
- Syed YY. Perindopril/indapamide/amlodipine in hypertension: a profile of its use. Am J Cardiovasc Drug. 2022;22(2):219–230. doi:10.1007/s40256-022-00521-0
- Ghazi L, Li F, Chen X, et al. Blood pressure response to commonly administered antihypertensives for severe inpatient hypertension. PLoS One. 2022;17(4):e265497. doi:10.1371/journal.pone.0265497
- Wang J-G, Palmer BF, Vogel Anderson K, Sever P. Amlodipine in the current management of hypertension. J Clin Hypertens. 2023;25(9):801–807. doi:10.1111/jch.14709
- Bulsara KG, Cassagnol M. Amlodipine. 2024;1:1.
- Ye C, Fu T, Hao S, et al. Prediction of incident hypertension within the next year: prospective study using statewide electronic health records and machine learning. J Med Internet Res. 2018;20(1):e22. doi:10.2196/jmir.9268
- Amaratunga D, Cabrera J, Sargsyan D, et al. Uses and opportunities for machine learning in hypertension research. Int J Cardiol Hyper. 2020;5:100027. doi:10.1016/j.ijchy.2020.100027
- Chunyu L, Ran L, Junteng Z, et al. Characterizing the critical features when personalizing antihypertensive drugs using spectrum analysis and machine learning methods. Artif Intell Med. 2020;104:101841. doi:10.1016/j.artmed.2020.101841
- Wang T, Yan Y, Xiang S, et al. A comparative study of antihypertensive drugs prediction models for the elderly based on machine learning algorithms. Front Cardiovasc Med. 2022;9:1056263. doi:10.3389/fcvm.2022.1056263
- Wang Y, T XS, Tang Q, et al. A novel consistent random forest framework: Bernoulli random forests. IEEE Trans Neural Netw Learn Syst. 2018;29(8):3510–3523. doi:10.1109/TNNLS.2017.2729778
- Luo M, Chen Y, Cheng Y, et al. Association between hematocrit and the 30-day mortality of patients with sepsis: a retrospective analysis based on the large-scale clinical database MIMIC-IV. PLoS One. 2022;17(3):e265758.
- Emamian M, Hasanian SM, Tayefi M, et al. Association of hematocrit with blood pressure and hypertension. J Clin Lab Anal. 2017;31(6):6. doi:10.1002/jcla.22124
- Taco-Vasquez ED, Barrera F, Serrano-Duenas M, et al. Association between blood viscosity and cardiovascular risk factors in patients with arterial hypertension in a high altitude setting. Cureus. 2019;11(1):e3925. doi:10.7759/cureus.3925
- Cirillo M, Laurenzi M, Trevisan M, et al. Hematocrit, blood pressure, and hypertension. The Gubbio Population Study. Hypertension. 1992;20(3):319–326. doi:10.1161/01.HYP.20.3.319
- Ravindra RP, Arunkumar S, Puniyani RR, et al. Amlodipine alters hemorheological parameters: increased efficacy at the cost of edema? Indian Heart J. 2019;71(1):32–38. doi:10.1016/j.ihj.2018.10.417
- Wada H, Ichikawa Y, Ezaki M, et al. The reevaluation of thrombin time using a clot waveform analysis. J Clin Med. 2021;10(21):21. doi:10.3390/jcm10214840
- Bronić A, Coen HD, Margetić S, et al. Croatian society of medical biochemistry and laboratory medicine: national recommendations for blood collection, processing, performance and reporting of results for coagulation screening assays prothrombin time, activated partial thromboplastin time, thrombin time, fibrinogen and D-dimer. Biochem Med. 2019;29(2):20503.
- Yin X, Yang Z. Efficacy of nifedipine tablets plus aspirin in patients with gestational hypertension and the effect on coagulation function and hemorheology. Am J Transl Res. 2021;13(6):7059–7064.
- Anpalahan A, Anpalahan M. Nocturnal hypertension and abnormal circadian blood pressure patterns in orthostatic hypotension. Intern Med J. 2019;49(9):1191–1192. doi:10.1111/imj.14425
- Vrigkou E, Tsangaris I, Bonovas S, et al. Platelet and coagulation disorders in newly diagnosed patients with pulmonary arterial hypertension. Platelets. 2019;30(5):646–651. doi:10.1080/09537104.2018.1499890
- Li T, Jin J, Meng Z, et al. The different associations between platelet distribution width and hypertension subtypes in males and females. Biosci Rep. 2020;40(11). doi:10.1042/BSR20201747.
- Vagdatli E, Gounari E, Lazaridou E, et al. Platelet distribution width: a simple, practical and specific marker of activation of coagulation. Hippokratia. 2010;14(1):28–32.
- Kaur R, Kaur M, Singh J. Endothelial dysfunction and platelet hyperactivity in type 2 diabetes mellitus: molecular insights and therapeutic strategies. Cardiovasc Diabetol. 2018;17(1):121. doi:10.1186/s12933-018-0763-3
- Platelet Activation Mechanisms and Consequences of Immune Thrombocytopenia. Cells. 2021;10(12):1.
- Rufo DD, Debelee TG, Ibenthal A, et al. Diagnosis of diabetes mellitus using gradient boosting machine (LightGBM). Diagnostics. 2021;11(9). doi:10.3390/diagnostics11091714.
- Wang J, Zheng T, Liao Y, et al. Machine learning prediction model for post- hepatectomy liver failure in hepatocellular carcinoma: a multicenter study. Front Oncol. 2022;12:986867. doi:10.3389/fonc.2022.986867
- Xue Y, Chen S, Zhang M, et al. The prediction models for high-risk population of stroke based on logistic regressive analysis and lightgbm algorithm separately. Iran J Public Health. 2022;51(5):999–1009. doi:10.18502/ijph.v51i5.9415
- Yang B, Xu S, Wang D, et al. ACEI/ARB medication during icu stay decrease all-cause in-hospital mortality in Critically III patients with hypertension: a retrospective cohort study based on machine learning. Front Cardiovasc Med. 2021;8:787740. doi:10.3389/fcvm.2021.787740