
 ?Mathematical formulae have been encoded as MathML and are displayed in this HTML version using MathJax in order to improve their display. Uncheck the box to turn MathJax off. This feature requires Javascript. Click on a formula to zoom.
Abstract
Purpose
Currently cardiovascular diseases (CVDs) are the main cause of death worldwide. Disease risk estimates can be used as prognostic information and support for treating CVDs. The commonly used Framingham risk score (FRS) for CVD prediction is outdated for the modern population, so FRS may not be accurate enough. In this paper, a novel CVD prediction system based on machine learning is proposed.
Methods
This study has been conducted with the data of 689 patients showing symptoms of CVD. Furthermore, the dataset of 5,209 CVD patients of the famous Framingham study has been used for validation purposes. Each patient’s parameters have been analyzed by physicians in order to make a diagnosis. The proposed system uses the quantum neural network for machine learning. This system learns and recognizes the pattern of CVD. The proposed system has been experimentally evaluated and compared with FRS.
Results
During testing, patients’ data in combination with the doctors’ diagnosis (predictions) are used for evaluation and validation. The proposed system achieved 98.57% accuracy in predicting the CVD risk. The CVD risk predictions by the proposed system, using the dataset of the Framingham study, confirmed the potential risk of death, deaths which actually occurred and had been recorded as due to myocardial infarction and coronary heart disease in the dataset of the Framingham study. The accuracy of the proposed system is significantly higher than FRS and other existing approaches.
Conclusion
The proposed system will serve as an excellent tool for a medical practitioner in predicting the risk of CVD. This system will be serving as an aid to medical practitioners for planning better medication and treatment strategies. An early diagnosis may be effectively made by using this system. An overall accuracy of 98.57% has been achieved in predicting the risk level. The accuracy is considerably higher compared to the other existing approaches. Thus, this system must be used instead of the well-known FRS.
Introduction
As per the World Health Organization (WHO), the main cause of mortality worldwide is due to cardiovascular diseases (CVDs). According to the WHO report, in the year 2008 approximately 17.3 million people died due to CVDs, which is 30% of all global deaths and by 2030, the total number of deaths will increase up to 23.6 million, mainly from heart disease and stroke.Citation1
At present, the deaths occur due to lack of early medical diagnosis of CVDs, thereby posing a big challenge to health care organizations. Correct and timely diagnosis of patients is required for effective treatment and for quality service. The decisions are currently based on the experience and understanding of the doctor, instead of intelligent tools. To overcome this problem, the approach of combining clinical decision making supported by computer based patient records has been proposed by Wu et al.Citation2 The main aim of the present approach was to minimize the possibilities of error in doctors’ inference and decisions, which may also be safer for patients.Citation2
These days, some sort of information systems are being used by many hospitals to manage patients’ information, but these systems are not used for clinical decision making. Many researchers have proposed CVD prediction systems based on different approaches. Khatibi and Montazer proposed a fuzzy-evidential based CVD prediction system in the year 2010, with which they have achieved accuracy of 91.58%.Citation3 Akay proposed the neural network based coronary artery disease prediction system in 1992. They used 100 patient records for testing and achieved accuracy of 84% by using the data of clinical tests.Citation4 The Bayesian classification and neural network based ischemic heart disease prediction system have been proposed by Kukar et al in 1999. They have used electrocardiogram (ECG) data as input for prediction.Citation5 The probability theory (logistic regression) based angiographic coronary disease system has been proposed by Detrano et al in 1989. They have collected the data of 425 patients and achieved accuracy of 77%. The clinical and noninvasive test data have been used in the system for prediction.Citation6
To overcome the above gaps, an intelligent heart disease prediction system is proposed here, which uses the heart disease databases with quantum neural network (QNN) to make intelligent clinical decisions which cannot be done in traditional decision support systems.Citation7 In this paper, the proposed system based on QNN has been compared with the Framingham risk score (FRS) using the same parameters as used in FRS.
Related work – FRS
The parameters used for FRS are sex, age, total cholesterol (TC), high density lipoprotein (HDL), systolic blood pressure, diastolic blood pressure, diabetes mellitus, body mass index (BMI), and smoking.Citation8 The data of a group of patients were collected in the 1960s and 1970s and these data are used in the Framingham equations. Since then the cases of coronary heart disease (CHD) mortality have been decreasing.Citation9 The lifestyle and other risk factors have been changed, which affected the rate of CHD. The FRS is outdated for the modern population. So the FRS is not accurate enough.
Common risk factors used in FRS and proposed system
The details of common risk factors that are used in FRS and in the proposed system are as follows.
Sex
According to research, males are at greater risk of CVD than pre-menopausal females. Females after menopause are in the same risk category of CVD as males. On the other hand, the risk of stroke is equal for males and females.Citation10–Citation12
Age
The risk of CVD increases with the age. According to studies, after the age of 65 years, 80% of deaths occur due to heart disease. With the increase in age, our heart does not work properly.Citation10
TC
Elevated level of total blood cholesterol is one of the major causes of CVD.Citation13 As blood cholesterol increases, the risk of CVD increases. shows the various risk levels for TC.
Table 1 Risk levels for total cholesterol
HDL
Abnormality of HDL may increase the risk of atherosclerosis, risk levels are shown in . According to research, the HDL level is a strong, independent inverse predictor of CVD.Citation14–Citation16
Table 2 Risk levels for high density lipoprotein
Blood pressure
It is the most important risk factor of heart diseases. Globally, various epidemiological studies have identified the direct relation between blood pressure elevation and rate of coronary artery disease and stroke.Citation17–Citation19 It has also been identified that, the combined effect of multiple risk factors causes an increased risk.Citation20 The normal blood pressure range according to age is shown in .
Table 3 Blood pressure range according to age
Diabetes mellitus
Diabetes is also one of the most important risk factors of heart diseases. It increases the risk of CVD. According to the Rancho Bernardo Study, diabetes increases the risk of CVD up to 1.9 times in males and 3.3 times in females.Citation21 This study had been performed for 14 years on approximately 2,400 persons. The relation between diabetes and CVD is not uniform in all populations.Citation22,Citation23
BMI
The BMI index is a statistical measurement. It shows the ratio between weight and height,Citation24 as shown in .
Table 4 BMI range
Smoking
It is one of the most important factors which increase the risk of myocardial infarction (MI). Different research studies show that smoking/tobacco use increases the risk of MI.Citation25 Proving the harmful effects of light smoking with adequate accuracy requires large cohort studies and only few studies have attempted this.Citation26,Citation27 According to studies, smoking is the main cause of 50% of deaths unrelated to CVD, which are avoidable and only one half of deaths happen due to CVD.Citation28–Citation31
Proposed CVD prediction system
The proposed system provides a comprehensive predictive tool for predicting the CVD risk. This system predicts CVD at an early stage. The clinicians, doctors, pathologists as well as general public may use this tool very easily. It predicts the chances of CVD using the physical tests for CVD. Using this tool, the clinicians may fulfill their promises and commitments for ensuring the sustained fight against this deadly disease. The activity diagram showing the structure of the proposed model is shown in . The CHD forecast based on a study by IndrayanCitation32 showed the number of cases, both male and female, of CHD in India (). Here, in the proposed system for prediction, only the factors considered in the FRS have been considered here.
Figure 1 Activity diagram of proposed system.
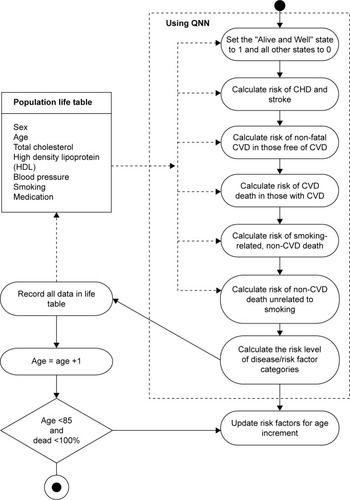
Table 5 Forecast of number of cases (both male and female) of CVD in India
Materials and methods
The current study has been conducted during 2009 to 2015 on a cohort of CVD patients aged 20 years and above. During data collection, the personal details of patients were not collected. To build a knowledge based CVD prediction system, the QNN has been used in this approach for better adaptability and classification. This study has been conducted after the approval of Thapar University Research Board (TURB), who deemed that the patients’ consent was not required for using retrospective/existing cohort without any identifiers linking to individuals.
Data description – patients’ data
This study has been conducted with the data of 689 patients, showing the symptoms of CVD. The parameters of every individual patient have been diagnosed and analyzed by the three individual physicians. In , the various input parameters are shown, which have been used for prediction of heart disease and used in the FRS. The FRS is designed for adults, ie, aged 20 years and above. The training and evaluation was performed with the help of a cardiologist/physician. The data consist of patients’ records with doctors’ predictions/diagnosis. The whole dataset is divided into training, validation, and testing. Furthermore, for validation purpose, the dataset of the famous Framingham study conducted on 5,209 CVD patients, was taken from the University of Washington, Seattle, WA, USA.Citation33
Table 6 Input parameters
QNN used for CVD prediction system
QNN based on multi-level transfer function was introduced by Karayiannis et al.Citation34–Citation36 In comparison with artificial neural network, the hidden units of QNN use the nonlinear activation functions instead of linear, as used in artificial neural network. Here, the nonlinear activation function consists of linear superposition of multi-sigmoid function. In the recent past, various models of QNN have been used in other research areas such as, prediction of weather, disease diagnosis, voice recognition, and machine translation.Citation34–Citation38 In such manner, more states can be expressed in a hidden layer neural cell in comparison to traditional sigmoid function in which only two states may be expressed.
Algorithm for training the QNN
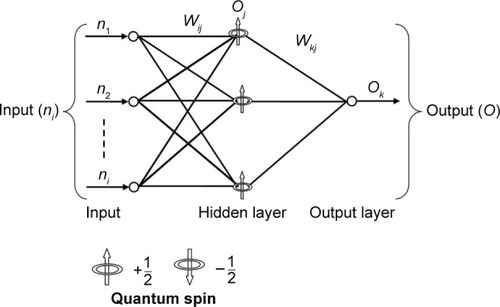
The QNN with input, output, and hidden units are shown in . Here, only one hidden layer has been used. Every node of hidden layer represents three sub-states in itself with the difference of quantum interval θr with quantum level r. Let us assume that ns denotes the number of grades or excitation levels, η is learning rate which is a small random value, δk is error rate of output layer, and δj error rate of hidden layer; where ni denotes the input to the input layer; Oj and Ok denote the output of hidden and output layer, respectively. The weights between input and hidden layers are denoted by Wij and the weights between hidden and output layers are denoted by Wkj.Citation37–Citation41
Figure 2 Architecture of quantum neural network.
The initial weights are small random numbers and t denotes target value. Given R training pairs {n1, t1; n2, t2; nR, tR}; where ni (J × 1) is input and ti (K × 1) is target values for given inputs, as shown in .
The error signal term of the output (δk) and hidden layers (δj) are written as,
(1)
(2)
Consequently, output layer weights
and hidden layer weights
are adjusted as,
(3)
(4)
The simple sigmoid function has been used as the activation function from input to hidden layer and is expressed as:
(5)
The sigmoid function with various graded levels has been used as the activation function for each hidden neuron, ie, from hidden to output layer is expressed as follows:
(6)
After i iterations, when minimum possible error is obtained, then increase quantum interval by very small quantum interval Δθ
(7)
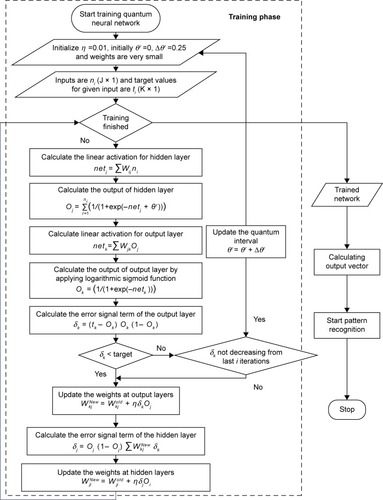
The step by step details of the above discussed algorithm is expressed by in the flowchart shown in .
Figure 3 Flowchart of quantum neural network for heart disease prediction system.
Experiments and result
During the training process of QNN, the best possible weights have been identified for each node of every layer by conducting the different experiments as shown in . The whole dataset has been randomly divided and selected into training set, validation set, and test set as shown in .
Table 7 Data partition set
The architecture of the QNN consists of seven input nodes, 85 hidden nodes, and one output node as shown in . The numbers of hidden nodes have been identified after several experiments. During our study, we have consulted several physicians and identified four groups of risk categories according to percentage level as “normal”, “low risk range”, “intermediate risk range”, and “highest risk range”. The percentage for each level is shown in .
Table 8 Percentage level of risk categories
During training of the proposed system, we presumed the baseline values of all the risk parameters, these values are identified on the basis of our study and consulting physicians, as shown in . The baseline value varies on the basis of “age and gender category”.Citation42 In our study, we presumed if the values lie up to baseline values, the patient should be treated as a healthy person without CVD.
Table 9 Baseline value of parameters
To attain maximum performance, fine-tuning of the network architecture was performed. Particularly, number of nodes in the hidden layer was adjusted for QNN. In this study, we have only considered the risk factors used in FRS, significant for CVD. After analysis of patients’ data, the patients may be categorized on the basis of reference range.
The collected patient information indicated that 63% of them were suffering from high blood pressure followed by 23% with normal blood pressure, and 8% with lower blood pressure. Twenty-seven percent of these patients exhibited increased HDL while 73% had low HDL. Similarly, 82% of the patients exhibited TC in higher range as exhibited in .
Table 10 Percentage-wise patient distribution for various risk factors
Besides the earlier discussed parameters, 75.65% of patients were nonsmokers and 24.35% were smokers. An amount of 85.50% of patients were on medication and 14.50% were not taking any medication, as shown in .
Table 11 Percentage-wise patient distribution for smoking and being on medication
Out of 689 patients’ data, the data of 250 CVD patients with the doctors’ diagnoses (predictions) were collected for evaluation and validation purposes. The proposed system achieved 98.57% accuracy in predicting the level of CVD risk in patients. The result of our proposed system is significantly higher than the other existing approaches as shown in .
Table 12 Comparison of the results of the proposed algorithm with similar algorithms
It is evident that FRS is a commonly used method by doctors/practitioners worldwide for the prediction of CVDs. We carried out a comparison of our system with the FRS method. The same dataset was used for comparison of both the systems. The tool for FRS is available at http://cvrisk.mvm.ed.ac.uk/calculator/calc.asp.Citation43 As discussed earlier, the FRS is outdated in the present scenario, and has many drawbacks as it underestimates the risk. This tool is not designed for a person below 20 years of age.
The proposed system based on QNN shows an average accuracy of 98.57% using the same data used for FRS accuracy prediction level, as shown in . shows the accuracy graph of the proposed system.
Figure 4 Graph showing accuracy of proposed system and Framingham risk score (FRS).
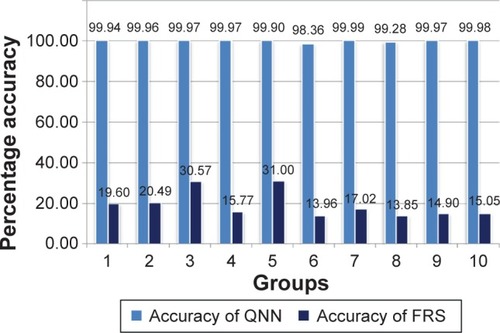
Table 13 Data showing comparison of the proposed system and FRS of random testing on different experimental values
The proposed system has been tested and validated using the dataset of the famous Framingham study. The dataset of 5,209 CVD patients of the Framingham study has been taken from the University of Washington, Seattle, WA, USA (http://courses.washington.edu/b513/datasets/datasets.php?class=513).Citation33 The test results also confirm the effectiveness of the proposed system, as shown in .
Table 14 Validation based on the dataset from the Framingham study of 5,209 American CVD patients
In the Framingham study dataset, out of 5,209 patients, 378 deaths were recorded due to MI and 605 due to CHD. Out of the 378 deaths due to MI, 32.93% of patients had a very high risk prediction and 41.46% had an intermediate risk prediction, only 25.62% of patients had a low risk prediction. In case of deaths recorded due to CHD, out of 605 patients, 37.17% had a high risk prediction and 43.77% an intermediate risk prediction, while 19.06% were placed in the low risk category by the proposed system. In general, all the recorded cases of death were predicted to be at risk by the proposed system, out of which approximately 77% of deaths were predicted as very high risk category and only 23% were predicted as low risk. Here, in one of the most important causes for mortality, it must be taken into consideration that medication can affect mortality even though the patient is at low risk. The CVD risk predictions by the proposed system, using the dataset of the Framingham study, confirmed the potential risk of death, deaths which actually occurred and had been recorded as due to MI in the dataset of the Framingham study.
Discussion
The FRS and European heart score are commonly used methods which are considered as most effective methods for CVD risk prediction. However, these methods have some major drawbacks such as being less accurate and based on a very old study conducted in the 1960s wherein the parameters taken into consideration were also limited. The validity of the Framingham equation is undetermined as the lifestyle of the population has changed completely. The newly available risk parameters are not included. On the other hand, these systems are based on conventional statistical methods and are not updated with time according to changed environmental and lifestyle conditions. Presently, the accuracy of the FRS is only 19.22%, as evaluated and compared with the proposed system using the same data. The major drawbacks of these studies are their ineffectiveness with regard to value ranges, ie, the FRS is only applicable for patients aged 20 to 100 years and the maximum threshold limit of CVD risk is 30%.
On the other hand in European heart score, if blood pressure is over 180 mmHg or cholesterol over 8 mmol/L, patients are automatically classified as high risk without considering the medication factor.Citation44 In many situations, with proper and effective medication, a patient with high risk parameters such as blood pressure, cholesterol, may survive for a very long time.
Other than the FRS and European heart score, the fuzzy-evidential based CVD prediction system has been proposed by Khatibi and Montazer in 2010, but they have achieved only 91.58% accuracy.Citation3 Akay proposed the neural network based coronary artery disease prediction system in 1992, achieved an accuracy of 84%, and used the records of 100 patients for testing, but they have only considered the clinical parameters.Citation4 The Bayesian classification and neural network based ischemic heart disease prediction system was proposed by Kukar et al in 1999, but in their study, ECG data were used as input parameter for prediction.Citation5 The probability theory (logistic regression) angiographic coronary disease based system was proposed by Detrano et al in 1989, they collected the data of 425 patients and achieved only 77% accuracy. In their study, only clinical and noninvasive test data were considered as input parameters for their system.Citation6
In the current study, we have introduced a new machine learning based system which uses the QNN for learning and for its knowledge buildup. On the basis of knowledge gained from data patterns, the proposed system predicts the CVD risk with very high accuracy and is able to update itself with time. Over a period of time, as the data increase, it will update and correct itself on the basis of the current trends and data pattern.
The proposed CVD system has been tested and validated using Indian patients’ data and American patients’ data, and achieved the highest accuracy among existing systems.
Conclusion
As compared and evaluated during experiments, the proposed CVD prediction system shows the best results on the dataset used, when compared to the FRS. This system has been evaluated and validated with the data of patients and the doctors’ diagnoses (predictions). This system will be serving as an aid to medical practitioners in planning better medication strategies. An early diagnosis may be effectively performed by using this system. Data showing prediction accuracy of random testing on different experimental values are shown in . In predicting the risk level, an overall accuracy of 98.57% has been achieved by the proposed system, whereas with the FRS the highest level of accuracy was 19.22%. This system’s accuracy is considerably higher compared to other existing approaches. Thus, this system must be used instead of well-known FRS. Hence, the proposed system will serve as a significant tool for doctors/practitioners.
Acknowledgments
The authors would like to thank Dr Praveen Garg, cardiologist of Rameshwar Das Memorial Hospital, Jagadhri, India for his valuable guidance and continued support throughout the work.
Disclosure
The authors report no conflicts of interest in this work.
References
- who.int/en/ [homepage on the Internet]Cardiovascular diseases (CVDs) Fact sheet N°317WHO2013 [updated January 2015]. Available from: http://www.who.int/mediacentre/factsheets/fs317/en/index.htmlAccessed May 27, 2016
- WuRPetersWMorganMWThe next generation clinical decision support: linking evidence to best practiceJ Healthc Inf Manag2002164505512365300
- KhatibiVMontazerGAA fuzzy-evidential hybrid inference engine for coronary heart disease risk assessmentExpert Syst Appl2010371285368542
- AkayMNoninvasive diagnosis of coronary artery disease using a neural network algorithmBiol Cybern19926743613671515514
- KukarMKononenkoIGroseljCKraljKFettichJAnalysing and improving the diagnosis of ischaemic heart disease with machine learningArtif Intell Med1999161255010225345
- DetranoRJanosiASteinbrunnWInternational application of a new probability algorithm for the diagnosis of coronary artery diseaseAm J Cardiol19896453043102756873
- NarainRSaxenaSGoyalAKCardiovascular Disease Prediction based on Physical factors using Quantum Neural NetworkInternational Journal of Information Processing2014838394
- MainousAG3rdKoopmanRJDiazVAEverettCJWilsonPWTilleyBCA coronary heart disease risk score based on patient reported informationAm J Cardiol20079991236124117478150
- CapewellSFordESCroftJBCritchleyJAGreenlundKJLabartheDRCardiovascular risk factor trends and potential for reducing coronary heart disease mortality in the United States of AmericaBull World Health Organ201088212013020428369
- Lloyd-JonesDMLarsonMGBeiserALevyDLifetime risk of developing coronary heart diseaseLancet19993539147899210023892
- LegatoMJPadusESlaughterEWomen’s perceptions of their general health with special reference to their risk of coronary artery disease: results of a national telephone surveyJ Womens Health1997621891989140853
- PiloteLHlatkyMAAttitudes of women toward hormone therapy and prevention of heart diseaseAm Heart J19951296123712387754968
- EzzatiMHoornSVRodgersAEstimates of global and regional potential health gains from reducing multiple selected major risk factorsLancet2003362938027128012892956
- AssmannGSchulteHvon EckardsteinAHuangYHigh-density lipoprotein cholesterol as a predictor of coronary heart disease risk. The PROCAM experience and pathophysiological implications for reverse cholesterol transportAtherosclerosis1996124SupplS11S208831911
- TurnerRCMillnsHNeilHARisk factors for coronary artery disease in non-insulin dependent diabetes mellitus: United Kingdom Prospective Diabetes Study (UKPDS: 23)BMJ199831671348238289549452
- GordonTCastelliWPHjortlandMCKannelWBDawberTRHigh density lipoprotein as a protective factor against coronary heart disease. The Framingham StudyAm J Med1977625707714193398
- McMahonRPetoRCuttlerJBlood pressure, stroke and coronary heart disease. Part 1, Prolonged differences in blood pressure: prospective observational studies corrected for the regression dilution biasLancet199033586927657741969518
- KannelWBBlood pressure as a cardiovascular risk factor: prevention and treatmentJAMA199627520157115768622248
- WalkerWGNeatonJDCutlerJANeuwirthCohenJDRenal function change in hypertensive members of the Multiple Risk Factor Intervention Trial. Racial and treatment effects. The MRFIT Research GroupJAMA199226821308530911433739
- AndersonKMWilsonPWOdellPMKannelWBAn updated coronary risk profile. A statement for health professionalsCirculation19918313563621984895
- Barrett-ConnorELCohnBAWingardDLEdelsteinSLWhy Is diabetes mellitus a stronger risk factor for fatal ischemic heart disease in women than in men? The Rancho Bernardo StudyJAMA199126556276311987413
- American Diabetes AssociationDetection and management of lipid disorders in diabetesDiabetes Care19931658288348495626
- HeadJFullerJHInternational variations in mortality among diabetic patients: the WHO Multinational Study of Vascular Disease in DiabeticsDiabetologia19903384774812210120
- DudinaACooneyMTBacquerDDRelationships between body mass index, cardiovascular mortality, and risk factors: a report from the SCORE investigatorsEur J Cardiovasc Prev Rehabil201118573174221642320
- TverdalAThelleDStensvoldILerenPBjartveitKMortality in relation to smoking history: 13 years’ follow-up of 68,000 Norwegian men and women 35–49 yearsJ Clin Epidemiol19934654754878501474
- DollRPetoRWheatleyKGrayRSutherlandIMortality in relation to smoking: 40 years’ observations on male British doctorsBMJ199430969599019117755693
- WillettWCGreenAStampferMJRelative and absolute excess risks of coronary heart disease among women who smoke cigarettesN Engl J Med198731721130313093683458
- RosengrenAWilhelmsenLWedelHCoronary heart disease, cancer and mortality in male middle-aged light smokersJ Intern Med199223143573621588259
- BartechiCEMacKenzieTDSchrierRWThe human costs of tobacco useN Engl J Med19943309079128114863
- MacKenzieTDBartechiCESchrierRWThe human costs of tobacco useN Engl J Med19943309759808121461
- MansonJETostesonHRidkerPMThe primary prevention of myocardial infarctionN Engl J Med199232621140614161533273
- IndrayanAForecasting vascular disease cases and associated mortality in IndiaNCMH Background Papers-Burden of disease in India20059198215
- Biostat 513 Datasets [database on the Internet]University of Washington Available from: http://courses.washington.edu/b513/datasets/datasets.php?class=513Accessed May 29, 2016
- ZhouJGanQKrzyzakASuenCYRecognition of handwritten numerals by quantum neural network with fuzzy featuresInt J Doc Anal Recognit199923036
- KarayiannisNBMukherjeeAGloverJRAn evaluation of quantum neural networks in the detection of epileptic seizures in the neonatal electroencephalogramSoft Comput2006104382396
- KarayiannisNBMukherjeeAGloverJRDetection of pseudosinusoidal epileptic segments in the neonatal EEG by cascading a rule-based algorithm with a neural networkIEEE Trans Biomed Eng200653463364116602569
- NarayanRChakravertySSinghVPMachine translation using quantum neural network for simple sentencesInternational Journal of Information and Computation Technology201337683690
- NarayanRSinghVPChakravertySQuantum neural network based machine translator for Hindi to EnglishScientificWorldJournal2014201448573724977198
- NarayanRSinghVPChakravertySQuantum Neural Network based Parts of Speech Tagger for HindiInternational Journal of Advancements in Technology201452137152
- NarayanRChakravertySSinghVPNeural Network based Parts of Speech Tagger for Hindi. Proceedings of 3rd International conference, Advances and control and Optimisation of dynamical systems, Kanpur, India, March 13–15, 2014Kanpur, Indiaproceedings of IFAC-Elsevier2014
- NarayanRChakravertySSinghVPQuantum neural network based machine translator for English to HindiApplied Soft Computing20163810601075
- SchaeferJELamon-FavaSCohnSDEffects of age, gender, and menopausal status on plasma low density lipoprotein cholesterol and apolipoprotein B levels in the Framingham Offspring StudyJ Lipid Res19943557797928071601
- Cardiovascular Risk CalculatorThe University of Edinburgh [updated: May 19, 2010]. Available from: http://cvrisk.mvm.ed.ac.uk/calculator/calc.aspAccessed May 29, 2016
- European Society of Cardiology [homepage on the Internet]HeartScore Available from: https://escol.escardio.org/heartscore/download.aspxAccessed May 29, 2016