
Abstract
Background
The purpose of using preventative inhaled treatments in cystic fibrosis is to improve health outcomes. Therefore, understanding the relationship between adherence to treatment and health outcome is crucial. Temporal variability, as well as absolute magnitude of adherence affects health outcomes, and there is likely to be a threshold effect in the relationship between adherence and outcomes. We therefore propose a pragmatic algorithm-based clustering method of objective nebulizer adherence data to better understand this relationship, and potentially, to guide clinical decisions.
Methods to cluster adherence data
This clustering method consists of three related steps. The first step is to split adherence data for the previous 12 months into four 3-monthly sections. The second step is to calculate mean adherence for each section and to score the section based on mean adherence. The third step is to aggregate the individual scores to determine the final cluster (“cluster 1” = very low adherence; “cluster 2” = low adherence; “cluster 3” = moderate adherence; “cluster 4” = high adherence), and taking into account adherence trend as represented by sequential individual scores. The individual scores should be displayed along with the final cluster for clinicians to fully understand the adherence data.
Three illustrative cases
We present three cases to illustrate the use of the proposed clustering method.
Conclusion
This pragmatic clustering method can deal with adherence data of variable duration (ie, can be used even if 12 months’ worth of data are unavailable) and can cluster adherence data in real time. Empirical support for some of the clustering parameters is not yet available, but the suggested classifications provide a structure to investigate parameters in future prospective datasets in which there are accurate measurements of nebulizer adherence and health outcomes.
Introduction
Cystic fibrosis (CF) is a multisystem condition due to a genetic defect resulting in dysfunctional cystic fibrosis transmembrane conductance regulator (CFTR) protein.Citation1 The lungs are the main organ affected – people with CF are vulnerable to recurrent infection, which leads to progressive lung damage and respiratory failure.Citation1 Median survival has improved from ~6 months when CF was first recognized in 1938 to around 45–50 years due to improved treatment options and quality of care,Citation2,Citation3 but ~80% of all mortality in CF is still due to respiratory failure.Citation4 An important maintenance treatment in CF is therefore inhaled therapies typically consisting of nebulized antibiotics and mucolytics, which have been proven to be efficacious in maintaining lung health.Citation5,Citation6 We have described this as “efficacious” rather than “effective”, since adherence in randomized controlled trials is 80%–100%,Citation7 whereas real world data among adults with CF suggest that adherence is less than 50%.Citation8,Citation9 Such low levels of adherence limit the benefits derived from the new inhaled therapies that have been introduced over the past 20 years, despite the efforts of clinicians who are prescribing more of these to people with CF.Citation10,Citation11
The importance of increasing adherence to inhaled therapies is widely recognized among the CF community.Citation12 An important step in developing strategies to improve adherence is the accurate quantification of adherence level, so that change can be measured and understood.Citation13 In CF, the technology to accurately capture date- and time-stamped objective adherence data with tamper-proof chipped nebulizers is available for clinical use.Citation14,Citation15 However, data still need to be analyzed with the appropriate methods to quantify adherence accurately. We have recently published a methodology paper to explain the methods of calculating “normative adherence”, which better reflects treatment effectiveness compared to unadjusted adherence, by taking into account characteristics of a person with CF when defining the minimum required treatment regime.Citation16 In this paper, we explain the rationale for clustering adherence data and present a pragmatic, algorithm-based method for clustering objective adherence data downloaded from chipped nebulizers.
We acknowledge that clustering will typically involve judgment, and different judgments may create different clusters. We have made judgments driven by a pragmatic approach to data that allow data to be clustered readily in routine practice with the aim of generating a systematic clustering strategy, that then can be subjected to empirical testing in prospective data and a paper doing this will follow.
The purpose of clustering adherence data
Nebulizer adherence is a behavior, and the study of behavior has traditionally involved either group-level comparison (nomothetic approach) or analysis of individual-level longitudinal data (idiographic approach).Citation17 Each approach has advantages and disadvantages. The nomothetic approach allows us to understand average behavior across the population.Citation18 However, the average group result may conceal important granular details crucial to the understanding of the behavior of individuals,Citation18 hence the increasing interest in the use of idiographic approach within health psychology.Citation19 Although everyone may have unique behavioral patterns, clustering offers a compromise between the nomothetic and idiographic approaches, by identifying individuals with patterns of behavior that can be mapped within homogenous subgroups (clusters) that can accommodate a number of individuals with patterns that are similar enough to allow meaningful groupings.Citation18 This allows homogenous subgroups to be studied, which may identify generalizable trends with a better understanding of how that relates to the group and to individuals.
Clustering of objective nebulizer adherence would involve the categorization of continuous data. This may be perceived as wasting valuable information and reducing statistical power for comparison.Citation20 However, it has been argued that loss of information is small if there is an adequate number of categories to represent the continuous variable.Citation20 A common reason for categorizing a continuous variable is to study the association between variables that are not linearly related.Citation21 The fundamental purpose for supporting nebulizer adherence among adults with CF is to improve health outcomes, yet there is most likely a threshold effect for nebulizer adherence in relation to health outcomes. Increasing adherence from 1% to 5% would be a 5-fold increase, yet such a low level of adherence is not associated with good health outcomes.Citation9,Citation22 Similarly, a 5-fold increase in adherence from 90% to 450% is unlikely to give additional benefits. However, a 5-fold increase in adherence from 20% to 100% is very likely to have clinical benefits by reducing the frequency of pulmonary exacerbations and decreasing healthcare costs.Citation9,Citation22 Given the likely threshold effect of nebulizer adherence, clustering adherence data makes sense when we are analyzing data, to better understand the relationship between adherence levels and the expected health benefits. Indeed, it is anticipated that clustering of adherence data will allow more meaningful levels of adherence targets to be set by helping us to understand how much treatment is enough. In addition, adherence clusters might well allow clinicians to make a better judgment of the cause for deterioration in lung health based on objective nebulizer adherence data.
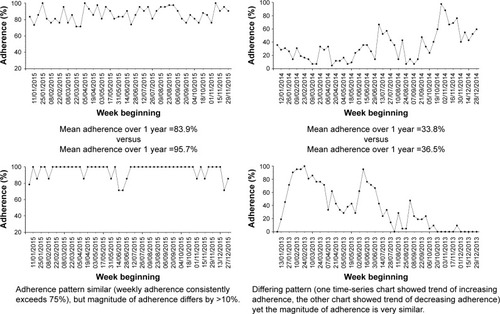
Previous studies have demonstrated that health benefits of medication adherence are likely to depend on both the magnitude and the variability of adherence.Citation23,Citation24 Yet, adherence levels are typically quantified in terms of the magnitude only, partly because some methods of capturing adherence data, eg, pharmacy refill data, could not identify variation in medication use.Citation25 The availability of tamper-proof chipped nebulizers in CF means that detailed date- and timestamped adherence data are available to study the pattern of adherence.Citation26 We provide examples of different time-series adherence patterns in to highlight the importance of quantifying both the magnitude and the variability in adherence. By identifying different clusters of adherence pattern taking into account both the magnitude and variability, there is potential for determining the level of adherence that is needed to improve health outcomes, or to potentially target appropriate adherence interventions.
Figure 1 Examples of time-series adherence charts to highlight the importance of considering both the magnitude and the variability of adherence.
Criteria for the methods used to cluster adherence data
Several methods are available for clustering time-series adherence data,Citation27 and the purpose of clustering should be taken into account when selecting the appropriate clustering method. Given that the magnitude and variability of adherence may influence health outcomes, it will be important that both magnitude and variability are taken into account in the clustering method.
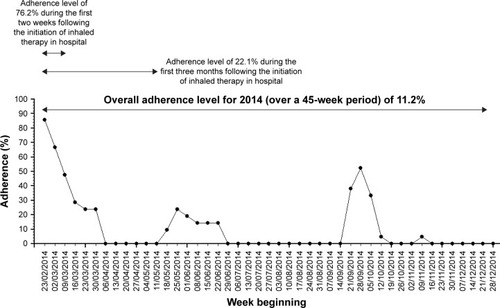
For a clustering method to help guide day-to-day clinical management of people with CF (eg, by setting an adherence target or in understanding the likely contribution of nebulizer adherence to lung function decline in someone reviewed in a CF clinic), an important practical consideration is the ability to cluster adherence data in real time. Another equally important consideration is to avoid a clustering method where the addition of data from new subjects could alter the cluster of previously clustered subjects. Finally, the clustering method will be most useful if it can be applied for all available adherence data. For example, if a clustering method required 12 months of data – not everyone will have complete annual adherence data – some may be started on inhaled treatment in the middle of the year, and missing data may occasionally occur, eg, due to machine malfunction or saturation of electronic data capture capacity. Data imputation to infer complete annual adherence is difficult since data are not missing at random.Citation28 Since adherence in long-term conditions will tend to decrease with time,Citation29,Citation30 when only a short duration of data are available there is a risk of overestimating the long-term adherence rate. In , we illustrate an example of high adherence level following initiation of inhaled therapy that then declined, demonstrating the potential for error if short runs of adherence data are used to infer overall steady state or customary adherence. We have chosen to use a minimum period of 3 months to ensure that the adherence classification takes into account a period of time that is long enough to reflect a meaningful period of adherence behavior likely to have a reasonable probability of having some relationship with lung health.
Figure 2 An example of the impact of using different data duration to infer the annual adherence level.
Processing time-series adherence data for clustering
All clustering methods require a clustering technique/algorithm and the relevant variables from a dataset for clustering. For time-series data, there are three broad approaches to “process” the variables for clustering: use the actual time-series pattern (ie, raw data-based), use summary measures derived from the time-series data (ie, feature-based), and use model parameters from time-series data or identify different time-series model (ie, model-based).Citation31
Existing techniques to cluster “processed” time-series adherence data
Most clustering techniques can be applied for any of the three approaches for processing time-series data. Several techniques for clustering data exist.
An example of a data-driven clustering technique is the “principal components analysis” (PCA), which uses orthogonal transformations to combine a group of correlated variables into linear functions of these which are uncorrelated.Citation32 PCA has also been applied to time-series adherence data to identify different adherence clustersCitation33 and can work with either of the three different variable approaches. An argument to support the use of data-driven clustering methods is the lack of need for a priori assumptions which may introduce bias. However, it is important to note that assumptions are still needed in terms of deciding which variables are clinically important enough to be analyzed with the data-driven clustering method. Indeed, three different studies aiming to identify phenotypes of COPD using different clinical variables have yielded different groups of clusters.Citation34 It should be noted that the generation of different clusters is not necessarily a problem if the clusters’ validity in terms of predicting outcomes can be empirically tested in prospective datasets. Hence the main issue is identifying a rational and reproducible approach to generate clusters that can be used in clinical practice, and is then suitable for empirical confirmation in prospective data-sets. Data-driven methods also tend to require complete data for cluster analysis (eg, only 92 of the 124 eligible participants in the study by Yeo et al were analyzed due to missing data),Citation33 which is a disadvantage when nebulizer adherence datasets are of varying duration and imputation is difficult due to the missing not at random nature of adherence data. Perhaps the biggest disadvantage of a data-driven clustering technique is with clustering data from new subjects in real time. Regularly repeating the clustering process with the introduction of any data from new subjects is not an option, since that could assign a previously clustered dataset to new clusters. Therefore, the only practical way to use data-driven clustering methods in a clinical context is to cluster a representative sample of adherence dataset to generate rules to define newly acquired adherence data into existing clusters. However, rules based on time-series pattern (or even time-series summary measures) may not be straightforward to apply, so this would introduce subjectivity in defining the cluster for new adherence data and also potentially result in difficulty of dealing with new adherence data that were deemed “unclassifiable” within the existing rules.
There are also other data-driven clustering techniques designed specifically to deal with time-series adherence data. An example is the Typology of Temporal Patterns approach, which uses dynamic cluster analysis to identify different adherence clusters based on the raw treatment adherence time-series pattern.Citation18 However, the methods also have similar disadvantages to using PCA to cluster time-series adherence data, ie, the need for equal adherence data duration, and it is difficult to perform the clustering in real time.
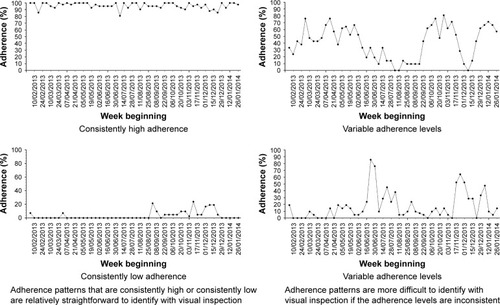
An alternative clustering technique for time-series data is using visual inspection to identify different adherence patterns.Citation35 Visual inspection could be criticized as being subjective, but is used in practice, eg, almost all radiology images are read and interpreted by clinicians based on pattern recognition from visual inspection.Citation36 This is nonetheless a labor-intensive process that also requires significant investment in staff training in order to reliably cluster adherence data with visual inspection. Whilst some adherence patterns are relatively easy to identify with visual inspection, there are other more ambiguous patterns whereby visual inspection is less useful ().
Figure 3 Examples of adherence patterns that are relatively easy and those that are more difficult to identify with visual inspection.
A brief description of our proposed adherence data clustering method
Given the limitations of the current available techniques to cluster objective nebulizer adherence data, we propose an algorithm-based clustering method which is able to handle adherence data of varying duration (including dataset with missing data) without the need for imputation. The proposed method also allows for real-time clustering of new adherence data, taking into account both the magnitude and variation in adherence. The clustering method consists of three separate steps, which we describe in the next section. We also provide exemplar cases to illustrate how the proposed clustering method can be applied.
As outlined previously, there is no perfect way to cluster adherence data in a clinical context, however, the approach we have adopted allows us to use reproducible methods to generate adherence clusters that can then be explored empirically in prospective datasets in terms of the relationship between adherence and health outcomes (eg, frequency of pulmonary exacerbations).
Using an algorithm-based method to cluster objective nebulizer adherence data
We describe each step involved in clustering adherence data using our proposed algorithm-based method and summarize the steps involved in . The time-series charts displayed in are for illustrative purpose only – adherence data can be clustered with the described method by calculating normative adherence for 3-monthly sections without plotting time-series charts.
Figure 4 Summary of the steps involved in clustering adherence data using our proposed algorithm-based technique.
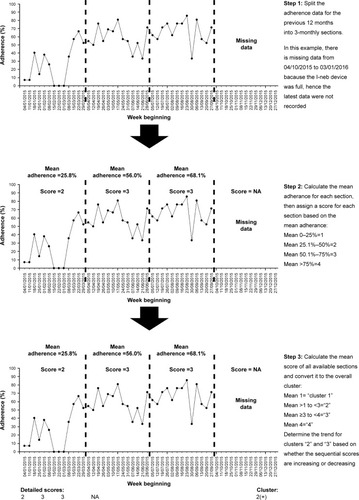
Step 1: splitting the previous 12 months of adherence data into 3-monthly sections
Splitting annual adherence data into four 3-monthly sections is an empirical approach that balances the tension between detecting variation in adherence over time, whilst sampling enough sustained behavior to create an expectation that the behavior might be related to other downstream effects such as lung health. It also allows people who have less data to be clustered using the same technique with a minimum data capture period of only 12 weeks required to classify people’s behavior.
The 3-monthly period represents a good compromise between detail and practicality. Shorter periods of adherence (eg, monthly) preserves more information but as demonstrated in , short runs of adherence data may poorly reflect the underlying adherence patterns that might be expected to relate to more distal outcomes such as lung health. For example, short time periods may be prone to overestimating underlying adherence if particularly good periods of adherence, eg, when people are hospitalized, comprise most of the relatively short segment of data analyzed. On the other hand, splitting the adherence data into longer periods (eg, 6 months) would produce insufficient numbers of sections to understand the variation of adherence over a 1-year period and also mean ignoring a subgroup of people with only 3–6 months’ worth of adherence data in any given 1-year period.
Step 2: assigning each 3-month section with a score for the mean adherence level of that section
The mean normative adherenceCitation16 for each 3-monthly section should be calculated. This allows each section to be scored based on mean adherence, with mean adherence of 0 to 25% assigned a score of “1”, mean adherence of 25.1% to 50% assigned a score of “2”, mean adherence of 50.1% to 75% assigned a score of “3”, and mean adherence of 75.1% or above assigned a score of “4”.
Step 3: aggregating the scores of each 3-monthly section to determine the final cluster and displaying the results
People with 12 months of adherence data over the previous year will thus have four sections, while people with 3 months of adherence data will have one section. The mean score for all the sections in the previous year is grouped to determine the adherence cluster. A mean score of 1 defines cluster “1”. A mean score of >1 but <3 defines cluster “2”. A mean score of ≥3 to <4 defines cluster “3”. A mean of score of 4 defines cluster “4”. In effect, all the mean scores are rounded down to the nearest whole number to determine the overall cluster, except for scores between 1.1 and 1.9 that were rounded up to “2”. The purpose of aggregating the scores in this manner is to separate the group with consistently high adherence (cluster “4” can only be achieved if all sections are scored “4”) and the group with consistently low adherence (cluster “1” can only be achieved if all sections are scored “1”). This is consistent with the groups that are easily identifiable with visual inspection of time-series pattern as described in .
We recognize that those with moderate adherence (clusters “2” and “3”) may well display a trend of increasing or decreasing adherence with time. The trend is relevant for clinicians when monitoring the adherence of people with CF. For example, people with declining adherence require diagnosis for the cause of adherence decline and the necessary intervention, whereas people with a trend of improving adherence may only require regular adherence feedback and encouragement. The trend can be understood if all the individual scores for each section are displayed along with the overall cluster score. For example, someone with sequential section scores of “1”, “2”, “2”, and “3” would have an overall cluster labeled “2”, and the trend of improving adherence is apparent. On the other hand, someone with sequential section scores of “4”, “4”, “2”, and “1” would also have an overall cluster labeled “2”, but a trend of declining adherence is present. For convenience, an improving trend can be denoted with a “+” sign after the cluster number and a declining trend can be denoted with “−” sign whilst the “o” sign can be used to denote the lack of any obvious trend. The person with sequential section scores of “1”, “2”, “2”, and “3” would therefore be in cluster “2(+)”, whilst the person with sequential section scores of “4”, “4”, “2”, and “1” would therefore be in cluster “2(−)”. By taking into account the possible adherence trends for clusters “2” and “3”, there are in effect eight different clusters – “1”, “2(−)”, “2(o)”, “2(+)”,“3(−)”, “3(o)”, “3(+)”, and “4”. However, in terms of analyzing the effect of adherence on health outcomes, we anticipate that only four different clusters (“1” to “4”) matter, since the number of exacerbations will probably even out over a 1-year period (those with declining adherence are more likely to have exacerbations during the latter part of the period, while those with improving adherence are more likely to have exacerbations during the earlier part of the period).
Another important reason for displaying all the individual section scores is to make clear the amount of adherence data that are available for the previous 12 months, so that clinicians can make a better judgment regarding the adherence status of a person with CF. For example, someone with sequential section scores of “4”, “4”, “4”, and “4” would be in the same cluster as someone with only 3 months of high adherence (ie, sequential section scores of “NA”, “NA”, “NA”, and “4”). A clinician interpreting the cluster scores can be confident that the first individual has stable and high adherence over a 12-month period, whereas the second individual only has 3 months’ worth of adherence data.
Practical examples of clustering adherence data using the algorithm-based method
We present three examples to illustrate the use of our proposed algorithm-based method to cluster adherence data. These examples are summarized in and . All the time-series charts displayed () are for illustrative purposes only and are not an essential component of the clustering process.
Figure 5 Weekly normative adherence time-series charts for the three example cases.
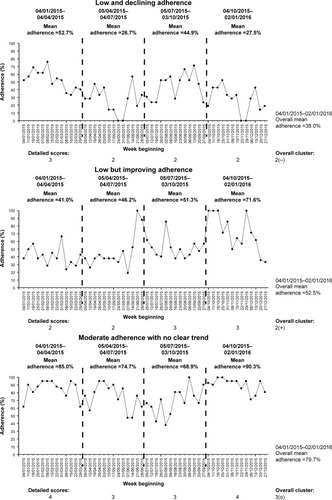
Table 1 Summary of the adherence clusters for the three example cases
Example A: low and declining adherence
Person A () is in his early 40s and has chronic Pseudomonas in 2015 based on the Leeds definition.Citation37 He has pancreatic insufficiency and CF-related diabetes. His best FEV1 in 2015 was 64% and he required 35 days of intravenous antibiotics throughout 2015. His nebulized treatments prescription consisted of once-daily dornase alfa and twice-daily colistimethate sodium alternating every 4 weeks with twice-daily tobramycin.
He has a complete 12 months’ worth of adherence data in 2015 from the week beginning 04/01/2015 to week beginning 27/12/2015, with an overall normative adherence of 38.0%. During the first 3 months of the period, his normative adherence was 52.7%, but his subsequent 3-monthly adherence levels were 26.7%, 44.9%, and 27.5%. He therefore scored “3” for his first 3-month section and “2” for the next three sections. This indicates a trend of decline in his adherence. His mean cluster score is 2.25, which equates to an overall cluster of “2”. Given the trend of decline, his overall detailed cluster is therefore “2(−)”.
Person A therefore has a low adherence with a trend of decline in his adherence for the 12-month period throughout 2015.
Example B: low but improving adherence
Person B () is in his mid-30s, has pancreatic insufficiency, and also has chronic Pseudomonas in 2015 based on the Leeds definition.Citation37 His best FEV1 in 2015 was 78% and he required 33 days of intravenous antibiotics throughout 2015. He was on once-daily dornase alfa, along with twice-daily nebulized colistimethate sodium alternating every 2 weeks with twice-daily nebulized tobramycin.
He has a complete 12 months’ worth of adherence data in 2015 from the week beginning 04/01/2015 to week beginning 27/12/2015, with an overall normative adherence of 52.5%. During the first half of 2015, his 3-monthly normative adherence levels were 41.0% and 46.2%. His adherence levels continue to improve throughout 2015 to 51.3% during the third quarter and 71.6% during the final quarter of 2015. He therefore scored “2” for both 3-month sections during the first half of 2015 and “3” for both 3-month sections during the second half of 2015. This indicates a trend of improvement in his adherence. His mean cluster score is 2.5, which is rounded down to “2” for his overall cluster. Given the trend of improving adherence, his overall detailed cluster is therefore “2(+)”.
Person B therefore has an overall low level of adherence, but there is a trend of improving adherence during the 12-month period throughout 2015. Compared to Person A, Person B’s adherence has a different trend, which illustrates the ability of the proposed clustering method to account for both the variation and magnitude of objective nebulizer adherence.
Example C: moderate adherence with no clear trend
Person C ) is in her early 20s and has chronic Pseudomonas in 2015 based on the Leeds definition.Citation37 She has pancreatic insufficiency and CF-related diabetes. Her best FEV1 in 2015 was 65% and she required 30 days of intravenous antibiotics throughout 2015. Throughout 2015, she was on once-daily dornase alfa and twice-daily nebulized colistimethate sodium.
She has a complete 12 months’ worth of adherence data in 2015 from the week beginning 04/01/2015 to week beginning 27/12/2015, with an overall normative adherence of 79.7%. During the first 3 months of the period, her normative adherence was 85.0%. Her 3-monthly adherence subsequently declined to 74.7% and 68.9%, before improving again to 90.3% during the last quarter of 2015. She therefore scored “4” for her first 3-month section, “3” for the next two sections, and “4” for the final section in 2015. This indicates no clear trend in her adherence over the 12-month period (initial decline followed by subsequent improvement). Her mean cluster score is 3.5, which is rounded down to “3” for her overall cluster. Given the lack of trend, her overall detailed cluster is therefore “3(o)”.
Person C therefore has a moderate adherence without a clear trend for the 12-month period throughout 2015. This example illustrates that it is possible to have relatively high overall nebulizer adherence of ~80%, yet there can be periods whereby adherence levels are relatively lower, hence the importance to understanding adherence over time.
Discussion
We have described a pragmatic algorithm-based clustering technique that can be used in real time and can also cluster adherence data with varying data duration. The clustering technique consists of three related steps: splitting the data into 3-monthly sections, scoring each section based on mean adherence, and aggregating the scores to determine the overall cluster. This clustering technique recognizes the two distinct groups of adherence archetype – consistently low adherence (“cluster 1”, very low adherence) and consistently high adherence (“cluster 4”, high adherence). “Cluster 2” (low adherence) and “cluster 3” (moderate adherence) have more ambiguous patterns on visual inspection, and adherence data in those clusters can also display variation with time. “Cluster 2” and “cluster 3” are therefore separated into three different groups, each based on adherence trend (improving adherence, declining adherence, and no obvious trend).
Clustering of adherence data into the described categories, along with the “detailed” individual section scores, allows the adherence results and data completeness to be easily interpreted. In addition to potentially guiding the management of individual adults with CF, the categorization of adherence data also allows clinicians to gain a better understanding of the overall nebulizer adherence within their specialist CF centers. The usual summary measures for a continuous variable (eg, mean or median) do not readily inform clinicians regarding the distribution of the adherence levels within their center. For example, it is possible to achieve a mean adherence of 50% if everyone in that center has adherence of 50%, but mean adherence of 50% can also be achieved if 50% of the people in a particular center has mean adherence of 100%, while the other 50% has adherence of 0%. With the proposed clustering method, clinicians can identify the proportions of people in their center with “very low”, “low”, “moderate”, or “high adherence”. This also allows center comparisons using funnel plots to drive quality improvement initiatives,Citation38,Citation39 by comparing the proportion of high adherence for the different specialist CF centers.
The proposed algorithm-based clustering method can be automated; hence the clustering can be delivered within routine clinical practice via a software package. Objective adherence data captured from routinely available chipped nebulizers should be stored in a secure data repository, and the data in a repository can then be clustered using a software package. We proposed clustering nebulizer data as a starting point since objective data can already be captured within routine clinical practice.Citation14,Citation15 CF is a multisystem condition; hence the treatments are also necessarily multimodal, including physiotherapy for airway clearance, pancreatic enzyme replacement, nutritional supplementation, and management of CF-related diabetes.Citation1 As technology advances, it is likely that most of the other CF treatments would also be chipped to routinely capture objective adherence data. For example, chipped airway clearance devices and chipped pill bottles (eg, Medication Event Monitoring System) have been used to objectively monitor adherence among people with CF in a research setting.Citation40,Citation41 The algorithm we described is versatile and can also be used to cluster adherence data from other devices.
The proposed clustering method does have some limitations. In studying variation over time, we proposed aggregating time-series adherence data into 3-monthly sections based on a balance between granularity and practicality. In addition, nebulized therapy in CF tends to have benefit that accumulates over time rather than instantaneously, and 3 months is a credible period over which effects might be apparent. Theory dictates that time-series data aggregated over longer periods (eg, over months) will lose more information compared to fine-grained (eg, weekly) analysis.Citation42,Citation43 There is thus uncertainty regarding the optimal period for aggregating adherence data to minimize information loss on data variation, and to avoid results being skewed by unpredictable short-term events, while keeping the clustering process simple enough. Similarly, there is also uncertainty regarding the optimal levels of scoring to assign to each 3-monthly section. We proposed an equal 4-level scoring system (from 1–4) because there is some evidence that adherence levels need to exceed 75% for good health outcomes.Citation9,Citation22 With our proposed system, mean adherence of 26% is scored the same as mean adherence of 50%. Increasing the number of scores (eg, using a 10-level scoring system instead) or changing the width of each score band could provide greater granularity and identify more subgroups,Citation20 but at the cost of increased complexity. It is crucial to acknowledge the need to achieve a balance between “lumping” and “splitting” in cluster analysis. Identifying many different subgroups may not be that useful if the different subgroups behave similarly or respond similarly to different treatments.Citation44 A pragmatic way to resolve the uncertainty regarding the aggregation period, level of scoring, and total number of adherence clusters that is clinically useful would be to test the variations of the proposed clustering method (eg, 2-monthly aggregation instead of 3-monthly aggregation, or scoring adherence over ten levels instead of four levels) in a well-defined prospectively collected adherence dataset linked to health outcomes. Indeed, the nebulizer adherence intervention randomized control trial funded by the National Institute of Health ResearchCitation45 would provide a suitable dataset for fine-tuning the proposed clustering method.
In conclusion, we have proposed a pragmatic clustering method for objective nebulizer adherence data that could potentially improve the understanding of the relationship between adherence and health outcomes, allow center comparison with funnel plots, and also guide clinical decisions when monitoring adherence. Cluster analysis of adherence data in CF has been attempted using self-report data.Citation46 The advantages of using objective adherence data for clustering include better accuracy and the ability to study adherence variability in detail.Citation8,Citation26 There is uncertainty regarding some of the parameters chosen for this proposed method of clustering, but these parameters can be fine-tuned using a well-defined adherence dataset linked to health outcomes.
Disclosure
This report is independent research arising from a Doctoral Research Fellowship (Zhe Hui Hoo, DRF-2014-07-092), supported by the National Institute for Health Research. The views expressed in this publication are those of the authors and not necessarily those of the National Health Service, the National Institute for Health Research, or the Department of Health.
Rachael Curley received support from Zambon and Philips Respironics for a parallel research study monitoring inhaled adherence. Martin J Wildman received funding from Zambon and support from Philips Respironics for the same study. This has not had any direct influence on this submitted paper. Martin J Wildman has worked with Pari to carry out studies using the chipped E-flow (e-track). Michael J Campbell reports no conflicts of interest in this work.
References
- DaviesJCAltonEWBushACystic fibrosisBMJ200733576321255125918079549
- BurgelPRBellisGOlesenHVFuture trends in cystic fibrosis demography in 34 European countriesEur Respir J201546113314125792639
- ElbornJSPersonalised medicine for cystic fibrosis: treating the basic defectEur Respir Rev2013221273523457158
- MartinCHamardCKanaanRCauses of death in French cystic fibrosis patients: The need for improvement in transplantation referral strategies!J Cyst Fibros201615220421226391389
- RyanGSinghMDwanKInhaled antibiotics for long-term therapy in cystic fibrosisCochrane Database Syst Rev20113CD00102121412868
- YangCChilversMMontgomeryMNolanSJDornase alfa for cystic fibrosisCochrane Database Syst Rev20164CD00112727043279
- PugatschTShoseyovDCohen-CymberknohMAdherence pattern to study drugs in clinical trials by patients with cystic fibrosisPediatr Pulmonol201651214314626583331
- DanielsTGoodacreLSuttonCPollardKConwaySPeckhamDAccurate assessment of adherence: self-report and clinician report vs electronic monitoring of nebulizersChest2011140242543221330381
- QuittnerALZhangJMarynchenkoMPulmonary medication adherence and health-care use in cystic fibrosisChest2014146114215124480974
- DasenbrookECKonstanMWVanDevanterDRAssociation between the introduction of a new cystic fibrosis inhaled antibiotic class and change in prevalence of patients receiving multiple inhaled antibiotic classesJ Cyst Fibros201514337037525496726
- KonstanMWVanDevanterDRRasouliyanLTrends in the use of routine therapies in cystic fibrosis: 1995–2005Pediatr Pulmonol201045121167117220717935
- RiekertKAEakinMNBilderbackARidgeAKMarshallBCOpportunities for cystic fibrosis care teams to support treatment adherenceJ Cyst Fibros201514114214825459564
- McNabbWLAdherence in diabetes: can we define it and can we measure it?Diabetes Care19972022152189118777
- GellerDEMadgeSTechnological and behavioral strategies to reduce treatment burden and improve adherence to inhaled antibiotics in cystic fibrosisRespir Med2011105Suppl 2S24S3122208547
- SandsDSapiejkaEMazurekHGaszczykGUse of an electronic monitoring system to generate objective information on patients’ adherence to taking treatments of a novel inhaled tobramycin solution (VANTOBRA)J Cyst Fibros201312Suppl 1S66
- HooZHCurleyRCampbellMJWaltersSJHindDWildmanMJAccurate reporting of adherence to inhaled therapies in adults with cystic fibrosis: methods to calculate “normative adherence”Patient Prefer Adherence20161088790027284242
- Castro-SchiloLFerrerEComparison of nomothetic versus idiographic-oriented methods for making predictions about distal outcomes from time series dataMultivariate Behav Res201348217520726741724
- BabbinSFVelicerWFAloiaMSKushidaCAIdentifying longitudinal patterns for individuals and subgroups: an example with adherence to treatment for obstructive sleep apneaMultivariate Behav Res20155019110826609745
- JohnstonDWJohnstonMUseful theories should apply to individualsBr J Health Psychol201318346947323724956
- AltmanDGRoystonPThe cost of dichotomising continuous variablesBMJ20063327549108016675816
- MacCallumRCZhangSPreacherKJRuckerDDOn the practice of dichotomization of quantitative variablesPsychol Methods200271194011928888
- EakinMNBilderbackABoyleMPMogayzelPJRiekertKALongitudinal association between medication adherence and lung health in people with cystic fibrosisJ Cyst Fibros201110425826421458391
- Pollock-BarzivSMFinkelsteinYManlhiotCVariability in tacrolimus blood levels increases the risk of late rejection and graft loss after solid organ transplantation in older childrenPediatr Transplant201014896897521040278
- VenkatVLNickTGWangYBucuvalasJCAn objective measure to identify pediatric liver transplant recipients at risk for late allograft rejection related to non-adherencePediatr Transplant2008121677218186891
- IngerskiLMHenteEAModiACHommelKAElectronic measurement of medication adherence in pediatric chronic illness: a review of measuresJ Pediatr2011159452853421722917
- BallRSouthernKWMcCormackPDuffAJBrownleeKGMcNamaraPSAdherence to nebulised therapies in adolescents with cystic fibrosis is best on week-days during school term-timeJ Cyst Fibros201312544044423369661
- ZolhavariehSAghabozorgiSTehYWA review of subsequence time series clusteringScientificWorldJournal2014201431252125140332
- HooZHCurleyRCampbellMJWildmanMJThe importance of data completeness in determining centre–level nebuliser adherence ratesPediatr Pulmonol201651S45448449
- ManingatPGordonBRBreslowJLHow do we improve patient compliance and adherence to long-term statin therapy?Curr Atheroscler Rep201315129123225173
- StoneVEStrategies for optimizing adherence to highly active anti-retroviral therapy: lessons from research and clinical practiceClin Infect Dis200133686587211512092
- LiaoTWClustering of time series data – a surveyPattern Recognit2005381118571874
- JoliffeITMorganBJPrincipal component analysis and exploratory factor analysisStat Methods Med Res19921169951341653
- YeoSCisewskiJLockEFMarronJSExploratory analysis of exercise adherence patterns with sedentary pregnant womenNurs Res201059428028720585224
- WeatherallMShirtcliffePTraversJBeasleyRUse of cluster analysis to define COPD phenotypesEur Respir J201036347247420930198
- AloiaMSGoodwinMSVelicerWFTime series analysis of treatment adherence patterns in individuals with obstructive sleep apneaAnn Behav Med2008361445318726659
- EdwardsMLawsonZMorrisSThe presence of radiological features on chest radiographs: how well do clinicians agree?Clin Radiol201267766466822342102
- LeeTWBrownleeKGConwaySPDentonMLittlewoodJMEvaluation of a new definition for chronic Pseudomonas aeruginosa infection in cystic fibrosis patientsJ Cyst Fibros200321293415463843
- SpiegelhalterDJFunnel plots for comparing institutional performanceStat Med20052481185120215568194
- PierottiLMohammedMAWildmanMJUsing funnel plots to make meaningful centre comparisonsThorax201570Suppl 3A187A188
- HooZHDanielsTBradleyJMHellerBRoseCWildmanMJFeasibility study to objectively measure airway clearance technique in cystic fibrosisJ Cyst Fibros201413Suppl 2S30
- SiracusaCMRyanJBurnsLElectronic monitoring reveals highly variable adherence patterns in patients prescribed ivacaftorJ Cyst Fibros201514562162626074007
- ChengTAdepejuMModifiable temporal unit problem (MTUP) and its effect on space-time cluster detectionPLoS One201496e10046524971885
- RossanaRJSeaterJJTemporal aggregation and economic time seriesJ Bus Econ Stat1995134441451
- von CoellnRShulmanLMClinical subtypes and genetic heterogeneity: of lumping and splitting in Parkinson diseaseCurr Opin Neurol201629672773427749396
- Development and evaluation of an intervention to support Adherence to treatment in adults with Cystic Fibrosis (ACtiF)The University Of Sheffield. Health Services Research Available from: https://www.sheffield.ac.uk/scharr/sections/hsr/mcru/actifAccessed Dec 31, 2016
- GrossoehmeDHSzczesniakRDBrittonLLAdherence determinants in cystic fibrosis: cluster analysis of parental psychosocial, religious, and/or spiritual factorsAnn Am Thorac Soc201512683884625803407