
 ?Mathematical formulae have been encoded as MathML and are displayed in this HTML version using MathJax in order to improve their display. Uncheck the box to turn MathJax off. This feature requires Javascript. Click on a formula to zoom.
Abstract
Purpose
Diabetes is a chronic condition that is more prevalent among people with lower educational attainment. This study assessed the treatment preferences of patients with type 2 diabetes by educational attainment.
Methods
Patients with type 2 diabetes were recruited from a national online panel in the US. Treatment preferences were assessed using a discrete-choice experiment. Participants completed 16 choice tasks in which they compared pairs of treatment profiles composed of six attributes: A1c decrease, stable blood glucose, low blood glucose, nausea, treatment burden, and out-of-pocket cost. Choice models and willingness-to-pay (WTP) estimates were estimated using a conditional logit model and were stratified by educational status.
Results
A total of 231 participants with a high school diploma or less education, 156 participants with some college education, and 165 participants with a college degree or more completed the survey. Participants with a college degree or more education were willing to pay more for A1c decreases ($58.84, standard error [SE]: 10.6) than participants who had completed some college ($28.47, SE: 5.53) or high school or less ($17.56, SE: 3.55) (p≤0.01). People with a college education were willing to pay more than people with high school or less to avoid nausea, low blood glucose events during the day/night, or two pills per day.
Conclusion
WTP for aspects of diabetes medication differed for people with a college education or more and a high school education or less. Advanced statistical methods might overcome limitations of stratification and advance understanding of preference heterogeneity for use in patient-centered benefit–risk assessments and personalized care approaches.
Introduction
The association between educational attainment and health outcomes is well known.Citation1–Citation3 In addition to life expectancy,Citation4 education is associated with numerous mental and physical health outcomes, including diabetes.Citation5 Diabetes is a chronic disease that affects 29.1 million people (9.3%) and is the seventh leading cause of death in the US.Citation6 Individuals with lower income and less education are two to four times more likely to develop diabetesCitation7 and more likely to be affected by diabetes complications.Citation8 While the prevalence of diabetes has gone up over time among all educational groups, diabetes remains more prevalent among people with lower educational attainment.Citation9 In addition, treatments, such as intensive lifestyle interventions and medications,Citation10 can be more effective in people with higher educational attainment resulting in improved health outcomes.
The association between education and health outcomes has been explained in several ways in the health economics literature.Citation3,Citation8 Schooling might increase the efficiency with which someone becomes and remains healthy.Citation11 For example, a person with more schooling might recognize symptoms of an illness more quickly and therefore receive treatment more quickly. Schooling may affect how quickly people can obtain and process new information related to health care.Citation12 Schooling might affect how well people follow and manage health care-related instructions, such as treatment guidelines.Citation8,Citation13,Citation14 Schooling may also broaden social networks, including access to physicians.Citation15 In the reverse association, health outcomes might influence educational attainment; people with poor health outcomes might have lower levels of education.Citation16–Citation18 This association is less likely to hold in the case of type 2 diabetes because type 2 diabetes is generally diagnosed later in adulthood when education has been completed.Citation19,Citation20
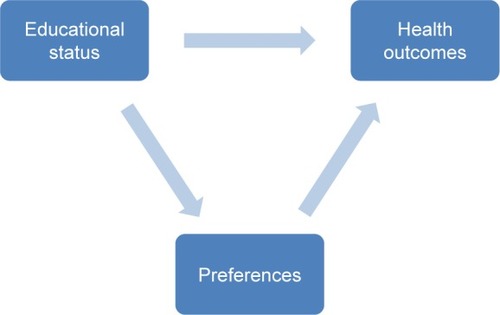
The education–health association might be mediated by treatment preferences (). Educational attainment can affect treatment preferencesCitation21,Citation22 and preference stability.Citation23 Furthermore, patients’ preferences might affect health outcomes. When patients’ preferences are accommodated, greater adherence to therapyCitation24 or feelings of control and greater health-related quality of life might result.Citation25 In diabetes, time preference for the future is significantly related to diabetes complications.Citation8 A link between patient preferences for treatment burden and adherence to diabetes medications has been shown.Citation26,Citation27 In addition, when physicians met their patients’ preferences for information, patients with type 2 diabetes attained better metabolic control, self-reported adherence, and treatment satisfaction.Citation28
Figure 1 Conceptual model of relationship between educational attainment, preferences, and health outcomes.
Educational attainment has been shown to influence people’s preferences for different types of diabetes self-management programs.Citation29,Citation30 However, the link between education and treatment preferences in diabetes needs to be further explored. In a preference study on diabetes treatment, Guimarães et al found that income was related to treatment preferences, but they did not find this link between educational attainment and treatment preferences.Citation31 However, another preference study published by Hauber et al did find a difference in treatment preferences between people with some college education and no college education.Citation27
This study examined the link between educational attainment and treatment preferences for type 2 diabetes medication by estimating separate willingness-to-pay (WTP) models for people who had completed high school or less education, who had completed some college, and who had completed college or more education. We hypothesize that people with more education are willing to pay more for diabetes medication. Understanding treatment preferences and WTP of patients with different levels of educational attainment might aid in informing and targeting patient-centered policies, treatment, and education efforts. The study illustrates an increasingly important research method for the measurement of patient preference and illustrates an approach to examine preference heterogeneity. In addition, it quantifies the preferences of patients with type 2 diabetes across the benefits, risks, and treatment burden of anti-glycemic medications.
Methods
Stated-preference methods are increasingly used to measure preferences of stakeholders in health care and to inform health care decision making.Citation32 In this study, treatment preferences for different aspects of diabetes medication were measured using a discrete-choice experiment (DCE). DCEs are one of the most common form of stated-preference methods, and guidelines have emerged for utilizing them.Citation33–Citation35 Our approach was consistent with existing guidelines and is summarized under four headings: conceptual model, creation of the choice tasks, survey respondents, and statistical analysis.
Creation of the DCE choice tasks
Treatment preferences for different aspects of diabetes medication were measured using a DCE. In a DCE, it is assumed that a treatment profile (in this case diabetes medication) is defined by a variety of characteristics, or attributes that can exist at different levels. Treatment profiles all contain the same attributes, but these attributes will present at varying levels. Respondents are asked to complete several choice tasks in which they are presented with one or more distinct treatment profiles. In these choice tasks, they are asked to select the treatment profile that they prefer more than the other profile(s). Based on participants’ repeated choices, the relative preferences for the different attributes and levels can be estimated. An example of a DCE choice task is shown in .
Figure 2 Example of a discrete-choice experiment choice task.
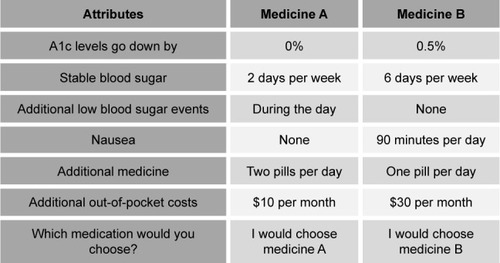
This DCE was specifically developed for the purposes of this study. The development process made use of a rigorous engagement process that included synthesis of the existing evidence, expert consultations, stakeholder engagement, qualitative pretest interviews (n=25), and quantitative pilot testing (n=27).Citation36 First, attributes for the treatment profiles were identified, selected, and refined. Then, choice tasks were created and were tested with people with type 2 diabetes to determine whether they understood the attribute descriptions and could successfully complete the choice tasks. The final treatment profiles contained six attributes: A1c decrease (0%, 0.5%, and 1%), stable blood glucose (2 days per week, 4 days per week, 6 days per week), low blood glucose/hypoglycemia (none, during the day, during the day and/or at night), nausea (none, 30 minutes per day, 90 minutes per day), treatment burden (one pill per day, two pills per day, one pill and one injection per day), and out-of-pocket costs ($10 per month, $30 per month, $50 per month). The survey instrument included an explanation and example on how to complete a choice task. It also included detailed descriptions on all attributes and levels that had been pretested with people with type 2 diabetes to test their understanding of the concepts. It discussed the benefits of lowering A1c and the potential health consequences of high A1c levels.
With six attributes at three levels each, 729 distinct treatment profiles and more than 500,000 choice tasks containing two treatment profiles could be generated. Specialized software (Ngene, ChoiceMetrics)Citation37 was used to select a subset of these possible choice tasks by estimating a D-efficient experimental design. Respondents were randomly assigned to one of three survey blocks that each contained 16 choice tasks. A sample choice task is presented in .
Statistical analysis
The model was stratified by educational status by conducting separate analyses for participants who had completed high school or less education, participants who had completed some college, and participants who had a college degree or more education. Stata 13 (StataCorp LP, College Station, TX, USA) was used to analyze the data using a conditional logit model.Citation38 The dependent variable represented whether a particular treatment profile was chosen. The independent variables were the attribute levels that made up the treatment profile. A1c decrease, stable blood glucose, nausea, and out-of-pocket costs were included as continuous variables. Low blood glucose and treatment burden were included as categorical variables, where no low blood glucose events and one pill per day served as the reference categories.
Preference estimates were converted to WTP estimates by taking the preference coefficient of each attribute level and dividing by the preference coefficient for cost:
The WTP measures indicate how much patients would be willing to pay if a medication had a particular treatment attribute included in the DCE. A positive WTP value indicates that the attribute level is desirable and that participants are willing to pay for a medication with that attribute level. A negative WTP value indicates that the attribute level is undesirable and that a medication with that attribute level needs to cost less or participants need to be compensated to be willing to accept that attribute level. WTP measures were estimated separately for the different levels of low blood glucose and treatment burden. Standard errors (SEs) were estimated using the delta method. Paired t-tests were used to test for the equivalence of individual coefficients between educational groups.
WTP estimates were then converted into budget allocation estimates for each attribute. This budget allocation represented how much money out of a $100 budget participants would be willing to allocate in order to ensure that a medicine had the desirable treatment attribute or did not have an undesirable treatment attribute. In this budget allocation, the absolute value of the WTP estimate of one attribute was divided by the sum of the absolute values of the WTP estimates of all attributes and multiplied by $100:
This budget allocation was done to examine the priorities for treatment attributes of the different educational groups under standardized budgets and account for differences in WTP that might be found due to differing income levels. It only considered the most extreme levels for the categorical attributes (nausea, low blood glucose, and one pill and one injection) to avoid doubling up between attributes.
Survey respondents
Members of a nationally representative online panel with type 2 diabetes were invited by email to participate in the survey (GfK KnowledgePanel). All participants were required to be 18 years or older with self-reported physician-diagnosed type 2 diabetes and able to read English or Spanish. African Americans and Latinos were oversampled to account for the high prevalence of diabetes in these populations.Citation39,Citation40 Survey participants received compensation from the online panel equivalent to approximately $10. Completion of the survey served as written informed consent from all participants. The Johns Hopkins School of Public Health IRB approved this study to be exempt from human subjects review (IRB 6001).
Results
A total of 552 people (66% response rate) completed the survey. Our participants were more likely to take medication and were living with diabetes longer than a 2011 national sample.Citation41,Citation42 Of the total, 231 participants had completed high school or less education, 156 participants had completed at least some college, and 165 people had completed college or more education (). Participants with more education were more likely to be male, were more likely to report better health status, and had higher incomes. There were no differences between educational groups in years since diabetes diagnosis, having had a hypoglycemic event in the past 6 months, A1c levels, or medication use.
Table 1 Characteristics of sample by educational attainment
WTP results
presents the WTP results stratified by educational attainment. Participants with high school education or less and participants with some college were willing to pay most to avoid having to take one pill and one injection a day (WTP for high school or less: $−30.54, SE: 4.11; WTP for some college: $−38.25, SE: 6.10). They were willing to pay least to avoid having to take two pills a day (WTP for high school or less: $−5.22, SE: 2.89; WTP for some college: $−5.50, SE: 3.43). Participants with a college degree or more were willing to pay most for a 1% decrease in A1c (WTP: $58.84, SE: 10.60). They were willing to pay least to avoid low blood glucose events during the day (WTP: $−9.41, SE: 4.73).
Table 2 Willingness to pay for diabetes medication by educational attainment
Participants with college or more were willing to pay more for A1c decrease than participants who had completed some college ($28.47, SE: 5.53) or participants who had completed high school or less ($17.56, SE: 3.55) (p≤0.01). People with a college degree or more were also willing to pay more to avoid 30 minutes of nausea (p=0.03), low blood glucose events during the day and/or at night (p=0.04), and to avoid two pills a day (p=0.03) compared to people with high school or less. Other differences in WTP between educational groups were not statistically significant.
presents how people in different educational groups would allocate a budget of $100 between the different aspects of diabetes medication. The biggest differences between educational groups could be seen in the allocation for A1c decrease. People with a college education or more would allocate $30 for a 1% decrease in A1c, while people with some college would allocate $21 and people with high school or less would allocate $17.
Figure 3 Budget allocation for diabetes medication by educational attainment.
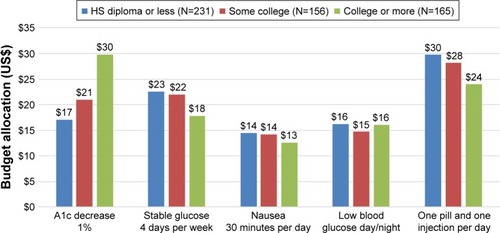
People with some college or less education were willing to allocate more of their budget to 4 days of stable blood glucose a week than for a 1% decrease in A1c. People with a college education or more would allocate $24 to avoid one pill and one injection a day, while people with some college would allocate $28 and people with high school or less would allocate $30. All groups would be willing to allocate the least ($13–14) to avoid 30 minutes of nausea a day.
Discussion
In this study, a DCE was used to show that patients with type 2 diabetes do not only value reductions in their A1c levels but also had preferences for medications that stabi-lized their daily glucose levels and that reduced burden/harms of medication. Patients with different educational attainment displayed different preferences for diabetes treatment. Patients with a higher education were willing to pay more for all medication attributes than patients with lower educational attainment, possibly due to their higher average income. Differences in absolute WTP might not reflect differences in WTP as a proportion of earnings given that people with lower educational attainment generally also have lower earnings.Citation43 However, absolute WTP is still an important measure of preference when making treatment decisions because it might reflect ability to pay and affect adherence to treatment.
This study calculated budget allocation estimates to account for differences in income and to examine the value of each aspect of diabetes medications relative to the other aspects. The results showed that on average patients with some college or less education prioritized reducing treatment burden; they were willing to allocate most of their budget to avoiding one pill and one injection per day. This priority could indicate that people with lower levels of education are more bothered by treatment burden which could decrease adherence if treatment burden is not considered in clinical care.Citation44 People with some college or less education were willing to allocate more of their budget to 4 days of stable blood glucose a week than to a 1% decrease in A1c. This might indicate that patients with lower educational attainment might place more value on keeping their glucose levels within a daily target range rather than maintaining controlled A1c levels. As A1c control is generally the ultimate treatment goal in diabetes,Citation45 treatment and education programs emphasizing reductions in A1c might be less effective in these populationsCitation10 as they are not aligned with the preferences of patients with lower levels of education.
Despite the high need for self-management in type 2 diabetes, much clinical research and care continues to neglect the patient perspectiveCitation46 resulting in low rates of medication adherenceCitation47 and low rates of achieving treatment goals.Citation48 When incorporating the patient perspective, the effects of patient characteristics, such as educational attainment, on their treatment preferences should be considered. Efforts to deliver diabetes treatments may be more effective if tailored to individuals’ preferences and educational background.
This study has several limitations. First, weight was not included as an attribute based on our instrument development process. This decision was partly made because weight gain could be interpreted as either positive or negative depending on the person and his/her current weight. While it is generally assumed that patients with type 2 diabetes would benefit from weight loss, this does not apply to some elderly, frail patients. To avoid estimation ambiguities that could arise due to this issue, and after consulting with diabetes experts and patients with diabetes, it was decided to not include weight changes as an attribute. Unless weight changes were dependent on one of the included attributes, this should not have affected the estimated importance of each attribute.
Second, a previous study found that people with lower educational attainment were less consistent in the choices they made in a DCE.Citation49 If participants do not understand the choice tasks or attributes, they might be less consistent in the choices they make and their estimated preference weights are biased towards the null. In this study, people with a lower education were willing to pay less for every medication attribute. However, participants with lower educational attainment did not report that they had more difficulty with answering the choice tasks consistently. In addition, participants with lower educational attainment did not report more difficulty with understanding and/or answering the choice tasks. This suggests that their lower WTP is not due to lower choice consistency or lack of understanding.
Third, this study does not explore reasons why participants with lower educational attainment showed lower WTP for reductions in A1c. This limits implications for the tailoring of diabetes treatment to patients with lower educational attainment. If patients with lower educational attainment truly assign less value to reductions in A1c, this might indicate that diabetes treatment for these groups should focus on maintaining stable glucose levels on a daily basis or on reducing treatment burden. If patients with lower educational attainment have a more limited understanding about the importance of A1c and this decreases the value they place on reducing it, this might indicate that more educational efforts are necessary. Further studies, such as qualitative interviews, that explore this observed difference in preferences between people with different levels of educational attainment will help clinicians individualize diabetes treatment.
Finally, to maintain sufficient power, the analyses could not be controlled for other variables such as race/ethnicity, or income. Therefore, it is not clear whether observed differences in preferences were due to educational differences or other differences in the groups. A preliminary, stratified analysis by income showed that between two income groups (below $50,000 and above $50,000 a year), WTP differed only on A1c decrease and avoiding one pill and one injection per day, suggesting that education might play a more important role in treatment preferences. Segmentation techniques using finite mixture modelsCitation50,Citation51 might be more appropriate to detect subgroup heterogeneity. These techniques group individuals based on the preferences they displayed in completing the preference instrument. The characteristics of people that make up these preference-based groups can then be observed to detect multiple factors, such as education, race/ethnicity, and income, that are predictive of belonging to a particular preference-based group.
Conclusion
This paper shows that while stratification methods can serve to identify differences in preferences based on observed characteristics, the number of possible subgroup analyses are limited. Preference researchers should be aware of this limitation of stratification methods. The findings in this study also suggest that diabetes patients with lower levels of education are willing to allocate more of their budget to avoid a higher treatment burden and that they might place more value on keeping their glucose levels within a daily target range than on lowering A1c. Being aware of patient preferences and that these preferences might vary by demographic characteristics can help clinicians tailor treatment approaches to patients by either adapting treatment or increasing educational efforts on the importance of lowering A1c.
Key points
Stated-preference methods are a useful tool in evaluating how patients value different aspects of treatment.
The study identified that patients with a college degree are willing to pay more for many aspects of diabetes medication than patients with a high school education or less, but further preference differences could not be explored.
While stratification models are useful to detect differences in preferences by subgroup based on observed characteristics, they are limited in the number of subgroups that can be evaluated. Other statistical models should be explored to detect preference heterogeneity to better target clinical practice and health care decision-making based on treatment preferences.
Acknowledgments
The authors sincerely thank the Johns Hopkins Institute for Clinical and Translational Research (ICTR) Community Research Advisory Council (C-RAC) and members of the Diabetes Action Board (DAB) for their valuable contributions and engagement in the research study. This work was supported by a Patient-Centered Outcomes Research Institute (PCORI) Methods Award (ME-1303-5946) and by the Center for Excellence in Regulatory Science and Innovation (CERSI) (1U01FD004977-01). The funders had no role in the design and conduct of the study, interpretation of the data, or preparation of the manuscript.
Disclosure
The authors report no conflicts of interest in this work.
References
- HummerRALariscyJTEducational attainment and adult mortalityRogersRGCrimminsEMInternational Handbook of Adult MortalityNew YorkSpringer2011241261
- MirowskyJRossCEEducation, Social Status, and HealthNew YorkAldine de Gruyter2003
- MontezJKFriedmanEMEducational attainment and adult health: under what conditions is the association causal?Soc Sci Med20151271725557617
- MearaERRichardsSCutlerDMThe gap gets bigger: changes in mortality and life expectancy, by education, 1981–2000Health Aff (Millwood)200827235036018332489
- CutlerDMLleras-MuneyAEducation and health: evaluating theories and evidenceSchoeniRFHouseJSKaplanGAPollakHMaking Americans Healthier Social and Economic Policy as Health PolicyNew YorkRussell Sage Foundation20082960
- National Center for Chronic Disease Prevention and Health PromotionNational diabetes statistics report2017 Available from: https://www.cdc.gov/diabetes/pdfs/data/statistics/national-diabetes-statistics-report.pdfAccessed: September 6, 2017
- HillJNielsenMFoxMHUnderstanding the social factors that contribute to diabetes: a means to informing health care and social policies for the chronically illPerm J2013172677223704847
- AyyagariPGrossmanDSloanFEducation and health: evidence on adults with diabetesInt J Health Care Finance Econ2011111355421213044
- Centers for Disease Control and PreventionAge-adjusted percentage, adults with diabetes. Education Available from: https://gis.cdc.gov/grasp/diabetes/DiabetesAtlas.htmlAccessed: September 9, 2017
- O’BrienMJWhitakerRCYuDAckermannRTThe comparative efficacy of lifestyle intervention and metformin by educational attainment in the Diabetes Prevention ProgramPrev Med20157712513026024851
- GrossmanMOn the concept of health capital and the demand for healthJ Polit Econ1972802223255
- de WalqueDHow does the impact of an HIV/AIDS information campaign vary with educational attainment? Evidence from rural UgandaJ Dev Econ2007842686714
- SmithJPThe impact of socioeconomic status on health over the life-courseJ Hum Resour2007424739764
- GoldmanDPSmithJPCan patient self-management help explain the SES health gradient?Proc Natl Acad Sci U S A200299161092010934
- CutlerDMLleras-MuneyAUnderstanding differences in health behaviors by educationJ Health Econ201029112819963292
- CaseAFertigAPaxsonCThe lasting impact of childhood health and circumstanceJ Health Econ200524236538915721050
- HaasSAGlymourMMBerkmanLFChildhood health and labor market inequality over the life courseJ Health Soc Behav201152329831321896684
- PalloniAReproducing inequalities: luck, wallets, and the enduring effects of childhood healthDemography200643458761517236536
- Centers for Disease Control and PreventionPercentage, adults with diabetesAge Available from: https://gis.cdc.gov/grasp/diabetes/DiabetesAtlas.htmlAccessed: September 6, 2017
- Centers for Disease Control and PreventionNational newly diagnosed diabetes. Rate per 1000, adults aged 18–79 years2017 Available from: https://gis.cdc.gov/grasp/diabetes/DiabetesAtlas.html#Accessed: September 6, 2017
- AwadMAShapiroSHLundJPFeineJSDeterminants of patients’ treatment preferences in a clinical trialCommunity Dent Oral Epidemiol200028211912510730720
- ZickafooseJSDeCampLRProsserLAParents’ preferences for enhanced access in the pediatric medical home: a discrete choice experimentJAMA Pediatr2015169435836425643000
- DittoPHSmuckerWDDanksJHStability of older adults’ preferences for life-sustaining medical treatmentHealth Psychol200322660561514640858
- SwiftJKCallahanJLThe impact of client treatment preferences on outcome: a meta-analysisJ Clin Psychol200965436838119226606
- StreetRLJrVoigtBPatient participation in deciding breast cancer treatment and subsequent quality of lifeMed Decis Making19971732983069219190
- HauberABHanSYangJCEffect of pill burden on dosing preferences, willingness to pay, and likely adherence among patients with type 2 diabetesPatient Prefer Adherence2013793794924086104
- HauberABMohamedAFJohnsonFRFalveyHTreatment preferences and medication adherence of people with Type 2 diabetes using oral glucose-lowering agentsDiabet Med200926441642419388973
- CvengrosJAChristensenAJCunninghamCHillisSLKaboliPJPatient preference for and reports of provider behavior: impact of symmetry on patient outcomesHealth Psychol200928666066719916633
- CascianoRMalangoneERamachandranAGagliardinoJJA quantitative assessment of patient barriers to insulinInt J Clin Pract201165440841421401829
- SarkarUPietteJDGonzalesRPreferences for self-management support: findings from a survey of diabetes patients in safety-net health systemsPatient Educ Couns200870110211017997264
- GuimarãesCMarraCAColleyLSocioeconomic differences in preferences and willingness-to-pay for insulin delivery systems in type 1 and type 2 diabetesDiabetes Technol Ther200911956757319764835
- HoMPGonzalezJMLernerHPIncorporating patient-preference evidence into regulatory decision makingSurg Endosc201529102984299325552232
- BridgesJFHauberABMarshallDConjoint analysis applications in health – a checklist: a report of the ISPOR Good Research Practices for Conjoint Analysis Task ForceValue Health201114440341321669364
- HauberABGonzálezJMGroothuis-OudshoornCGStatistical methods for the analysis of discrete choice experiments: a report of the ISPOR Conjoint Analysis Good Research Practices Task ForceValue Health201619430031527325321
- Reed JohnsonFLancsarEMarshallDConstructing experimental designs for discrete-choice experiments: report of the ISPOR Conjoint Analysis Experimental Design Good Research Practices Task ForceValue Health201316131323337210
- JanssenEMSegalJBBridgesJFA framework for instrument development of a choice experiment: an application to type 2 diabetesPatient20169546547927120338
- ChoiceMetricsNGene. User Manual and Reference Guide2014 Available from: https://dl.dropboxusercontent.com/u/9406880/NgeneManual112.pdfAccessed: September 6, 2017
- McFaddenDConditional logit analysis of qualitative choice behaviorZarembkaPFrontiers in EconometricsNew YorkAcademic Press1974105142
- Centers for Disease Control and PreventionNational diabetes medication use. Age-adjusted percentage, diabetes population adult aged 18+ years2017 Available from: https://gis.cdc.gov/grasp/diabetes/DiabetesAtlas.html#Accessed: September 6, 2017
- Centers for Disease Control and PreventionNational diabetes duration. Total-crude median, adults aged 18–79 years2017 Available from: https://gis.cdc.gov/grasp/diabetes/DiabetesAtlas.html#Accessed: September 6, 2017
- CowieCCRustKFByrd-HoltDDPrevalence of diabetes and high risk for diabetes using A1C criteria in the U.S. population in 1988–2006Diabetes Care201033356256820067953
- EgedeLEGebregziabherMHuntKJRegional, geographic, and ethnic differences in medication adherence among adults with type 2 diabetesAnn Pharmacother201145216917821304026
- Bureau of Labor StatisticsUnemployment rates and earnings by educational attainment 20162017 Available from: https://www.bls.gov/emp/ep_table_001.htmAccessed: September 6, 2017
- PolonskyWHHenryRRPoor medication adherence in type 2 diabetes: recognizing the scope of the problem and its key contributorsPatient Prefer Adherence2016101299130727524885
- American Diabetes AssociationGlycemic targetsDiabetes Care201639Suppl 1S39S4626696679
- ReaneyMBlackPGwaltneyCA systematic method for selecting patient-reported outcome measures in diabetes researchDiabetes Spectr201427422923225647044
- García-PérezLEAlvarezMDillaTGil-GuillénVOrozco-BeltránDAdherence to therapies in patients with type 2 diabetesDiabetes Ther20134217519423990497
- PérezCMFebo-VázquezIGuzmánMOrtizAPSuárezEAre adults diagnosed with diabetes achieving the American Diabetes Association clinical practice recommendations?P R Health Sci J2012311182322432404
- LancsarELouviereJDonaldsonCCurrieGBurgessLBest worst discrete choice experiments in health: methods and an applicationSoc Sci Med2013761748223159304
- McFaddenDThe choice theory approach to market researchMarket Sci198654, Special Issue on Consumer Choice Models275297
- SwaitJA structural equation model of latent segmentation and product choice for cross-sectional revealed preference choice dataJ Retail Consumer Serv1994127789