
 ?Mathematical formulae have been encoded as MathML and are displayed in this HTML version using MathJax in order to improve their display. Uncheck the box to turn MathJax off. This feature requires Javascript. Click on a formula to zoom.
Abstract
Background
The aim of this study was to propose an alternative approach to item response theory (IRT) in the development of computerized adaptive testing (CAT) in quality of life (QoL) for patients with multiple sclerosis (MS). This approach relied on decision regression trees (DRTs). A comparison with IRT was undertaken based on precision and validity properties.
Materials and methods
DRT- and IRT-based CATs were applied on items from a unidi-mensional item bank measuring QoL related to mental health in MS. The DRT-based approach consisted of CAT simulations based on a minsplit parameter that defines the minimal size of nodes in a tree. The IRT-based approach consisted of CAT simulations based on a specified level of measurement precision. The best CAT simulation showed the lowest number of items and the best levels of precision. Validity of the CAT was examined using sociodemographic, clinical and QoL data.
Results
CAT simulations were performed using the responses of 1,992 MS patients. The DRT-based CAT algorithm with minsplit = 10 was the most satisfactory model, superior to the best IRT-based CAT algorithm. This CAT administered an average of nine items and showed satisfactory precision indicators (R = 0.98, root mean square error [RMSE] = 0.18). The DRT-based CAT showed convergent validity as its score correlated significantly with other QoL scores and showed satisfactory discriminant validity.
Conclusion
We presented a new adaptive testing algorithm based on DRT, which has equivalent level of performance to IRT-based approach. The use of DRT is a natural and intuitive way to develop CAT, and this approach may be an alternative to IRT.
Background
Quality of life (QoL) measurements are increasingly being considered important for patients with chronic diseases.Citation1,Citation2 Self-reported questionnaires are traditionally used to measure QoL, but they are often considered too lengthy by professionals whose main role is providing patient care.Citation3 In addition, questionnaires should be as brief as possible because of the difficulties of fatigue and concentration in some clinical populations, such as patients with multiple sclerosis (MS).Citation4 It is thus necessary to provide shorter questionnaires in QoL measurements.Citation5 Short-form instruments are usually a fixed length and adapted from a long-form instrument. However, these fixed-length short-form instruments have several drawbacks. The reduction in questions carries a risk of losing relevant information that can result in a decline in measurement precision.Citation6,Citation7 Moreover, because some items are not tailored to patients, the precision of the QoL measurement is not maximized.
Methods based on item response theory (IRT) can be applied to overcome these issues. IRT parametric models are currently used for the development of unidimensional item banks and are the basis of computerized adaptive testing (CAT).Citation8,Citation9 CAT administers only the items that offer the most information about a given individual, improving both the completion time and the measurement’s precision.Citation10–Citation12
However, IRT is based on fundamental assumptions (ie, unidimensionality, local independence and monotonicity) that may not be met for some real datasets. In addition, IRT models require an adequate sample size depending on the number of items and response categories.Citation13,Citation14 Moreover, the computational constraints due to several selection criteria in CAT, such as minimal expected posterior variance (EPV), may be inapplicable in practice.Citation15 An interesting alternative to IRT-based CAT may be to develop a CAT based on machine learning and decision trees (DTs); the most well-known method is classification and regression trees (CARTs).Citation16 These tree-based methods aim to get a partition of a data sample in a set of homogeneous subsamples and can be applied to both regression (decision regression trees, DRTs) and classification (decision classification trees, DCTs) problems. DCT and DRT differ according to the outcome of interest which is categorical (eg, presence of symptom [SPT] and health status) for DCT and continuous (eg, a QoL score) for DRT. Moreover, in DRT, the prediction of the response for a given observation is obtained using the mean response of the training observations in the corresponding subsample. In contrast, in DCT, the prediction of the response is obtained using the most commonly occurring class of the training observations in the corresponding subsample. The criterion to minimize to get the optimal partition of a sample is also different for the two approaches: in DRT, it is based on the residual sum of squares, while in DCT, it is based on the classification error rate.Citation17 DRT provides a simple way to represent the results obtained and does not require any model assumptions. Therefore, constructing a DRT-based CAT using an external criterion (eg, a test or dimension score) is a good way to avoid the IRT fundamental assumptionsCitation18 and requires fewer computational resources.Citation15 To date, DT-based CAT has been mainly developed in the field of educational testing,Citation19–Citation21 and several studies have reported that this nonparametric and non-iterative approach showed superior performance to IRT-based CAT, especially when IRT assumptions were not satisfied.Citation18,Citation22 To the best of our knowledge, the only applications of DT in medicine have been in the development of a CAT as a screening tool for depressionCitation23 and a support decision system for the assessment of suicidal riskCitation24 using DCT. No study has presented a comparison between DRT-based CAT and classical IRT-based CAT in QoL measurements.
Thus, the aim of this study was to determine whether DRT-based CAT can be an alternative approach to IRT-based CAT in a single case of QoL measurements. For this purpose, we compared the performances (ie, the mean number of items administered, precision and validity properties) of DRT- and IRT-based CAT on a calibrated item bank measuring QoL related to mental health (MH) for patients with MS.Citation25
Materials and methods
Study design and setting
Data from an international, multicentre, cross-sectional study were used.Citation26 All the details about this study have been taken from a previously published study.Citation25 Patients were recruited between January 2004 and February 2005 from neurology departments in 15 countries: Argentina, Canada, France, Germany, Greece, Israel, Italy, Lebanon, Norway, Russia, South Africa, Spain, Turkey, the UK and the USA. This study was performed in accordance with the Declaration of Helsinki and all applicable regulatory authority requirements and national laws. It was also conducted in compliance with the requirements of the institutional review boards and independent ethics committees of each of the 15 countries from which study participants were drawn. In France, it was a Comité Consultatif de Protection des Personnes dans la Recherche Biomédicale ethical committee. Written informed consent was obtained from patients before any study procedures were performed.
Population
The inclusion criteria for this study included the following: having a diagnosis of MS according to the McDonald criteria,Citation27 inpatient or outpatient, age superior to 18 years and informed consent.
Data collection
The following data were collected:
Sociodemographic information: gender, age, educational level, marital status and occupational status.
Clinical data: MS subtype;Citation28 disease duration; MS disability assessed using the Expanded Disability Status ScaleCitation29 (EDSS); severity of SPTs using a self-reported checklist of 14 SPTs (lack of sensation in touch, lack of sensation in position, involuntary body movements, vibration in legs or arms, weakness in limbs, tingling in limbs, inability to swallow, involuntary eye movements, visual problems, difficulty concentrating, fatigue, urinary incontinence and bowel incontinence) for which the total score was calculated as the sum of the SPT scores (a higher score indicated more severe SPTs). This list was elaborated by an international steering committee including 15 senior neurologists, two experts in QoL, one expert in health economics and two external advisors.Citation26 The 14 items were based on the impairment in the eight functional systems of the EDSS.Citation30
QoL was assessed using two widely used scales, the Multiple Sclerosis International Quality of Life (MusiQoL)Citation26 and the Short-Form 36 (SF-36)Citation31 questionnaires. The MusiQoL is an MS-specific questionnaire that describes nine QoL dimensions and yields a global index score. The nine QoL dimensions measured by this questionnaire are the following: activities of daily living (ADLs), psychological well-being (PWB), SPTs, relationships with friends (RFr), relationships with family (RFa), relationships with health care system (RHCS), sentimental and sexual life (SSL), coping (COP) and rejection (REJ). The SF-36 is a generic questionnaire describing eight subscales: physical function (PF), social function (SF), role physical (RP), role emotional (RE), MH, vitality (VT), bodily pain (BP) and general health (GH). Two composite scores (physical and mental: physical composite score [PCS]-SF-36 and mental composite score [MCS]-SF-36) were also calculated. Both the MusiQoL and SF-36 yield scores on a scale from 0 to 100, in which 0 represents the lowest and 100 the highest QoL scores. Both questionnaires are available in the 15 languages selected for this study.
CAT development and simulations
DRT- and IRT-based CAT were applied on 22 items from a calibrated unidimensional item bank measuring QoL related to MH.Citation25 We implemented a real-data simulation approach, ie, complete response patterns to the 22 items were used to simulate the conditions of the CAT assessments. We used the responses contained in the item bank to simulate the adaptive administration of items.
QoL item bank related to MH
The item bank comprises 22 items issued from both MusiQoL and SF-36 questionnaires. In a recent study,Citation25 this set of items was calibrated using a partial credit model, with each item showing satisfactory “inlier-pattern-sensitive fit statistic” goodness-of-fit statistics (ie, 0.7 < inlier-pattern-sensitive fit statistic < 1.3). This study demonstrated satisfactory psychometric properties of the item bank, and the score computed from the item bank was reliable, correlated significantly with other QoL scores and showed good discriminant validity according to sociodemographic and clinical features. The initial different dimensions represented by this set of items were PWB, COP, REJ, RE, SF and MH. Patients’ responses to these 22 items provided an item bank score, computed using maximum likelihood estimation. The score was logit-transformed to a scale ranging from 0 to 100 (with 0 representing the lowest and 100 representing the highest QoL levels). Differential item functioning (DIF) analyses showed that item biases were negligible across geographical areas, highlighting the cross-cultural equivalence of the item bank.
DRT-based CAT
In this study, we used DRT as defined by Breiman’s CART method.Citation32
Briefly, the items in a DRT-based model are assumed to be formative indicators, ie, items are viewed as causes of the theoretical construct under consideration.Citation33 A DRT is constructed using an iterative process, in which a binary splitting rule is searched for. For each variable V.jj in the data, a splitting rule of the form x.j < a(a ∈ R is a threshold) is used to split the initial set of observations (denoted t0, the root of the tree) into two subsets tl and tr (the sibling nodes). Among the possible splits over all the input variables and all thresholds, the best split is defined as the one minimizing the sum of the within-class heterogeneity (or deviance) within the sibling nodes. Once the best split has been defined, the same process is applied to the two nodes tl and tr and repeated until subsets contain few observations (other stopping criteria can be considered, such as a minimum heterogeneity criterion). A predicted value is assigned to each subset of observations. Then, a pruning algorithm can be used to search for an optimal tree, given a penalized criterion (eg, deviance). A DT can be represented graphically and thus can be directly interpretable, given its simple structure. In the context of CAT, each node of the tree can be seen as a particular item of the item bank (eg, the root of the tree corresponds to the first item administered to a patient). According to the response provided by the patient, and given the threshold observed at each node, the choice of the next item is made, corresponding to the left node if the splitting rule is satisfied and to the right node otherwise. The series of items is administered sequentially, and when all the items are completed, a score is computed for the patient, represented by the predicted value in the corresponding tree node. shows an example of tree structure obtained from the item bank used in this study, fixing the minimal number of observations (or individuals) in a node to be split to 100 (ie, minsplit = 100).
Figure 1 Structure of tree obtained using CART with minsplit = 100.
Abbreviation: CART, classification and regression tree.
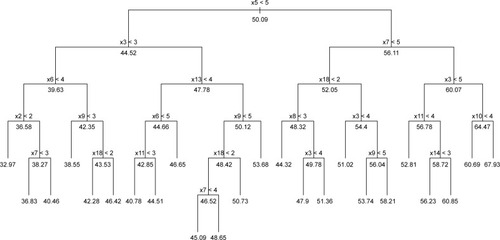
The dependent variable Y was the item bank score. The input ordinal variables corresponded to the 22 items contained in the item bank. For tree construction, the only fixed parameter was the minsplit parameter, controlling the minimum number of observations that must remain in a tree node to split this node. The DRT-based CAT was run under four values of minsplit (100, 50, 10, 5), with lower values implying deeper trees. The CAT procedure was stopped when all items of a tree path were completed.
To predict the CAT score of a patient, the initial item responses can be used to follow the corresponding paths in the DT. For example, as shown in , if a patient responded with the highest modality to items 5, 7, 3 and 10, then he/she would be sent to the extreme right node of the tree and assigned a CAT score of 67.93. Therefore, the final CAT score is defined as the predicted value of Y in the terminal node (ie, the sample mean of the dependent variable in that node), given the series of ordinal responses. We used the R package “rpart”Citation34 to apply this method.
IRT-based CAT
In contrast to the previous model, all the items in the IRT model were considered as reflective indicators. Following the study by Costa,Citation35 we may assume that these items were the manifestations of an underlying construct (ie, QoL related to MH).
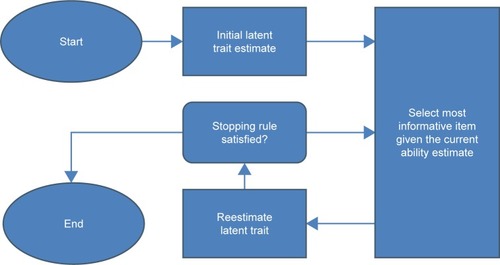
The item selection algorithm of the IRT-based CAT was based on the maximum Fisher information item selection (MFI),Citation36 relevant for polytomous items and adapted to an unidimensional item bank.Citation37 First, an initial latent trait estimate was provided to each patient (ie, the value was set to the study sample mean). The CAT algorithm selected the item where information function reached its maximum for the given estimate. The
estimate was then updated given the patient’s response and the item parameters using Bayesian maximum a posteriori (MAP) estimation.Citation38 A new item was selected based on the new
estimate and so on. The stopping rule employed was the prespecified level of measurement precision using the standard error of measurement (SEM).Citation39 A range from 0.33 to 0.55 has been selected, corresponding to reliability coefficients between 0.70 and 0.90.Citation39 For high-stakes decision making, a reliability coefficient >0.90 was expected. The IRT-based CAT was run under three levels of minimally required SEM (ie, minimum, middle and maximum values: 0.33, 0.44 and 0.55, respectively), ie, the CAT procedure was stopped when the SEM threshold was reached. The last updated
estimate was the final CAT score. We used the R package “mirtCAT”Citation40 to apply this method. shows a diagram illustrating the IRT-based CAT algorithm used in this study.
Figure 2 IRT-based computerized adaptive test algorithm.
Comparisons of DRT- and IRT-based CAT
For the seven simulations (ie, four for DRT-based CAT and three for IRT-based CAT), CAT scores were computed. The mean number of items was administered, and precision and validity properties were assessed for each simulation. Accuracy was assessed using the level of correlation between the CAT score and the latent trait score based on the full set of items (R > 0.9 were expected). Precision was assessed using the root mean square error (RMSE). The RMSE is the square root of the mean square of all the errors. The error is the gap between the latent traits estimated by the CAT and the latent traits estimated by the full item bank. Smaller values of RMSE represent better measurement precision, and RMSE values ≤0.3 indicate excellent measurement precision.Citation41 The optimal CAT algorithm was selected based on the lowest number of items that matched with the most satisfactory levels of accuracy and precision.
A cross-validation was performed to assess the performance of our new DRT-based CAT approach and the stability of the optimal model. This analysis is presented in and .
Convergent and divergent validity of the selected CAT algorithm
To explore the convergent validity of this score, relationships were investigated between the CAT score estimate and all of the scores of the MusiQoL and SF-36 dimensions. The underlying assumption was that the CAT score would be more correlated with scores of the component dimensions of the item bank than with other dimensions not captured in the item bank. The discriminant validity was determined via comparisons of mean dimension scores across patient groups according to sociodemographic (ie, age, gender, educational level, marital status, occupational status and geographical area) and clinical (ie, EDSS score, SPT sum scale, disease duration and MS subtypes) features, using Student’s t-tests, ANOVAs and Pearson’s correlation coefficients.
Results
Study sample characteristics
The study sample included 1,992 patients with MS. The mean age was 42.2 (SD = 11.9) years, 578 patients (29.5%) were male, 601 (36.8%) were unemployed, 592 (35.2%) had a high educational level and 372 (21.7%) were single. The mean duration of the disease was 11.1 (SD = 8.8) years, and the median EDSS score was 3.0 (interquartile range = 3.5).
DRT- and IRT-based CAT development and simulations
gives the results of the seven CAT simulations.
Table 1 Comparisons of DRT- and IRT-based approaches
The IRT-based CAT, based on a level of precision of SEM < 0.33, was defined as the most satisfactory CAT simulation, because this model was associated with the lowest number of items and performed the highest levels of accuracy (R = 0.96) and precision (RMSE = 0.22). With such a SEM threshold, the CAT score obtained is reliable to a level of 90%. In addition to these satisfactory results, this IRT-based CAT algorithm administered less than half of the initial items from the bank (on average nine items) to predict a QoL score. The other IRT-based CAT algorithms showed a lower performance. The algorithm with SEM < 0.44 got an acceptable precision with regard to the correlation (R = 0.90), but the RMSE value exceeded the expected value of 0.3. Despite its low number of items administered (on average two items), the algorithm with SEM < 0.55 did not show satisfactory accuracy and precision results.
Concerning the DRT-based CAT algorithms, each simulation had satisfactory accuracy with correlations higher than 0.90. On the contrary, the precision results were not satisfactory for the model with minsplit = 100 (RMSE > 0.30). In contrast, the three other DRT-based CAT algorithms showed a good level of precision. For minsplit = 50, the CAT algorithm showed satisfactory precision indicators (R = 0.93, RMSE = 0.28), but did not outperform the optimal IRT-based algorithm (ie, SEM < 0.33). For minsplit = 10, the CAT administered as many items as the optimal IRT-based CAT but was more efficient in terms of accuracy and precision (R = 0.98, RMSE = 0.16). We decided to reject the DRT-based CAT algorithm with minsplit = 5, given its overly high number of items administered (14 items on average), which is associated with a negligible gain of measurement precision.
The DRT-based CAT with minsplit = 10 was defined as the most satisfactory CAT algorithm.
Convergent and divergent validity
The DRT-based CAT score ranged from 0 to 100, with 0 representing the lowest and 100 representing the highest level of QoL related to MH. Convergent and divergent validity results are presented in . Age was weakly negatively correlated with the CAT score. The CAT score was significantly higher for men, individuals with higher educational levels, those with jobs and those who did not live alone. No significant differences were shown according to the six different geographical areas. Regarding the clinical indices, no correlation was found with disease duration. As expected, the CAT score was negatively correlated with the EDSS score and the SPT sum scale, and it differed according to the MS subtype, with the highest scores observed for the clinically isolated syndrome (CIS) patients and the lowest scores observed for the secondary progressive (SP) patients. According to the QoL data, the CAT score was strongly correlated with the dimension scores from both MusiQoL and SF-36 questionnaires that were used to develop the item bank.
Table 2 Comparison of DRT-based CAT score with sociodemographic, clinical and QoL data
Discussion
To the best of our knowledge, this study is the first to compare DRT- and IRT-based CAT in QoL measurements. In this study, we demonstrated that the DRT-based CAT exhibited satisfactory precision and accuracy properties, equivalent to the best IRT-based CAT. This preliminary finding confirmed the interest of considering DRT for the development of CAT in medicine, and more largely this finding opens new avenues of research and reflection on the development strategy of new QoL measures.
Our study suggests that DRT could be a relevant method for the item selection process in CAT development and an alternative to IRT, which is currently facing several unresolved problems.Citation18 In particular, IRT tends to select the items with high values of item discrimination parameters, leading to item selection bias or errors in estimates of item parameters from an item bank. For DRT, item discrimination is defined in a nonparametric way using a deviance criterion which is computed at each node split in the tree. DRT has less item selection bias from an item bank than IRT, especially when the calibration sample is small.Citation44 The second problem of IRT is the large estimation error in the beginning of the testCitation45 conducted to select items, with optimal measurement properties at the wrong estimated ability value. New item selection algorithms (eg, mutual information measure, Kullback–Leibler information and likelihood weighted Fischer information measure) have been proposed, improving examinees’ ability estimation accuracy, but these new algorithms incur a significant computational cost because they require numerical integration over ability parameters.Citation18 On the contrary, DRT proposes a simpler ability estimation approach, which consists of estimating the subsample means at each node split in the tree. In this way, the test is less computationally intensive than IRT and does not require time-consuming computations.Citation18
Beyond these findings focusing on the item selection process, this study provided a broader reflection on the development strategy of new QoL measurements based on CAT technology. The item selection is the key step of CAT development, but the construction and the calibration of a QoL item bank are a crucial step in proposing IRT-based CAT. Indeed, IRT models require the examination of fundamental assumptions (ie, unidimensionality, local independence and monotonicity). However, the development of a QoL item bank requires substantial resources and time. It is unrealistic to develop IRT-based CAT, because it is expensive to develop, given the resources necessary to calibrate unidimensional item banks, even when the calibration time may be shortened based on a low number of items and avoidance of overly lengthy item selection stages. Pending completion of this important work (ie, developof a QoL item banks), the development of CAT based on DRT can be an attractive option because DRT does not require any assumptions or item banking procedures. DRT-based CAT can be developed from the total score of any validated scale.
We demonstrated that the optimal DRT-based CAT had satisfactory precision and accuracy properties. This DRT-based CAT algorithm administered less than half of the initial items from the bank (on average nine items). The level of correlation with the score based on the full set of items was higher than 0.9, and the RMSE was lower than 0.3. In addition, the external validity of the DRT-based CAT was consistent with our hypotheses. The DRT-based CAT scores were moderately correlated with the EDSS according to a previous study.Citation5 The lowest DRT-based CAT scores were reported by patients with the SP form of MS, confirming that it is the most clinically aggressive and severe form of the disease. In this study, women had lower QoL scores than men, which is consistent with findings from one previous study.Citation42 Older age was significantly associated with worse scores, which is also consistent with previous findings.Citation42 Higher educational level or being in a couple was associated with higher QoL levels, as previously reported in similar cross-sectional studies.Citation26,Citation43 As expected, the DRT-based CAT score was more correlated with the dimension scores of the SF-36, with the MusiQoL constituting the item bank.
Limitations
A limitation in our study is that there is an endogeneity issue between the items and the full score in the DRT applications. Indeed, the items are intended to determine the QoL score, while this criterion should be an independent external variable. This is not the case in IRT methodology,Citation46 where the score does not play any role during CAT score estimation.
Despite the satisfactory results in favor of DRT-based CAT, one of the main disadvantages of DRT comes from their lack of stability. The resulting tree structure can thus be very different when the data are subject to small variations. This issue presents an important perspective for future studies. It is possible to control this stability using tree aggregation methods, the most well-known of which are bagging,Citation47 boostingCitation48 and random forests.Citation49 These methods can be used to construct higher-performing prediction models but imply a loss of interpretability. Future studies should focus on taking this disadvantage into account by testing different methods of tree aggregation to improve the results obtained in this study. Analysis of the stability of the CAT score will be undertaken based on DRT-based CAT developed from multiple resampling of the data.
Although our study accounts for a large set of potentially relevant variables for external validity, other important factors such as depression should be included in the future study.
Conclusion
The use of DRT is a natural and intuitive way to develop CAT. Based on DRT, we have presented a new algorithm of adaptive item administration. This approach was equivalent to the more “classical” IRT-based approach when controlling some parameters of both methods. CAT simulations, as well as analysis of both measurement precision and external validity, allowed us to define an optimal algorithm to adaptively administer items measuring QoL related to MH for patients with MS.
Data availability
The datasets used and analyzed during the current study are available from the corresponding author on reasonable request.
Author contributions
PM, LB and PA conceptualized and designed the study. PA and KB coordinated the study. PA, LB and KB performed the inclusion and clinical data collection. PM, LB and BG analyzed the data. PM, LB, KB and PA interpreted the data. PM and LB drafted and wrote the manuscript. All authors contributed toward data analysis, drafting and revising the paper and agree to be accountable for all aspects of the work. All the authors approved the final manuscript.
Supplementary materials
Cross-validation
To assess the performance of our new decision regression tree (DRT)-based computerized adaptive testing (CAT) approach and the stability of the optimal model, we used a resampling technique called “test set validation” which splits the data sample in two subsamples. The first subsample, containing two-thirds of the observations, was defined as the training sample, used to build the DRT-based CAT, the second sub-sample, containing the remaining observations, was defined as the test sample, used to validate the DRT-based CAT. This procedure was repeated for different values of minsplit ranging from 2 to 200. For each resampling, we computed the same indicators (ie, correlation and root mean square error [RMSE]) to assess the performance of our method. The data sample was split 100 times in two subsamples for each value of minsplit: one training sample with two-thirds of the observations, one test sample with the remaining. For each test sample, we computed the same performance indicators as previously described (ie, number of items, mean score, SD and precision properties). The results were then averaged and compared to the ones obtained on the whole sample.
and provide the results from the cross-validation. The performances of the DRT-based CAT remained stable for each value of minsplit in terms of number of items and precision. In terms of predictions, the mean score (and SD) was close to the ones computed on the full data sample. According to and , the most satisfactory DRT-based CAT = 10 with a lower number of items and a higher RMSE.
Figure S1 Cross-validation results (1,000 replicates, 200 values of minsplit).
Note: (A) The number of items in function of minsplit, (B) the correlation in function of minsplit, (C) RMSE in function of minsplit.
Abbreviation: RMSE, root mean square error.
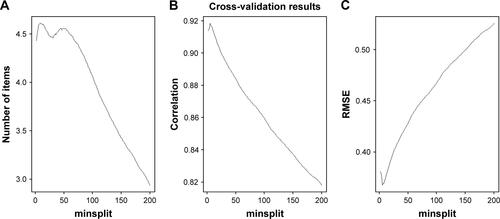
Table S1 Cross-validation results for the DRT-based approach
Disclosure
The authors report no conflicts of interest in this work.
References
- MitchellAJBenito-LeónJGonzálezJ-MMRivera-NavarroJQuality of life and its assessment in multiple sclerosis: integrating physical and psychological components of wellbeingLancet Neurol20054955656616109362
- SolariARole of health-related quality of life measures in the routine care of people with multiple sclerosisHealth Qual Life Outcomes2005311615777478
- GreenhalghJLongAFFlynnRThe use of patient reported outcome measures in routine clinical practice: lack of impact or lack of theory?Soc Sci Med200560483384315571900
- MorrisJPerezDMcNoeBThe use of quality of life data in clinical practiceQual Life Res19987185919481154
- BaumstarckKBoyerLBoucekineMMichelPPelletierJAuquierPMeasuring the quality of life in patients with multiple sclerosis in clinical practice: a necessary challengeMult Scler Int2013201352489423533758
- WalkerJBöhnkeJRCernyTStrasserFDevelopment of symptom assessments utilising item response theory and computer-adaptive testing – a practical method based on a systematic reviewCrit Rev Oncol Hematol2010731476719375939
- EchteldMADeliensLOnwuteaka-PhilipsenBKleinMvan der WalGEORTC QLQ-C15-PAL: the new standard in the assessment of health-related quality of life in advanced cancer?Palliat Med20062011216482751
- EmbretsonSEReiseSPItem Response Theory for Psychologists 1 edMahwah, NJPsychology Press2000
- FayersPMachinDQuality of Life: The Assessment, Analysis and Interpretation of Patient-Reported Outcomes2nd edHoboken, NJWiley2007
- WeissDJComputerized adaptive testing for effective and efficient measurement in counseling and educationMeas Eval Couns Dev200437270
- ReeveBBHaysRDBjornerJBPsychometric evaluation and calibration of health-related quality of life item banks: plans for the Patient-Reported Outcomes Measurement Information System (PROMIS)Med Care2007455 suppl 1S22S3117443115
- HillCDEdwardsMCThissenDPractical issues in the application of item response theory: a demonstration using items from the pediatric quality of life inventory (PedsQL) 4.0 generic core scalesMed Care2007455 suppl 1S39S4717443118
- CappelleriJCLundyJJHaysRDOverview of classical test theory and item response theory for quantitative assessment of items in developing patient-reported outcome measuresClin Ther201436564866224811753
- WilsonMEngelhardGDraneyKObjective Measurement: Theory Into PracticeWestport, CTGreenwood Publishing Group1997
- Delgado-GomezDBaca-GarciaEAguadoDCourtetPLopez-CastromanJComputerized adaptive tests: a decision tree approach. Reply to “Einstein, measurement, and prediction” by Gibbons et alJ Affect Disord2017212464728142082
- BreimanLFriedmanJStoneCJOlshenRAClassification and Regression TreesBoca Raton, FLTaylor & Francis1984
- JamesGWittenDHastieTTibshiraniRTree-based methodsCasellaGFienbergSOlkinIAn Introduction to Statistical Learning. Springer Texts in StatisticsNew YorkSpringer2013303335
- UenoMSongmuangPComputerized adaptive testing based on decision tree2010 IEEE 10th International Conference on Advanced Learning Technologies (ICALT)July 5–7, 2010Sousse, Tunisia
- YanDLewisCStockingM [webpage on the Internet]Adaptive Testing without IRT1998 Available from: http://eric.ed.gov/?id=ED422359Accessed November 18, 2015
- YanDLewisCStockingMAdaptive Testing without IRT in the Presence of MultidimensionalityPrinceton, NJEducational Testing Service2002
- YanDLewisCStockingMAdaptive testing with regression trees in the presence of multidimensionalityJ Educ Behav Stat2004293293316
- RileyBBFunkRDennisMLLennoxRDFinkelmanMThe use of decision trees for adaptive item selection and score estimationAnnual Conference of the International Association for Computerized Adaptive TestingPacific Grove, CAOctober 3–5, 2011
- GibbonsRDHookerGFinkelmanMDThe CAD-MDD: a computerized adaptive diagnostic screening tool for depressionJ Clin Psychiatry201374766967423945443
- Delgado-GomezDBaca-GarciaEAguadoDCourtetPLopez-CastromanJComputerized adaptive test vs. decision trees: development of a support decision system to identify suicidal behaviorJ Affect Disord201620620420927475891
- MichelPAuquierPBaumstarckKDevelopment of a cross-cultural item bank for measuring quality of life related to mental health in multiple sclerosis patientsQual Life Res20152492261227125712324
- SimeoniMCAuquierPFernandezOValidation of the Multiple Sclerosis International Quality of Life questionnaireMult Scler200814221923017942521
- McDonaldWICompstonAEdanGRecommended diagnostic criteria for multiple sclerosis: guidelines from the International Panel on the diagnosis of multiple sclerosisAnn Neurol200150112112711456302
- LublinFDReingoldSCDefining the clinical course of multiple sclerosis: results of an international survey. National Multiple Sclerosis Society (USA) Advisory Committee on Clinical Trials of New Agents in Multiple SclerosisNeurology19964649079118780061
- KurtzeJFOn the evaluation of disability in multiple sclerosisNeurology19611168669413755335
- KurtzkeJFRating neurologic impairment in multiple sclerosis: an expanded disability status scale (EDSS)Neurology19833311144414526685237
- LeplegeAEcosseEPouchotJCosteJPernegerTMOS SF36 Questionnaire. Manual and Guidelines for Scores’ InterpretationParisEditions Estem2001
- BreimanLClassification and Regression Trees1st edWadsworthInternational Group1984
- KossakowskiJJEpskampSKiefferJMvan BorkuloCDRhemtullaMBorsboomDThe application of a network approach to Health-Related Quality of Life (HRQoL): introducing a new method for assessing HRQoL in healthy adults and cancer patientsQual Life Res201625478179226370099
- TerryTAtkinsonBRipleyB [webpage on the Internet]Rpart: Recursive Partitioning and Regression Trees2015 Available from: https://CRAN.R-project.org/package=rpartAccessed April 19, 2018
- CostaDSJReflective, causal, and composite indicators of quality of life: a conceptual or an empirical distinction?Qual Life Res20152492057206525725599
- LordFMApplications of Item Response Theory to Practical Testing ProblemsAbingdonRoutledge1980
- ChoiSWSwartzRJComparison of CAT item selection criteria for polytomous itemsAppl Psychol Meas200933641944020011456
- OwenRJA Bayesian sequential procedure for quantal response in the context of adaptive mental testingJ Am Stat Assoc197570350351356
- HarvillLMStandard error of measurementEduc Meas Issues Pract19911023341
- ChalmersRPGenerating adaptive and non-adaptive test interfaces for multidimensional item response theory applicationsJ Stat Softw2016711138
- ChoiSWReiseSPPilkonisPAHaysRDCellaDEfficiency of static and computer adaptive short forms compared to full-length measures of depressive symptomsQual Life Res201019112513619941077
- MichelPBaumstarckKGhattasBA multidimensional computerized adaptive short-form quality of life questionnaire developed and validated for multiple sclerosis. The MusiQoL-MCATMedicine (Baltimore)20169514e306827057832
- FernándezOBaumstarck-BarrauKSimeoniM-CAuquierPMusiQoL Study GroupPatient characteristics and determinants of quality of life in an international population with multiple sclerosis: assessment using the MusiQoL and SF-36 questionnairesMult Scler201117101238124921669936
- van der LindenWJGlasCAWElements of Adaptive Testing 2010 edNew YorkSpringer2010
- ChangH-HYingZA global information approach to computerized adaptive testingAppl Psychol Meas1996203213229
- EdwardsJRThe fallacy of formative measurementOrgan Res Methods2011142370388
- BreimanLBagging predictorsMach Learn1996242123140
- FreundYSchapireREExperiments with a New Boosting Algorithm1996 Available from: https://people.cs.pitt.edu/~milos/courses/cs2750/Readings/boosting.pdfAccessed April 19, 2018
- BreimanLRandom ForestsMach Learn2001451532