
Abstract
Background
Hospitalization contributes enormously to health care costs associated with heart failure. Many investigators have attempted to predict hospitalization in these patients. None of these models has been highly effective in prediction, suggesting that important risk factors remain unidentified.
Purpose
To assess prospectively collected medication adherence, objectively measured by the Medication Event Monitoring System, as a predictor of hospitalization in heart failure patients.
Materials and methods
We used recently developed adaptive modeling methods to describe patterns of medication adherence in a sample of heart failure patients, and tested the hypothesis that poor medication adherence as determined by adaptive methods was a significant predictor of hospitalization within 6 months.
Results
Medication adherence was the best predictor of hospitalization. Besides two dimensions of poor adherence (adherence pattern type and low percentage of prescribed doses taken), four other single factors predicted hospitalization: low hemoglobin, depressed ejection fraction, New York Heart Association class IV, and 12 or more medications taken daily. Seven interactions increased the predictive capability of the model: 1) pattern of poor adherence type and lower score on the Letter–Number Sequencing test, a measure of short-term memory; 2) higher number of comorbid conditions and higher number of daily medications; 3) higher blood urea nitrogen and lower percentage of prescribed doses taken; 4) lower hemoglobin and much worse perceived health compared to last year; 5) older age and lower score on the Telephone Interview of Cognitive Status; 6) higher body mass index and lower hemoglobin; and 7) lower ejection fraction and higher fatigue. Patients with none of these seven interactions had a hospitalization rate of 9.7%. For those with five of these interaction risk factors, 100% were hospitalized. The C-index (the area under the receiver-operating characteristics [ROC] curve) for the model based on the seven interactions was 0.83, indicating excellent discrimination.
Conclusion
Medication adherence adds important new information to the list of variables previously shown to predict hospitalization in adults with heart failure.
Introduction
Heart failure (HF) is the most prevalent and fastest-growing cardiovascular disease worldwide.Citation1 In the US among those 80 years of age and older, almost 12% of men and women have HF, and the prevalence is projected to increase by 25% by 2030.Citation1 Outcomes associated with HF include poor quality of life, high mortality, and frequent hospitalizations that contribute enormously to health care costs.Citation1
In 2010, the Patient Protection and Affordable Care Act was enacted to address the rising costs of health care in the US.Citation2 In 2012, value-based purchasing was introduced, and hospitals began being financially spurred to produce quality outcomes while reducing inappropriate spending. Specifically, the Centers for Medicare and Medicaid Services Readmissions Reduction Program financially penalizes health care systems when the 30-day all-cause readmission rates for Medicare patients are higher than expected in particular diagnostic categories. HF is one of the targeted diagnoses, so efforts to identify modifiable factors predicting HF hospitalizations are increasingly important.
Numerous investigators have attempted to predict hospitalization in adults with HF. In a recent review, Giamouzis et alCitation2 summarized risk factors for hospitalization as sociodemographic, clinical, blood and other test results, comorbidity burden, and cardiovascular, noncardiovascular, quality of life, psychosocial, and disease-management factors.Citation2 Others have attempted to synthesize these results by developing models that can be used to predict hospitalization risk.Citation3–Citation9 None of these models has been highly effective in prediction. The C-index (the area under the receiver-operating characteristics [ROC] curve) in the various studies ranged from 0.57 to 0.74, suggesting that important risk factors remain unidentified. The purpose of this study was to assess medication adherence as a predictor of hospitalization in adults with HF in conjunction with other possible predictors.
Poor medication adherence is ubiquitous in chronically ill patient populations.Citation10 In a review of medication adherence in HF, Wu et alCitation11 noted that most investigators have found nonadherence rates of 40%–60% of HF patients. Prior studies have demonstrated that disease-management interventions emphasizing evidence-based medications can decrease hospitalization rates,Citation12 but few studies have addressed the risk of hospitalization associated with medication nonadherence in adults with HF. The few studies that have been done suggest that hospitalization rates are higher when medication adherence is poor.Citation13–Citation16 These studies are limited, however, to retrospective analyses of such electronic data as pharmacy records.
In this study, we describe patterns of prospectively collected, objectively measured medication adherence in a sample of HF patients and test the hypothesis that medication adherence is a significant predictor of hospitalization within 6 months. This approach addresses several important gaps in the literature. First, collecting the data prospectively negates the need for decision rules regarding the coding of electronic data. Second, medication adherence was measured objectively with the Medication Event Monitoring System (MEMS®) (Aardex; MW Healthcare, Richmond, VA, USA), which is more accurate than self-reported medication-adherence data. Third, we used a statistical approachCitation17,Citation18 that allowed us to utilize more fully these medication-adherence data to characterize patients’ adherence patterns and to identify adherence types with similar patterns, rather than the usual approach of classifying adherence using an arbitrarily devised cutoff (usually >80%).Citation19 Fourth, while these methods have been used before to model MEMS adherence data for human immunodeficiency virus-positive patientsCitation17,Citation20 and for African-American patients with hypertension,Citation21 they have not been used before with adherence data from HF patients.
Materials and methods
This was a planned analysis of longitudinal data from a prospective cohort study of a consecutive sample of 280 adults with HF. Subjects were enrolled from three outpatient settings in the northeastern US. Institutional review board approval was obtained at each site, and all participants gave informed consent. Data were collected between 2007 and 2009. A detailed description of study methods has been published previously.Citation22
Patients with a confirmed diagnosis of chronic HF were enrolled, regardless of etiology or ejection fraction. Inclusion criteria addressed the ability to participate (eg, vision, hearing, English literacy, and cognition).Citation15 Cognition was screened using the Telephone Interview of Cognitive Status (TICS).Citation23 Exclusion criteria were major depressive illness, dementia, renal failure requiring dialysis, or a recent history of serious drug or alcohol abuse.
Participants were followed for 6 months, with study visits at baseline, 3, and 6 months. Data on self-care and cognition were collected at each study visit. Most data were collected during home visits by research assistants. Nurses abstracted clinical information from medical records. For this analysis, we tested a wide range of demographic, social support, clinical, self-care, symptom, and cognition variables, so as to add to the knowledge of significant predictors previously identified by others.Citation2
The outcome variable of hospitalization was measured using the electronic medical record at each participating institution. In addition, participants were telephoned monthly and asked about hospitalizations (and also emergency department visits). Medical records were obtained if the visit took place at a hospital outside of the home institution. In this analysis, all hospitalizations were analyzed, regardless of cause (not including emergency department visits).
Measures
MEMS was used to measure medication adherence objectively. Our methods for collecting MEMS data are described in detail elsewhere;Citation24 the MEMS data were used differently in that study. In brief, using a microprocessor in the cap, the MEMS® 6 device measures openings that are presumed to be for the purpose of removing a pill to take it orally. MEMS data were collected on one medication scheduled to be taken at fixed times. MEMS data were collected over a 6-month interval and downloaded at 3 and 6 months. Deviations in use, such as accidental openings, were noted in study diaries and used to correct the time-stamped medication events stored in the device before analysis. In this study, we considered three aspects of adherence based on MEMS data: adherence-pattern types, consistency of adherence patterns with the prescribed rate, and the percentage of prescribed doses taken (PDT). The medication controlled by MEMS did not change for any of the patients during the study. For one patient, the prescribed rate for the medication controlled by MEMS changed during the study. The adherence pattern for this patient was adjusted to account for this change.
Demographic variables, such as age, race, and sex were collected by self-report. In addition to measuring education as the number of years of formal schooling, the American National Adult Reading Test (ANART) was administered as a test of premorbid intellect.
Social support was measured in multiple ways. Marital status was self-reported, as was living alone (yes/no) and the overall quality of the support received defined as “emotional support, information, material help, errands, etc,” with responses ranging from 1 (poor) to 4 (very good). In addition, support from family, friends, and significant others was assessed using the Multidimensional Scale of Perceived Social Support (MSPSS).Citation25 Responses range from 1 (very strongly disagree) to 7 (very strongly agree), with higher scores indicating higher perceptions of support.
Clinical variables included health-related factors, such as exercise in the last week, which was assessed by self-report with responses of 1 (none) to 4 (more than 3 hours). Body mass index (BMI) was calculated from self-reported height and measured body weight. Variables abstracted from the medical record included months since diagnosed with HF, most recent blood urea nitrogen (BUN), creatinine, hemoglobin (Hgb), serum sodium, and ejection fraction. The Charlson Comorbidity IndexCitation26 was completed based on chart review. Any history of sleep apnea, atrial fibrillation, hypertension, diabetes, cerebral disease, renal disease, anemia, or pulmonary hypertension was noted. Pulse and systolic and diastolic blood pressure were measured during the enrollment visit. Treatment quality was rated separately for systolic and diastolic HF, using those treatments advocated in HF clinical guidelines (eg, angiotensin-converting enzyme-inhibitor use, beta-blocker use) in place at the time.Citation27
Self-care was measured with the Self-Care of HF Index (SCHFI), which assesses self-care maintenance, management, and confidence.Citation28 Each scale is standardized to a score of 100, with higher scores indicating better self-care. Knowledge of HF was assessed using the Dutch HF Knowledge ScaleCitation29 with 15 dichotomously scored items; higher scores indicate higher knowledge of HF treatment, HF symptoms, and symptom recognition. The number of medications taken daily was calculated based on a review of medication containers by research assistants during home visits.
Symptoms measured by self-report included trouble breathing or ankle swelling in the past month (yes/no), general health perceptions, rated 1 (excellent) to 5 (poor), and health perception compared to 1 year prior, rated 1 (much better now than 1 year ago) to 5 (much worse now than 1 year ago). Information on functional class was gathered during the home visit using a standardized interview. A single cardiologist scored New York Heart Association (NYHA) class in every subject. Fatigue was measured using two items from the Kansas City Cardiomyopathy Questionnaire.Citation30 Each item is scored 1 to 7; scores were reversed so that higher scores indicated more fatigue. Sleepiness was assessed with the Stanford Sleepiness ScaleCitation31 and the Epworth Sleepiness Scale (ESS).Citation32 ESS respondents rate the likelihood of falling asleep in eight soporific situations on a scale ranging from 0 (never dozing) to 3 (high chance of dozing). ESS scores are summed, with higher scores indicating higher sleepiness or categorized as sleepy (≥11) or not sleepy (<11). Sleep quality was assessed with the Pittsburgh Sleep Quality Index.Citation33 A global score (0–21 points) is obtained by summing the scale domain scores. Higher scores indicate poorer sleep quality; a score >5 is categorized as poor sleep. Depression was measured using the Patient Health Questionnaire.Citation34 Responses range from 0 (not at all) to 3 (nearly every day), with higher scores indicating more depression.
A neuropsychological test battery was administered to measure simple attention (Psychomotor Vigilance Task [PVT]), complex attention (Trail Making Test B), processing speed (Digit Symbol Substitution Test, Trail Making Test A), working memory (Probed Recall Memory task), and short-term memory (Letter–Number Sequencing [LNS] test).Citation35 Transformed lapses >4.69 on the PVT were scored as abnormal.Citation36 Scores on each of the other tests were classified based on age-based norms. In addition, the number of tests scored as abnormal was used as a summary measure of cognitive status.Anyone scoring >1.5 standard deviations on two or more of the cognition tests was scored as having cognitive decline. Efforts made to compensate for perceived memory issues were measured and summarized in the Compensatory Activities Scale.
Data analysis
Other than standard analyses (eg, descriptive statistics), analyses were conducted using the adaptive methods of Knafl et al.Citation17 These methods were used to characterize adherence patterns for individual patients over their 6 months in the study, classify these patterns into adherence types, and identify dichotomous risk factors, individually and in combination, for hospitalization.
Likelihood cross-validation
Adaptive methods use a K-fold likelihood cross-validation (LCV) approach for evaluating and comparing alternative models. Observations (eg, daily MEMS use) are randomly partitioned into K disjoint subsets called folds. For a given model, the likelihood for the data in each fold is computed from model parameter values estimated using the data in the other folds. These deleted fold likelihoods are normalized by the sample size and multiplied up into the LCV score for the model. Larger LCV scores indicate better models for the data under analysis. LCV scores can be used for model selection in any analysis context where parameter estimation is based on maximizing a likelihood or any likelihood-like function (eg, a quasi- likelihood). All analyses used 10-fold LCV scores.
A larger LCV score does not necessarily mean the model is preferable. If the smaller LCV score is not too much smaller and the associated model has a simpler structure (eg, using an untransformed predictor compared to using the log transform of that predictor), then this model is preferable as a parsimonious, competitive alternative. LCV-ratio tests, analogous to likelihood-ratio tests, can be used to assess whether a smaller LCV score is substantially (significantly or distinctly) smaller or not. These are χ2-based tests and are expressed in terms of a cutoff for a substantial percent decrease in the LCV score. The cutoff changes with the sample size (for the formula, see [6] of Knafl et alCitation17).
Individual adherence patterns
The study-participation period for each patient was subdivided into equally sized intervals of length at least 3 days with no more than 100 intervals. Counts of MEMS cap openings and opening rates per day per dose were computed for each interval. These counts and rates were modeled using Poisson regression models (as is appropriate for such data). Both mean adherence and adherence variability based on dispersion parametersCitation37 were modeled as possibly nonlinear functions of time during study participation. LCV scores were based on extended quasi-likelihoods.
The predictors for the Poisson regression models were power transforms of time with possibly fractional (ie, noninteger) powers, and so these are called fractional polynomial models.Citation38 An adaptive process was used to identify an effective set of such power transforms. The adaptive process starts from the constant model and systematically expands the model, adding in power transforms of time to either the mean adherence or dispersion component of the model, continuing as long as the LCV score does not decrease by too much (as determined by an expansion-stopping tolerance parameter). The expanded model is then contracted by removing transforms of time or possibly the intercept term as long as the LCV score does not decrease by too much (as determined by a contraction-stopping tolerance parameter). The transforms of the contracted model determine the adherence pattern underlying the data for how both mean adherence and adherence variability change over time (examples are given in , as described in the “Results” section).
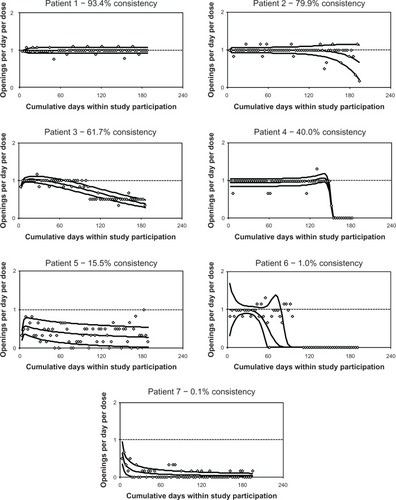
Figure 1 Sample adherence patterns.
Since the prescribed rates were not the same for all patients (ranging from one to three doses per day), adherence patterns were normalized by the prescribed number of doses to be comparable. The ideal adherence pattern is then the one with constant mean adherence equal to 1 and constant adherence variability equal to 0. A summary measure of how consistent the observed adherence pattern is with this ideal pattern is calculated for each patient as a percentage, and so is called percentage consistency.
Adherence types
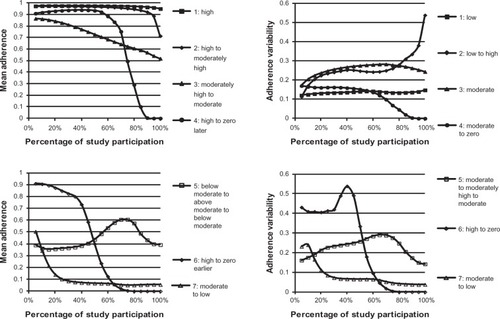
Mean adherence and adherence variability were estimated at 20 proportionally spaced times within each patient’s study participation period (5%, 10%, … 100%). The 40 vectors formed from these two types of estimates were clustered into adherence types, ie, sets of patients with similar mean adherence and adherence variability over time. A wide variety of clustering procedures with varying numbers of clusters were considered.Citation17 These were compared using LCV scores based on likelihoods for multivariate normal-mixture models (as is appropriate for cluster analyses). The selected clustering alternative was the one generating the best score among those with at least 5% of the patients in each cluster (to avoid sparse clusters). Plots of averages of mean adherence and adherence variability (ie, the centroids) were used in interpreting the clusters (see , as described in the “Results” section).
Figure 2 Plots of average mean adherence and of average adherence variability for patients in adherence types.
Identifying risk factors for hospitalization
Potential dichotomous risk factors were identified for the dichotomous hospitalization-outcome variable. Most categorical predictors with more than two values were reduced to dichotomous predictors expected to be risk factors. For example, income level was reduced to not enough as the risk factor versus enough or more than enough. Otherwise, categorical predictors were represented by multiple dichotomous risk factors. For example, employment status was represented by being retired versus not and being unemployed or disabled versus not. For each continuous and ordinal predictor, its observed values were adaptively grouped into two subsets of contiguous values. For each observed value of the predictor (or a rounded value to reduce the number of decimal digits) as a cutoff, LCV scores were computed for the model based on the indicator for having values above or below the cutoff. When a variable had missing values, these were conservatively grouped with the non-risk-factor values so that the effect of the associated risk factor held only for patients with nonmissing values for the underlying variable. The cutoff generating the best LCV score was chosen and the risk factor defined in terms of values either above or below the cutoff, depending on which of these choices had a positive effect on the outcome variable, ie, with odds ratio >1. To avoid sparse cases, only those cutoffs were considered for which at least 5% of the observations fell both above and below the cutoff. When a standard cutoff existed for a predictor (eg, PVT >4.69), that categorization was considered as well.
To be consistent with the handling of other predictors, adherence type was adaptively reduced to a dichotomous risk factor of poor-adherence types versus better-adherence types. Models of hospitalization were used for this purpose. The decision regarding which adherence types to assign to the two alternatives was made adaptively using LCV scores. In contrast to the handling of values for continuous and ordinal predictors, the alternate adherence types were not considered to be ordered.
Data for patients with at least some MEMS data were used to model hospitalization in terms of adherence and other available risk factors, and so data for patients with no MEMS data were missing for these analyses. Only outcome means were adaptively modeled and not outcome dispersions, using unit dispersions for all models (as for standard logistic regression modeling). Bivariate models were generated for all potential risk factors. Then, a multiple risk-factor model was generated considering only the risk factors with a significant (P<0.05) bivariate effect. The adaptive modeling process, as used for generating individual patient adherence patterns in terms of the single predictor of time, was used for this purpose. This multiple risk-factor model provides a parsimonious depiction of the combination of risk factors that affect hospitalization. Next, interactions between the poor-adherence type risk factor with each of the other available risk factors were considered by starting with the model based on these two risk factors and their interaction and adaptively reducing that model to identify cases when an interaction term remained in the model. A multiple risk-factor model was generated considering these identified interaction effects along with the noninteraction risk factors with significant individual effects. Finally, an adaptive model was generated considering this same set of risk factors as well as possible interactions between any two of them to obtain a fuller assessment of interactions between risk factors.
Results
Sample
A total of 280 HF patients participated in the study. Summary statistics are presented in – for available variables within the six categories described earlier. For example, patients were primarily male (64.3%), white (62.5%), and retired (43.9%). Ages ranged from 24 to 89 years with a mean of 62.0 (standard deviation =12.5) years, while education ranged from 8 to 29 years with mean of 13.9 (standard deviation =2.9) years. Over the course of the 6-month study, 103 (36.8%) of the patients were hospitalized.
Table 1 Summary statistics for available demographic variables
Table 2 Summary statistics for available social support variables
Table 3 Summary statistics for available clinical variables
Table 4 Summary statistics for available self-care variables
Table 5 Summary statistics for available symptom variables
Table 6 Summary statistics for available cognition variables
Individual patient adherence patterns
MEMS adherence data were available for 218 (77.9%) patients. Of these patients, 79 (36.2%) were hospitalized during the study. Hospitalization rates were not significantly different for patients with no MEMS data versus some MEMS data (χ2[1[=0.13, P=0.722).
contains plots of adherence patterns for seven exemplar patients. The y-axis of these plots is openings per day per dose with an ideal value of 1, while the x-axis is cumulative days of study participation. The raw data are plotted as diamonds. The middle curve is the estimated mean adherence over time, while the other curves are unit error bands, ±1 estimated standard deviation (as extended to account for nonlinear dispersion) around mean adherence.
Patient 1 had mean adherence close to the prescribed rate with small variability, which was 93.4% consistent with adherence at the prescribed rate. Patient 2’s mean adherence was close to the prescribed rate, with small variability up to about 120 days of study participation. After that, mean adherence decreased somewhat with increased variability for 79.9% consistency with the prescribed rate. Patient 3 had deteriorating mean adherence from about the prescribed rate to around half the prescribed rate, with low variability and 61.7% consistency. Patient 4 ’s mean adherence was close to the prescribed rate, with small variability up to about 150 days of study participation, after which adherence dropped to essentially zero for 40.0% consistency. Patient 5 had relatively consistent mean adherence at around half the prescribed rate, with moderate variability and 15.5% consistency. Patient 6’s mean adherence started at about the prescribed rate and decreased to zero by about 90 days of study participation, with variability decreasing for a while and then increasing. After that, adherence remained at zero. This pattern was only 1.0% consistent with prescribed adherence. In contrast, the PDT for this patient was 48.9%, suggesting that the patient was adherent at around half the prescribed rate. The plot indicates that patient 6 was adherent around the prescribed rate for about half the time and zero adherent the rest of the time, resulting in a percentage PDT close to 50%, but never around 50% at any time. In cases like this, percentage PDT provides a misleading assessment of adherence, since it is based on an assumption of constant adherence over time. Patient 7 had mean adherence starting around half the prescribed rate and deteriorating quickly to nearly zero, with low variability and 0.1% consistency.
Adherence types
Cluster analysis identified seven adherence types. contains plots of averages of mean adherence and of adherence variability for patients in the seven clusters. These plots were used to generate the interpretations of the adherence types given in . The clusters were numbered so that averages of percentage consistency and percentage PDT decreased. Consequently, cluster 1 corresponded to the best adherence type, with mean adherence consistently very close to the prescribed rate and adherence variability consistently low. Cluster 7 corresponded to the worst adherence type, with mean adherence starting at about half the prescribed rate and moderate adherence variability, then deteriorating quickly to low, not too much above zero mean adherence and adherence variability. The adherence patterns of patients 1–7 were allocated to clusters 1–7, respectively. The individual patterns of are only similar to the associated plots of since these latter plots are based on averages.
Table 7 Description of adherence types
Risk factors for hospitalization
The adaptively generated dichotomous risk factor based on the seven adherence types for predicting hospitalization was the poor-adherence type, consisting of clusters 4, 6, and 7, versus better adherence, consisting of clusters 1–3 and 5. presents results for characterizing hospitalization, considering the variables of –. Individual risk-factor analyses identified 21 significant (P<0.05) risk factors for hospitalization: two demographic, zero social support, seven clinical, five self-care, six symptom, and one cognition. The cutoff for a substantial percentage decrease in LCV scores for a sample of size 218 is 0.68%. The percentage decrease exceeded this cutoff for 16 (76.2%) of the 21 variables (LCV scores not reported), indicating that LCV ratio tests are more conservative than tests for zero coefficients, and so are similar to multiple-comparison approaches. All standard classifications except the one for BUN were nonsignificant, but this was equivalent to the adaptive BUN classification.
Table 8 Significant individual risk factors for hospitalization
Results for the adaptive multiple risk-factor model generated considering the 21 significant risk factors of are reported in . This model had five risk factors: lower Hgb, lower ejection fraction, poor adherence type, higher total number of prescribed medications, and NYHA class IV. The model had two clinical, two self-care, and one symptom risk factors, and no demographic, social support, or cognition risk factors. The LCV score was 0.56979. In contrast, the best individual risk-factor model based on poor MEMS adherence had an LCV score of 0.53527, with substantial percentage decrease of 6.06%, indicating that the multiple risk-factor model substantially improved on each of the individual risk-factor models.
Table 9 Multiple risk-factor model for hospitalization
Interactions with poor-adherence type were identified for three risk factors: poor-adherence type with lower ANART score (≤34, 32 [14.7%] patients), with higher MSPSS score (≥54, 59 [27.1%] patients), and with lower LNS score (≤8, 41 [18.8%] patients). The percentage decrease in LCV score for the model based on the poor-adherence type was insubstantial at 0.35% for the second of these interactions (with MSPSS score), but was substantial at 1.35% for the first and at 1.68% for the third.
The adaptive multiple risk-factor model generated considering these three interactions and the 21 significant risk factors of included the single interaction between the poor-adherence type and lower LNS score. It also included the same four nonadherence risk factors from the noninteraction model of . The LCV score was 0.58318, which was a substantial improvement on the noninteraction multiple risk-factor model with percentage decrease in the LCV score of 2.30%.
The adaptive model considering pair-wise interactions is described in and included seven interactions (and no noninteraction risk factors):
Table 10 Multiple risk-factor interaction model for hospitalization
poor-adherence type and lower LNS score
higher number of comorbid conditions and higher number of medications
higher BUN and lower percentage PDT
lower Hgb and much worse perceived health now compared to last year
older age and lower TICS score
higher BMI and lower Hgb
lower ejection fraction and higher fatigue.
The C-index for this model was 0.83 (values between 0.8 to 0.9 are considered to provide excellent discriminationCitation39).
To assess the possibility of collinearity between these seven interactions, we computed logistic regression models predicting each of these seven interactions as a function of the other six. The largest Nagelkerke R2 value for these models was 9.5%, indicating that collinearity was not a problem for the seven-interaction model.
Patients had zero to five of these risk factors. Of the 62, 63, 59, 19, eleven, and four patients with zero to five of these interaction risk factors, respectively, the percentage hospitalized was 9.7%, 19.1%, 54.2%, 79.0%, 90.9%, and 100%. The hospitalization risk index model based on the count of the number of these risk factors as the only predictor of hospitalization had an LCV score of 0.61594, which provided a substantial improvement over the seven-interaction model, with percentage decrease in the LCV score of 1.18%. This model has a C-index of 0.82. As an example, using a cutoff of 0.5 for generating predictions (ie, predictions based on maximum likelihood), the sensitivity is 77.2% and the specificity 77.0%, and so well balanced.
Discussion
In this prospective study, we confirmed that both a poor type of medication adherence pattern and a low percentage of prescribed doses taken were important predictors of hospitalization in adults with HF. In addition, we identified low Hgb, depressed ejection fraction, NYHA class IV, and taking 12 or more medications daily as risk factors for hospitalization. When interactions were considered, seven combinations of factors increased the predictive capability of the model: 1) poor-adherence type and lower score on a test of short-term memory, 2) higher number of comorbid conditions and higher number of daily medications, 3) poor kidney function (higher BUN) and lower percentage prescribed doses taken, 4) lower Hgb and perceptions of poor health, 5) older age and lower score on the TICS, 6) higher BMI and lower Hgb, and 7) lower ejection fraction and higher fatigue. Patients with none of these seven interactions were unlikely to be hospitalized, but all of those with five of the seven interaction risk factors were hospitalized over the 6-month period.
A pattern of poor medication adherence and taking a low percentage of prescribed doses were both associated with hospitalization in this sample. These results are consistent with prior research,Citation13,Citation14,Citation40,Citation41 but those studies measured adherence using administrative claims data or retrospective review of hospital records, so the pattern of adherence and the percentage of doses taken could only be inferred. What this study adds is the prospective analysis of individual patterns of medication-taking behavior in relation to hospitalization.
An important factor interacting with a poor medication-adherence type was impaired cognition. Cognitive deficits occur in a significant proportion of adults with chronic HF,Citation42 including deficits in memory.Citation43 Prospective memory has been demonstrated to be related to medication adherence.Citation44 Although short-term memory as measured by the LNS and prospective memory are related, prospective memory is more encompassing, referring specifically to the ability to remember to do something in the future.Citation44 As taking medication on a schedule requires that patients remember to do so, this result suggests that HF patients who have not compensated for poor memory with a strategy to assist them to remember medications are at increased risk of hospitalization. One physiologic factor known to be associated with impaired cognition is poor kidney function.Citation45 In this study, higher BUN levels interacted with taking a lower percentage of prescribed medication doses to predict hospitalization. A memory device to facilitate adherence may be particularly important in HF patients with impaired kidney function.
We found that patients taking multiple daily medications were likely to be hospitalized, perhaps because they were not taking their medications as prescribed.Citation46 This was especially true in patients with more comorbid illnesses, where the number of medications and comorbid illnesses interacted to predict hospitalizations. This result is not surprising, considering the profile of those individuals with multiple chronic conditions who are taking numerous medications. Illness symptoms and medication side effects can be expected to make routine medication adherence challenging.Citation47
Low Hgb, low ejection fraction, and poor functional status all predicted hospitalization. Previous investigators have identified a wide variety of clinical factors associated with hospitalization, including anemia.Citation48 Although correction of anemia has been shown to slow the progression of HF and reduce hospitalization rates,Citation49 more than one-third of the participants in our study were anemic using the World Health Organization definitions of <13% for men and <12% for women. Correction of anemia with subcutaneous erythropoietin is advocated in clinical guidelines and covered in the US by Medicare,Citation50 but expense still may be limiting its widespread use. Low Hgb interacted with self-reported perceptions of poor health, suggesting that those patients who were anemic were symptomatic enough to label themselves as getting worse over time. Low Hgb also interacted with high BMI, as might be expected for two conditions that cause high output failure. Depressed ejection fraction and poor NYHA functional class were both independently associated with hospitalization, as has been shown by other investigators.Citation2
Limitations of this study include the relatively small sample size, compared to epidemiologic studies conducted with thousands of respondents, collected from a single region in the US. Participants were younger and better educated than other community samples. Strengths include the prospective design, the objective measurement of medication adherence, and the sophisticated statistical approach that accounted for general nonlinear adherence trajectories rather than simply categorizing adherence using the >80% cutoff in percentage PDT used by most prior investigators. This nuanced approach to understanding medication-adherence patterns provides important insights into patient behavior that cannot be discerned from epidemiologic research.
Future research is needed to identify predictors of nonadherence. The World Health Organization adherence model suggests that socioeconomic, condition, therapy, patient, and health care-system dimensions contribute to nonadherence,Citation51 and further research is needed to explore these dimensions. Efforts to identify the strategies used by HF patients to remember medications is needed. Finally, it will be important to include cost in future studies, because Sokol et alCitation40 demonstrated that although nonadherence was associated with higher hospitalization risk in HF patients, there were no differences in costs compared to those who were more adherent.
Acknowledgments
This work was funded by a grant from the National Heart, Lung and Blood Institute (R01 HL084394-01A1) and by the Philadelphia Veterans Affairs Medical Center, VISN 4 Mental Illness Research, Education, and Clinical Center (MIREC). The authors gratefully acknowledge Megan Patey, RN, BSN for her assistance with preparation of the data for analysis.
Disclosure
The authors report no conflicts of interest in this work.
References
- HeidenreichPAAlbertNMAllenLAForecasting the Impact of Heart Failure in the United States: a policy statement From the American Heart AssociationCirc Heart Failure201363606619
- GiamouzisGKalogeropoulosAGeorgiopoulouVHospitalization epidemic in patients with heart failure: risk factors, risk prediction, knowledge gaps, and future directionsJ Card Fail2011171547521187265
- PhilbinEFDiSalvoTGPrediction of hospital readmission for heart failure: development of a simple risk score based on administrative dataJ Am Coll Cardiol19993361560156610334424
- KrumholzHMChenYTWangYVaccarinoVRadfordMJHorwitzRIPredictors of readmission among elderly survivors of admission with heart failureAm Heart J20001391 Pt 1727710618565
- FelkerGMLeimbergerJDCaliffRMRisk stratification after hospitalization for decompensated heart failureJ Card Fail200410646046615599835
- PocockSJWangDPfefferMAPredictors of mortality and morbidity in patients with chronic heart failureEur Heart J2006271657516219658
- YamokoskiLMHasselbladVMoserDKPrediction of rehospitalization and death in severe heart failure by physicians and nurses of the ESCAPE trialJ Card Fail200713181317338997
- KeenanPSNormandSLLinZAn administrative claims measure suitable for profiling hospital performance on the basis of 30-day all-cause readmission rates among patients with heart failureCirc Cardiovasc Qual Outcomes200811293720031785
- AuAGMcAlisterFABakalJAEzekowitzJKaulPvan WalravenCPredicting the risk of unplanned readmission or death within 30 days of discharge after a heart failure hospitalizationAm Heart J2012164336537222980303
- ColemanCILimoneBSobierajDMDosing frequency and medication adherence in chronic diseaseJ Manage Care Pharm2012187527539
- WuJRMoserDKLennieTABurkhartPVMedication adherence in patients who have heart failure: a review of the literatureNurs Clin North Am2008431133153 vii–viii18249229
- CorreiaJSilvaFFRoqueCVieiraHProvidenciaLAImpact of a specialized outpatient heart failure follow-up program on hospitalization frequency and functional status of patients with advanced heart failureRev Port Cardiol200726433534317695729
- EspositoDBagchiADVerdierJMBencioDSKimMSMedicaid beneficiaries with congestive heart failure: association of medication adherence with healthcare use and costsAm J Manag Care200915743744519589011
- FitzgeraldAAPowersJDHoPMImpact of medication nonadherence on hospitalizations and mortality in heart failureJ Card Fail201117866466921807328
- AmbardekarAVFonarowGCHernandezAFPanWYancyCWKrantzMJCharacteristics and in-hospital outcomes for nonadherent patients with heart failure: findings from Get With The Guidelines – Heart Failure (GWTG-HF)Am Heart J2009158464465219781426
- ColeJANormanHWeatherbyLBWalkerAMDrug copayment and adherence in chronic heart failure: effect on cost and outcomesPharmacotherapy20062681157116416863491
- KnaflGJDelucchiKLBovaCAFennieKPDingKWilliamsABA systematic approach for analyzing electronically monitored adherence dataEkwallBCronquistMMicro Electro Mechanical Systems (MEMS) Technology, Fabrication Processes and ApplicationsHauppauge (NY)Nova Science2010166
- KnaflGJFennieKPBovaCDieckhausKWilliamsABElectronic monitoring device event modelling on an individual-subject basis using adaptive Poisson regressionStat Med200423578380114981675
- WuJRMoserDKDe JongMJDefining an evidence-based cutpoint for medication adherence in heart failureAm Heart J2009157228529119185635
- BovaCFennieKPDieckhausKKnaflGJWatrousEWilliamsABUse of electronic monitoring devices to measure antiretroviral adherence: practical considerationsAIDS Behav20059110311015812617
- KnaflGJSchoenthalerAOgedegbeGSecondary analysis of electronically monitored medication adherence data for a cohort of hypertensive African-AmericansPatient Prefer Adherence2012620721922536057
- RiegelBMoelterSTRatcliffeSJExcessive daytime sleepiness is associated with poor medication adherence in adults with heart failureJ Card Fail201117434034821440873
- BuckwalterJGCrooksVCPetittiDBA preliminary psychometric analysis of a computer-assisted administration of the Telephone Interview of Cognitive Status – modifiedJ Clin Exp Neuropsychol200224216817511992199
- RiegelBLeeCSRatcliffeSJPredictors of objectively measured medication nonadherence in adults with heart failureCirc Heart Fail20125443043622647773
- ZimetGDDahlemNWZimetSGFarleyGKMultidimensional scale of perceived social supportFischerJCorcoranKMeasures for Clinical Practice: A Sourcebook. Volume 2 – Adults2nd edNew YorkFree Press1994
- CharlsonMPompeiPAlesKMacKenzieCA new method of classifying prognostic comorbidity in longitudinal studies: development and validationJ Chronic Dis19874053733833558716
- Heart Failure Society of AmericaHFSA 2006 Comprehensive Heart Failure Practice GuidelineJ Card Fail2006121e1e216500560
- RiegelBLeeCSDicksonVVCarlsonBAn update on the self-care of heart failure indexJ Cardiovasc Nurs200924648549719786884
- van der WalMHJaarsmaTMoserDKvan VeldhuisenDJDevelopment and testing of the Dutch Heart Failure Knowledge ScaleEur J Cardiovasc Nurs20054427327716126459
- GreenCPPorterCBBresnahanDRSpertusJADevelopment and evaluation of the Kansas City Cardiomyopathy Questionnaire: a new health status measure for heart failureJ Am Coll Cardiol20003551245125510758967
- MacLeanAWFekkenGCSaskinPKnowlesJBPsychometric evaluation of the Stanford Sleepiness ScaleJ Sleep Res199211353910607023
- JohnsMWReliability and factor analysis of the Epworth Sleepiness ScaleSleep19921543763811519015
- BuysseDReynoldsCF3rdMonkTHBermanSRKupferDJThe Pittsburgh Sleep Quality Index: a new instrument for psychiatric practice and researchPsychiatry Res19892821932132748771
- KroenkeKSpitzerRWilliamsJThe PHQ-9: Validity of a brief depression severity measureJ Gen Intern Med200116960661311556941
- LezakMHowiesonDLorigDNeuropsychological Assessment4th edNew YorkOxford University Press2004
- DingesDPowellJMicrocomputer analyses of performance on a portable, simple visual RT task during sustained operationsBehav Res Methods Instrum Comput1985176652655
- McCullaghPNelderJBGeneralized Linear ModelsBoca Raton (FL)Chapman and Hall/CRC1999
- RoystonPAltmanDGRegression using fractional polynomials of continuous covariates: parsimonious parametric modelingAppl Stat1994433429467
- HosmerDWLemeshowSApplied Logistic Regression2nd edNew YorkJohn Wiley & Sons2000
- SokolMCMcGuiganKAVerbruggeRREpsteinRSImpact of medication adherence on hospitalization risk and healthcare costMed Care200543652153015908846
- MichalsenAKonigGThimmeWPreventable causative factors leading to hospital admission with decompensated heart failureHeart19988054374419930040
- PresslerSJCognitive functioning and chronic heart failure: a review of the literature (2002–July 2007)J Cardiovasc Nurs200823323924918437066
- PresslerSJSubramanianUKarekenDCognitive deficits in chronic heart failureNurs Res201059212713920216015
- ZoggJBWoodsSPSaucedaJAWiebeJSSimoniJMThe role of prospective memory in medication adherence: a review of an emerging literatureJ Behav Med2012351476221487722
- HailpernSMMelamedMLCohenHWHostetterTHModerate chronic kidney disease and cognitive function in adults 20 to 59 years of age: Third National Health and Nutrition Examination Survey (NHANES III)J Am Soc Nephrol20071872205221317554148
- TsaiKTChenJHWenCJMedication adherence among geriatric outpatients prescribed multiple medicationsAm J Geriatr Pharmacother2012101616822264853
- DicksonVVBuckHRiegelBMultiple comorbid conditions challenge heart failure self-care by decreasing self-efficacyNurs Res20136212923052421
- PittBMale gender, diabetes, COPD, anemia, and creatinine clearance <30 mL/min predicted hospitalization after heart failure diagnosisAnn Intern Med20101528JC4-2JC4-3
- SilverbergDSWexlerDBlumMThe correction of anemia in severe resistant heart failure with erythropoietin and intravenous iron prevents the progression of both the heart and the renal failure and markedly reduces hospitalizationClin Nephrol200258Suppl 1S37S4512227725
- NaciHde LissovoyGHollenbeakCHistorical clinical and economic consequences of anemia management in patients with endstage renal disease on dialysis using erythropoietin stimulating agents versus routine blood transfusions: a retrospective cost-effectiveness analysisJ Med Econ201215229330422115328
- World Health OrganizationAdherence to long-term therapies: Evidence for actionGenevaWorld Health Organization2003 Available from: http://www.who.int/chp/knowledge/publications/adherence_full_report.pdfAccessed November 22, 2013