
Abstract
Background
The main objective of this study was to investigate the relationship between adherence and both clinical (ie, glycated hemoglobin [HbA1c]) and nonclinical (ie, health status, work impairment, and health care-resource use) health outcomes among type 2 diabetes (T2D) patients using basal insulin.
Materials and methods
The 2012 US National Health and Wellness Survey dataset was used for this study (n=71,141). A total of 1,198 respondents who reported a diagnosis of T2D, were currently using basal insulin, and reported both their HbA1c and level of nonadherence were included in the analyses. Classical test theory and item response theory (IRT) analyses were used to provide evidence for the Morisky Medication Adherence Scale (MMAS) in this population. Adherence was then used as a predictor of HbA1c and nonclinical outcomes using regression modeling, controlling for demographics and health history.
Results
A total of 61.44% of respondents were male, and the mean age was 60.65 (standard deviation 10.74) years. Internal consistency of the eight-item MMAS (MMAS-8) was adequate (Cronbach’s α =0.68), and one factor was retained (eigenvalue =1.80). IRT analyses suggested that the MMAS-8 was most precise for those with high levels of nonadherence. A significant relationship between variables emerged, whereby each point increase in the level of nonadherence was associated with a 0.21 increase in HbA1c (B=0.212, P<0.05). A modest quadratic trend was also observed (B=0.026, P<0.05), indicating that the benefit to HbA1c may taper off at high adherence. Each point of nonadherence was associated with a 4.6%, 20.4%, and 20.9% increase in the number of physician visits, emergency room visits, and hospitalizations, respectively.
Discussion
This study provides evidence that adherence rates are high among patients with T2D using basal insulin, and the MMAS-8 is a reliable and valid tool to assess adherence. Further, the results suggest that HbA1c increases concomitantly with nonadherence, as do poorer health status and health care-resource use.
Introduction
Diabetes is a chronic, progressive condition estimated to affect 8% of the US population, the majority of whom are diagnosed with type 2 diabetes (T2D).Citation1 If not managed properly, this disease can lead to future complications, including myocardial infarction, stroke, neuropathy, and even death.Citation1–Citation4 Research has suggested that lowering glycated hemoglobin (HbA1c) to 7% or less is associated with a reduction in the risk of these microvascular and macrovascular complications.Citation2
Basal insulin has been shown to return glycemic levels to the normal range when used properly. “Proper use” entails two major dimensions of patient behavior with respect to treatment: persistence; defined as continuing treatment for the prescribed duration, and adherence; defined as the extent to which a medication is taken at the prescribed intervals, dosing, and frequency.Citation5
Due to the wealth of pharmaceutical claims data, persistence has been well studied among patients with T2D. Indeed, several studies have shown that persistence in basal insulin use has been associated with a greater likelihood of meeting glycemic goals and also greater cost savings.Citation6–Citation8 Unfortunately, these studies have not accounted for the adherence dimension of proper use (ie, not just the time on treatment but also using the treatment as prescribed). This is particularly relevant to basal insulins, which must be dosed at regular intervals and at the correct dose in order to achieve normalization of HbA1c.
The current study focuses on the dimension of medication adherence among patients with T2D using basal insulin. Assessments of medication adherence with insulin dosing, frequency, and timing have revealed generally suboptimal use of the medication.Citation9–Citation11 Adherence can be influenced by a range of complex individual, environmental, and behavioral factors. Researchers have identified an array of predictors of nonadherence,Citation12,Citation13 including difficulty reading prescription labels,Citation14 increased intensity of treatment,Citation14 increased symptom burden,Citation15 inadequate self-monitoring,Citation16 and inadequate disease knowledge.Citation17 In addition, the role of personality,Citation18 ethnicity,Citation19 cost of care,Citation20 physician characteristics,Citation21 health literacy and education,Citation22,Citation23 disease and medication beliefs,Citation24 and psychopathology have also been explored.Citation25 A number of interventions to increase adherence have also been examined in the literature, including those led by a pharmacist,Citation26 multidisciplinary teams,Citation27 and further utilization of technology.Citation28,Citation29 These trials note the ongoing challenge of promoting behavior change in the management of chronic disease conditions.Citation30
Although the impact of poor adherence on disease control has been assumed to be significant, few studies have directly assessed the relationship between adherence and key disease-outcome measures, such as HbA1c. The Morisky Medication Adherence Scale (MMAS) is a multi-item survey instrument that assesses drug adherence.Citation31 A recent article by Krapek et al noted that patient-reported adherence is a predictor of HbA1c using the four-item MMAS.Citation32 A broader examination of the effect of adherence on both clinical and nonclinical outcomes has not yet been investigated in this population. Furthermore, the MMAS has since been expanded into an eight-item instrument (MMAS-8) with the potential to provide more precise assessments of adherence.Citation33 Since the MMAS was not specifically developed to study insulin dosing, a preliminary aim of the current study was to provide evidence for the validity of the MMAS-8 as a patient-reported instrument in T2D. The main objective of the study was an exploration of the MMAS-8 and its relationship with glycemic control outcomes (HbA1c levels) and other nonclinical outcome measures.
Materials and methods
Data source
The 2012 US National Health and Wellness Survey (NHWS) data set was used for this study (n=71,141). The NHWS is a cross-sectional, Internet-based survey administered to a sample of adults (18 years and older) recruited to a panel through opt-in emails, coregistration with other panels, e-newsletter campaigns, and online banner placements. All panelists explicitly agreed to become panel members, registered through unique email addresses, and completed in-depth demographic registration profiles.
Invitations to participate in the NHWS were sent using a random stratified sampling framework to ensure the final sample of NHWS participants was representative of the adult population in the US. Each year, data from the Current Population Survey of the US Census are used to identify the relative proportions of age, sex, and racial/ethnic groups in the US, which are then mimicked during the recruiting of panel members.Citation34 Comparisons between the NHWS and other established sources (eg, US Census, National Health Interview Survey, National Health and Nutrition Examination Survey, Medical Expenditure Panel Survey, etc) have been made elsewhere.Citation35–Citation37
Sample
Among the 71,141 respondents who completed the 2012 US NHWS, the following inclusion criteria were specified: reported diagnosis of T2D and currently using insulin glargine or insulin detemir. The following exclusion criteria were specified: missing or unknown HbA1c values (as this was the primary outcome) or missing adherence data (as this was the primary predictor).
Measures
Medication nonadherence
The MMAS-8, a patient-reported instrument with evidence of validity, was used to assess medication nonadherence.Citation33
HbA1c
All respondents who reported a diagnosis of T2D were asked to provide their most recent level of HbA1c. Although respondents had the option of selecting “don’t know”, these respondents were not included in the analyses, as per the aforementioned exclusion criteria.
Health outcomes
Health status was measured using the Short Form (36) Health Survey, version 2 (SF-36v2); both mental and physical component summary scores were included in the analysis (normed to the US population), along with health state utilities.Citation38 Work-related (ie, absenteeism, presenteeism, and overall work impairment) and activity-related impairment were assessed using the general health version of the Work Productivity and Activity Impairment questionnaire (WPAI-GH).Citation39 The total number of physician visits, emergency room (ER) visits, and hospitalizations in the past 6 months were also reported.
Sociodemographics
Age, race/ethnicity, sex, marital status (married/living with partner versus all else), education (less than college graduate versus college graduate or more), and annual household income (<$25,000, $25,000 to <$50,000, $50,000 to <$75,000, ≥$75,000, declined to answer) were assessed.
Health history
Each respondent was asked to provide information on their height and weight, which was then converted to a level of body mass index (BMI) and categorized according to Centers for Disease Control and Prevention criteria (ie, underweight, normal weight, overweight, obese, and declined to answer). The Charlson Comorbidity Index (CCI) was used to assess overall comorbidity burden.Citation40 The CCI is calculated by weighting the presence of multiple conditions, including human immunodeficiency syndrome/acquired immunodeficiency syndrome, metastatic tumor, lymphoma, and others. The greater the total index score, the greater the comorbid burden on the patient.
Statistical analysis
Classical test theory analyses were used to document the evidence of reliability and validity of the MMAS-8. These analyses included internal consistency using Cronbach’s α, inter-item correlations, item-to-total correlations, and exploratory factor analysis (using principal axis factoring with a varimax rotation). Item response theory (IRT) analyses were also conducted to further provide psychometric evidence of the MMAS-8 and its individual items. Specifically, we compared the fit of a one-parameter (which assumes equivalent discrimination among items) versus a two-parameter (which allows discrimination to vary) model and examined item characteristic curves, item information curves, and test information curves.
Multiple regression models were then conducted to examine the relationship between nonadherence and HbA1c, controlling for relevant sociodemographic and health history variables. These covariates included age, sex, race/ethnicity, marital status, education, annual household income, employment, insurance, BMI category, alcohol use, smoking behavior, exercise behavior, and the CCI. Higher-order trends (ie, quadratic, cubic) were also examined to determine the functional relationship between nonadherence and HbA1c. A higher-order trend was only examined if the immediate lower order was significant (eg, only if a linear relationship was significant would a quadratic relationship be tested; only if a quadratic relationship was significant would a cubic relationship be tested, etc).
Additional regression models were then conducted to assess the relationship between nonadherence and other health outcomes, controlling for the same sociodemographic and health history variables previously noted. Multiple regression (ie, ordinary least squares) models were used for health status variables, while generalized linear models (specifying a negative binomial distribution and a log-link function) were used for work-productivity and resource-use variables, because of pronounced skew. Statistical significance was set a priori at P<0.05.
Results
A total of 1,198 respondents reported a diagnosis of T2D, were currently using basal insulin, and reported both their HbA1c and level of nonadherence; 61.44% of these respondents were male, and the mean age was 60.65 years (standard deviation 10.74; see ). Engagement in nonadherent behaviors (the individual items of the MMAS-8) varied considerably, from stopping medication when feeling worse (5.76%) to having difficulty remembering to take all medications (32.22%) (see ). Internal consistency of the MMAS-8 was adequate (Cronbach’s α=0.68), although it would have been improved upon removal of the “Did you take your medicine yesterday?” item (Cronbach’s α=0.70 if removed). Indeed, this particular item was not significantly related to the total score (r=0.05).
Table 1 Demographics and diabetes characteristics of the study sample (n=1,198)
Table 2 Frequency of endorsement and internal consistency of the eight-item Morisky Medication Adherence Scale (MMAS-8) items
Exploratory factor analysis results suggested that one factor be retained (eigenvalue =1.80). Given this unidimensionality, IRT analyses were then undertaken, and revealed that a two-parameter model was a significantly better fit than a one-parameter model based on both a lower Akaike information criterion (AIC) (6844.79 versus 6965.94) and a significant likelihood-ratio test (χ2[7]=135.15, P<0.05).
Using a two-parameter model, item difficulty and discrimination were reported for each item (see ). Items with the strongest discrimination included any day’s medicine not taken, sometimes forgetting, and having difficulty remembering to take all medications (2.81, 2.47, and 2.21, respectively) (see ). Most other items exhibited solid psychometric properties (eg, discrimination >1.40); however, “Did you take your medicine yesterday?” provided little information (discrimination =0.20, information =0.02). The item characteristic curves are shown in and .
Figure 1 Item characteristic curves of the eight-item Morisky Medication Adherence Scale.
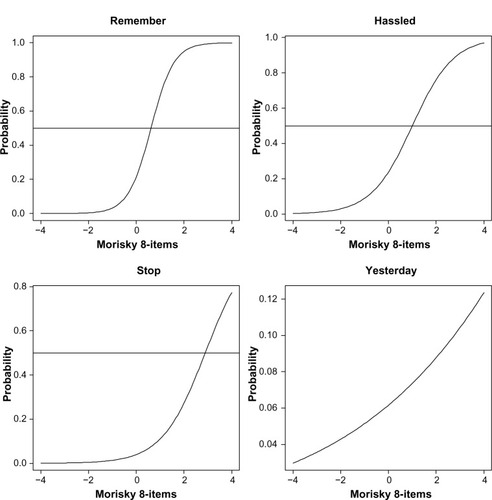
Figure 2 Item characteristic curves of the eight-item Morisky Medication Adherence Scale.
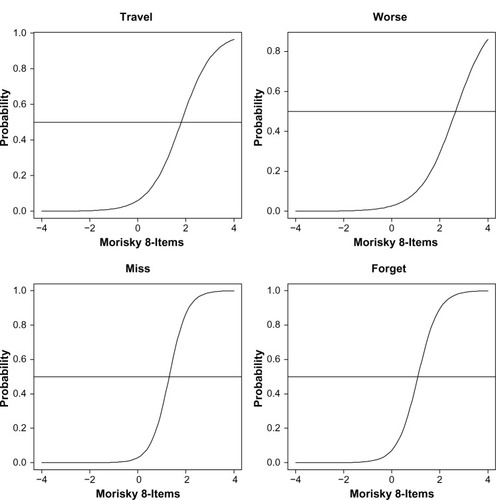
Table 3 Item-level properties of the eight-item Morisky Medication Adherence Scale (MMAS-8)
Individual items of the MMAS-8 were then examined with respect to their information (see ). Greater information indicates greater precision in measuring nonadherence at that level of nonadherence. For example, any days when medicine not taken, and sometimes forgetting, had the greatest level of information (as also shown in ), and this level of information was highest between the mean (θ=0) and two standard deviations above the mean (θ=2). Indeed, the information curves for most items generally peaked between zero and two standard deviations above the mean, with ever stopping because of feeling worse, and sometimes stopping because of feeling that the condition is under control, both exhibiting the greatest level of information, slightly above two standard deviations above the mean.
Figure 3 Item and test information curves of the eight-item Morisky Medication Adherence Scale.
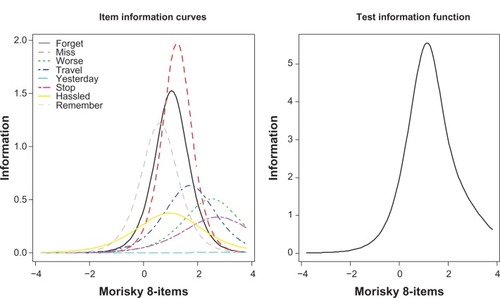
The test information curve (ie, the sum of the individual item information curves) demonstrated that information is generally low until the mean (θ=0), peaks between zero and two standard deviations above the mean, and then gradually tails off. As information is a measure of the precision of the instrument, it can be said that the MMAS-8 is the most precise at measuring nonadherence when the level of nonadherence is above the mean, particularly between zero and two standard deviations.
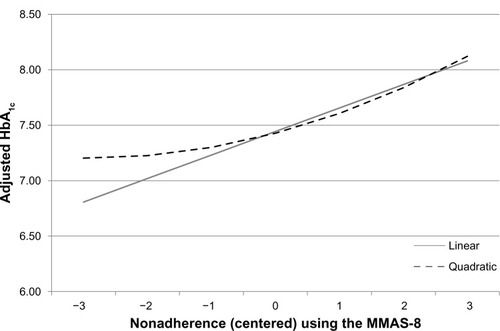
Given the evidence of the MMAS-8 as an instrument that is reliably capturing a unidimensional construct of nonadherence, analyses were then conducted to examine the relationship between nonadherence and HbA1c. A significant relationship between these variables was uncovered, whereby each point increase in the level of nonadherence was associated with a 0.21 increase in HbA1c (B=0.212, P<0.05). A modest quadratic trend was also observed (B=0.026, P<0.05) indicating that HbA1c levels out and does not continue improving with increasing adherence; therefore, the benefit to HbA1c of high adherence may be limited. No cubic was observed, and as a result no further trends were examined. The regression lines are graphically displayed in .
Figure 4 Adjusted levels of HbA1c as a function of nonadherence.
Abbreviations: MMAS-8, eight-item Morisky Medication Adherence Scale; HbA1c, glycated hemoglobin.
Nonadherence was also used as a predictor of nonclinical health outcomes, including health status (SF-36v2), work productivity and activity impairment (WPAI-GH), and health care-resource use. With respect to health status, poorer adherence was associated with significantly worse summary and domain scores, with the exception of the physical component summary score (see ). Each point increase in nonadherence was associated with a decrease of between 0.46 (bodily pain) and 1.41 (mental component summary scores), holding sociodemographics and health history variables constant. Health utilities decreased 0.011 points for every point increase in nonadherence. Given the size of these effects, an adherence change of 2–3 points would yield a clinically meaningful change in health status (defined as 3 points on a norm-based summary/domain score and 0.03 points for health utilities). Nonadherence was not associated with any significant change in work-productivity metrics (see ). However, nonadherence was associated with a modest increase (6.4%) in activity-related impairment (B=0.06, rate ratio 1.06; P<0.05). Nonadherence was also associated with a significant increase in the number of resource-use events. Specifically, each point of nonadherence was associated with a 4.6%, 20.4%, and 20.9% increase in the number of physician visits, ER visits, and hospitalizations, respectively (physician visits, B=0.05, rate ratio 1.05, P<0.05; ER visits, B=0.19, rate ratio 1.20, P<0.05; hospitalizations, B=0.19, rate ratio 1.21, P<0.05).
Table 4 Summary table of adjusted relationship between non-adherence and health status summary and domain scores (Short Form [36] Health Survey, version 2)
Table 5 Summary table of adjusted relationship between nonadherence and work productivity and activity impairment scores
Discussion
Patient adherence to medication continues to be a major challenge in the long-term management of T2D. Yet there is a lack of research regarding the relationship between patient nonadherence and disease outcomes, and the field continues to struggle with measurement issues of adherence itself. Patient-reported assessments of adherence are certainly among the easiest to administer, though they have been criticized due to their potential for inaccuracy. The current study sought to provide some evidence that a patient-reported instrument, the MMAS-8, can be used reliably in this patient population.
Indeed, the results suggest the MMAS-8 was measuring a single construct and was generally internally consistent (though, taking medication yesterday, was not a particularly helpful item in patients with T2D using basal insulin). Further, the IRT analyses suggest that most items perform well (again, with the exception of taking medication yesterday), and the MMAS-8 was most reliable (ie, provided the most information about a patient’s level of adherence) when there was a moderate-to-high degree of nonadherence. Given the suboptimal rates of adherence observed in the literatureCitation9 and replicated in this study (eg, nearly 20% report sometimes forgetting to take their medication and approximately 30% feeling hassled by their regimen and having difficulty remembering to take it), this focused precision of the MMAS-8 is far from problematic in this population. Nevertheless, future studies should be cognizant of this when exploring insulin subgroups likely to be adherent. Although there may be many alternative forms of assessing adherence in a T2D sample, the MMAS-8 appears to provide a psychometrically valid way to assess adherence in this population.
Our results also suggest that greater nonadherence was associated with worse health outcomes. Of particular note, each point increase in nonadherence was associated with a 0.21 increase in HbA1c, which was generally comparable to what has been observed in past studies.Citation32 To our knowledge, the current study was the first of its kind to examine nonlinear relationships between adherence and HbA1c. Indeed, a slight quadratic trend was observed, which indicates this effect is weaker at high levels of adherence. When focusing on populations with a high level of adherence, the impact of adherence on HbA1c is less dramatic. In other words, there is only so much HbA1c benefit that can be achieved with adherence to basal insulin, as there is a ceiling effect based on the effectiveness of the medication itself.
We also found significant associations between nonadherence and health status. A 2- to 3-point increase in the MMAS-8 was associated with clinically relevant effects for several summary and domain scores, particularly mental health-related scores. However, this finding raises the question of the causality of this effect. There may be underlying mental health issues that cause nonadherence, rather than nonadherence causing poorer mental health (though both may occur). Although no effect was observed in terms of work productivity (and only a modest one in terms of activity impairment), sizable effects were observed with respect to health care-resource use. In particular, over 20% more hospitalizations and ER visits were reported for each additional 1-point increase in nonadherence. Although nonadherence was also associated with significantly more physician visits, this effect was far more modest. The implication of these results may be that poor adherence may lead to acute events that require immediate medical attention. However, additional research would be necessary to replicate these effects outside a cross-sectional design.
In sum, this study provides evidence that adherence rates are high among patients with T2D using basal insulin, and the MMAS-8 is a reliable and valid tool to assess adherence. Further, examining adherence with this tool has shown that HbA1c increases concomitantly with nonadherence, as do poorer health status and health care-resource use. Innovative interventions designed to improve adherence in this population may result in real-world clinical benefits and cost savings. For example, evaluations of interventions that include reminders (perhaps by involving caregivers), increase mindfulness of treatment behaviors or clarify treatment regimens appear to be lines of future inquiry with the potential to produce the most positive impact. These findings also have implications from a purely clinical perspective. Although the MMAS-8 was developed for the purposes of research, it may help those in clinical practice to determine potentially nonadherent patients (eg, patients who report being hassled or bothered with the regimen). This could offer clinicians the opportunity to intervene early, stressing the importance of proper medication use with their patients, and in certain situations could lead to altering the treatment regimen to one where the patient is more likely to adhere. Such clinical intervention may help to mitigate the deleterious effects of nonadherence. Additionally, future treatments that increase the convenience of the regimen may also result in a clinical benefit due to improved adherence.
Limitations
Several limitations of this research should be noted. All data from the NHWS were patient-reported, and objective confirmation of patient information was unavailable. Naturally, we should emphasize that this includes HbA1c, which was entirely self-reported. Past research has suggested a moderately sized correlation (r=0.43) between self-reported HbA1c and actual HbA1c, though far from a perfect one.Citation41 Assuming no systematic bias in these HbA1c-recall errors, this additional measurement error would serve to weaken our observed effect, making these findings conservative. Future research should rely on objective measures of HbA1c to replicate these relationships. Additionally, because the NHWS is cross-sectional, a causal relationship between nonadherence and HbA1c levels and other health outcomes can only be speculated from the available data. Indeed, it is possible that the relationship between nonadherence and HbA1c could be explained at least partially by variables that cause both nonadherence and glucose intolerance (ie, third variables). The NHWS sample overall is identical to that of the US adult population overall with respect to age, sex, and race/ethnicity. However, there may be other variables that differ between the NHWS and the adult population, which could influence the strength and direction of the associations observed here.
Disclosure
The data source for this study, the National Health and Wellness Survey (NHWS), was a survey conducted by Kantar Health. Novo Nordisk purchased access to the NHWS data and funded the analysis and preparation for this manuscript. MD and AG were employed by Kantar Health (the institution which received funding from Novo Nordisk) at the time of the study. NW and JH were employed by Novo Nordisk at the time of the study. The authors report no other conflicts of interest in this work.
References
- Centers for Disease Control and PreventionNational Diabetes Fact Sheet: National Estimates and General Information on Diabetes and Prediabetes in the United States 2011AtlantaUS Department of Health and Human Services Centers for Disease Control and Prevention2011
- American Diabetes AssociationStandards of medical care in diabetes – 2010Diabetes Care201033 Suppl 1S11S6120042772
- HoPMRumsfeldJSMasoudiFAEffect of medication nonadherence on hospitalization and mortality among patients with diabetes mellitusArch Intern Med2006166171836184117000939
- HarrisMIHealth care and health status and outcomes for patients with type 2 diabetesDiabetes Care200023675475810840991
- CramerJARoyABurrellAMedication compliance and persistence: terminology and definitionsValue Health2008111444718237359
- LeeWCBaluSCobdenDJoshiAVPashosCLPrevalence and economic consequences of medication adherence in diabetes: a systematic literature reviewManag Care Interface2006197314116898343
- StuartBDavidoffALopertRDoes medication adherence lower Medicare spending among beneficiaries with diabetes?Health Serv Res20114641180119921413981
- WildHThe economic rationale for adherence in the treatment of type 2 diabetes mellitusAm J Manag Care201218S43S4822558941
- CramerJAA systematic review of adherence with medications for diabetesDiabetes Care20042751218122415111553
- HartzAKentSJamesPXuYKellyMDalyJFactors that influence improvement for patients with poorly controlled type 2 diabetesDiabetes Res Clin Pract200674322723216723163
- YeawJBennerJSWaltJGSianSSmithDBComparing adherence and persistence across 6 chronic medication classesJ Manag Care Pharm200915972874019954264
- MateoJFGil-GuillenVFMateoEOrozcoDCarbayoJAMerinoJMultifactorial approach and adherence to prescribed oral medications in patients with type 2 diabetesInt J Clin Pract200660442242816620354
- TivMVielJFMaunyFMedication adherence in type 2 diabetes: the ENTRED study 2007, a French population-based studyPloS One201273e3241222403654
- OdegardPSGraySLBarriers to medication adherence in poorly controlled diabetes mellitusDiabetes Educ200834469269718669811
- Alvarez GuisasolaFTofé PovedanoSKrishnarajahGLyuRMavrosPYinDHypoglycaemic symptoms, treatment satisfaction, adherence and their associations with glycaemic goal in patients with type 2 diabetes mellitus: findings from the Real-Life Effectiveness and Care Patterns of Diabetes Management (RECAP-DM) studyDiabetes Obes Metab200810 Suppl 1253218435671
- KarterAJAckersonLMDarbinianJASelf-monitoring of blood glucose levels and glycemic control: the Northern California Kaiser Permanente Diabetes registryAm J Med200111111911448654
- Al-QazazHSulaimanSAHassaliMADiabetes knowledge, medication adherence and glycemic control among patients with type 2 diabetesInt J Clin Pharm20113361028103522083724
- LaneJDMcCaskillCCWilliamsPGParekhPIFeinglosMNSurwitRSPersonality correlates of glycemic control in type 2 diabetesDiabetes Care20002391321132510977026
- PeetersBVan TongelenIBousseryKMehuysERemonJPWillemsSFactors associated with medication adherence to oral hypoglycaemic agents in different ethnic groups suffering from type 2 diabetes: a systematic literature review and suggestions for further researchDiabet Med201128326227521309834
- BaileyGRBarnerJCWeemsJKAssessing barriers to medication adherence in underserved patients with diabetes in TexasDiabetes Educ201238227127922316643
- ShermanBWSekiliAPrakashSTRauschCAPhysician-specific variation in medication adherence among diabetes patientsAm J Manag Care2011171172973622084892
- OsbornCYCavanaughKWallstonKAHealth literacy explains racial disparities in diabetes medication adherenceJ Health Commun201116 Suppl 326827821951257
- MorelloCMChynowethMKimHSinghRFHirschJDStrategies to improve medication adherence reported by diabetes patients and caregivers: results of a Taking Control of Your Diabetes survey (February)Ann Pharmacother Epub282011
- MannDMPoniemanDLeventhalHHalmEAPredictors of adherence to diabetes medications: the role of disease and medication beliefsJ Behav Med200932327828419184390
- NauDPAikensJEPacholskiAMEffects of gender and depression on oral medication adherence in persons with type 2 diabetes mellitusGend Med20074320521318022588
- LindenmeyerAHearnshawHVermeireEVan RoyenPWensJBiotYInterventions to improve adherence to medication in people with type 2 diabetes mellitus: a review of the literature on the role of pharmacistsJ Clin Pharm Ther200631540941916958818
- GerberBSCanoAICaceresMLA pharmacist and health promoter team to improve medication adherence among Latinos with diabetesAnn Pharmacother2010441707920028957
- MisonoASCutronaSLChoudhryNKHealthcare information technology interventions to improve cardiovascular and diabetes medication adherenceAm J Manag Care20101612 Suppl HITSP82SP9221314228
- VervloetMvan DijkLSanten-ReestmanJvan VlijmenBBouvyMLde BakkerDHImproving medication adherence in diabetes type 2 patients through real time medication monitoring: a randomised controlled trial to evaluate the effect of monitoring patients’ medication use combined with short message service (SMS) remindersBMC Health Serv Res201111521219596
- VermeireEWensJVan RoyenPBiotYHearnshawHLindenmeyerAInterventions for improving adherence to treatment recommendations in people with type 2 diabetes mellitusCochrane Database Syst Rev20052CD00363815846672
- MoriskyDEGreenLWLevineDMConcurrent and predictive validity of a self-reported measure of medication adherence and long-term predictive validity of blood pressure controlMed Care19862467743945130
- KrapekKKingKWarrenSSMedication adherence and associated hemoglobin A1c in type 2 diabetesAnn Pharmacother20043891357136215238621
- MoriskyDEAngAKrousel-WoodMWardHPredictive validity of a medication adherence measure for hypertension controlJ Clin Hypertens (Greenwich)200810534835418453793
- US Census BureauStatistical Abstract of the United States: 2012WashingtonUS Census Bureau2011 Available from: http://www.census.gov/compendia/statabAccessed January 5, 2014
- BolgeSCDoanJFKannanHBaranRWAssociation of insomnia with quality of life, work productivity, and activity impairmentQual Life Res200918441542219288223
- DiBonaventuraMDWagnerJSYuanYL’ItalienGLangleyPRay KimWHumanistic and economic impacts of hepatitis C infection in the United StatesJ Med Econ201013470971821091098
- FinkelsteinEAAllaireBTDiBonaventuraMDBurgessSMDirect and indirect costs and potential cost savings of laparoscopic adjustable gastric banding among obese patients with diabetesJ Occup Environ Med20115391025102921866052
- WareJEKosinskiMDeweyJEHow to Score Version Two of the SF-36 Health SurveyLincoln (RI)QualityMetric2000
- ReillyMCZbrozekASDukesEMThe validity and reproducibility of a work productivity and activity impairment instrumentPharmacoeconomics19934535336510146874
- CharlsonMEPompeiPAlesKLMacKenzieCRA new method of classifying prognostic comorbidity in longitudinal studies: development and validationJ Chronic Dis19874053733833558716
- HarwellTSDettoriNMcDowallJMDo persons with diabetes know their (A1c) number?Diabetes Educ20022819910511852748