
 ?Mathematical formulae have been encoded as MathML and are displayed in this HTML version using MathJax in order to improve their display. Uncheck the box to turn MathJax off. This feature requires Javascript. Click on a formula to zoom.
Abstract
Current self-report medication adherence measures often provide heavily skewed results with limited variance, suggesting that most participants are highly adherent. This contrasts with findings from objective adherence measures. We argue that one of the main limitations of these self-report measures is the limited range covered by the behaviors assessed. That is, the items do not match the adherence behaviors that people perform, resulting in a ceiling effect. In this paper, we present a new self-reported medication adherence scale based on the Rasch model approach (the ProMAS), which covers a wide range of adherence behaviors. The ProMAS was tested with 370 elderly receiving medication for chronic conditions. The results indicated that the ProMAS provided adherence scores with sufficient fit to the Rasch model. Furthermore, the ProMAS covered a wider range of adherence behaviors compared to the widely used Medication Adherence Report Scale (MARS) instrument, resulting in more variance and less skewness in adherence scores. We conclude that the ProMAS is more capable of discriminating between people with different adherence rates than the MARS.
Introduction
The number of people taking medication for chronic conditions is growing rapidly.Citation1–Citation3 Medication therapies provide the most health benefits when patients take their medication as prescribed by their physician (ie, are adherent to their therapy).Citation1 However, research shows that about 50% of patients with a chronic condition are not adherent, with estimates ranging from 17%–80% adherence.Citation4–Citation7 In particular, medications for asymptomatic chronic conditions are found to have low adherence rates.Citation8 Poor adherence rates can result in higher mortality rates (mortality rates have been reported to be twice as high in the literature for people with poor adherence rates compared to those with good adherence rates)Citation9 and high health care costs (US$269 billion estimated costs per year globally).Citation2,Citation10 Because of these health and economic consequences of nonadherence, improving adherence is an important focus area for many health care organizations, policy makers, and research organizations. However, many challenges remain, such as the measurement of adherence.
Measuring medication adherence
The reliable, accurate, and cost-effective assessment of individual medication adherence rates has proven to be difficult, and to date, there is no gold standard to measure adherence.Citation1,Citation6,Citation10 Accurate and cost-effective measurements are essential to understand the nonadherence problem to its full extent and measure the effects of adherence interventions. Current measures do not seem to be able to fulfill this need; therefore, new measures are needed.Citation10,Citation11
Two broad categories of current adherence measures can be distinguished: objective and subjective measurements. The most frequently used objective measurements are pharmacy refill data and electronic pillbox monitoring.Citation10,Citation12,Citation13 Pharmacy refill data indicate when prescriptions were filled. Electronic pillbox monitoring indicates when the pillbox was opened. These measures have several limitations: a limited set of adherence behaviors is measured (eg, filling prescriptions and opening of the pill bottle), and the resulting data do not show whether the patient has actually taken the medication and what dose was taken.Citation14 Furthermore, pharmacy refill data do not provide detailed information, because most pick-up moments occur infrequently (approximately once every 3 months), and adherence information is lacking from in between these pick-up moments.Citation15 Electronic pillbox monitoring provides more detailed data, but is expensive, and therefore, its use is often limited to smaller sample sizes.
Self-report measures deal with several limitations of the objective measurements: larger sample sizes can be tested easily and a wider range of adherence behaviors can be assessed. Various adherence self-report scales have been proposed in the literature.Citation11 However, these self-report scales suffer from several limitations, resulting in adherence rates that often deviate substantially from the objective measuresCitation11 and highly overestimated adherence.Citation10,Citation16,Citation17
Limitations of self-report measures
One of the main limitations of the existing self-report measures is the limited range of nonadherence behaviors covered by the items and unawareness of the frequency with which these behaviors are performed. There is a wide range of adherence behaviors (eg, stopping medication for a while, changing the dose, or taking the medication too late)Citation18,Citation19 and these behaviors differ in the frequency with which they are performed and the numbers of people that perform them.Citation20 For example, it is probable that a behavior such as taking medication 1 hour later is performed by more patients than stopping taking medication for 1 week. Most self-report measures only assess a limited set of these behaviors and this limited set includes mostly behaviors that are performed by only a minority of the participants. Therefore, an assessment of additional behaviors is necessary to improve the ability of these scales to measure adherence.
The frequency of performing adherence behaviors can be compared to the difficulty of questions in a math test. The questions in any math test need to be matched to the math abilities of the students, because if the majority of the students answer all the questions correctly (or incorrectly), the test is too easy (or too difficult) and it becomes impossible to discriminate between the students’ math abilities. The range of difficulty of questions should be extended to cover the range of math abilities of the students, such that it is possible to discriminate between the different students based on their correct and incorrect answers. The same principle holds for measuring adherence behaviors. If a scale consists only of adherence behaviors that the vast majority of participants report, the scale is too ‘easy’ and behaviors should be added that are performed by only a proportion of the participants. Many current adherence measures include mainly nonadherence behaviors performed by none or a small minority of the participants. As a result, most patients appear to be perfectly adherent and we cannot differentiate between the participants’ adherence levels. We argue that items should cover the wide range of adherence behaviors that are performed by the target population of the measure.
The Rasch model
The Rasch model is particularly well-suited to develop a scale that matches the various adherence behaviors of the participants.Citation21,Citation22 The Rasch model is often used to measure ability in educational settings, where it is obvious that a test would include items with a range of item difficulties (eg, a math test usually includes items that range from easy to difficult). For measuring psychological constructs and behavior, scientists generally use factor analysis, even though Rasch measurement might give a more accurate description of the data when item difficulties vary.Citation22–Citation24 We believe that this is the case for medication adherence, and therefore the use of the Rasch model in this paper represents an appropriate and novel method for developing adherence measures.
The Rasch model, with sufficient fit to the data, has several advantages over multiple-parameter models, for example item-free measurement and the use of sum scores as a sufficient statistic. Item-free measurement means that the person measure is independent of the measurement tool used (eg, it should not matter which ruler we use to measure a person’s height; similarly, it should not matter which [sub] set of questionnaire items we use). Item-free measurement makes a comparison of person ability estimates possible when these persons completed different item sets, provided that these item sets have a sufficient number of items in common or the items are calibrated. The use of sum scores, when all participants receive the same items, makes it easier to use the scale, as it does not necessarily require the calculation of Rasch estimates. The Rasch model describes the relationship between the adherence behaviors reported by participants and their overall adherence mathematically (see EquationEquation 1(1) and Bond and FoxCitation21 for more information):
(1)
As represented in EquationEquation 1(1) , the natural logarithm of the odds of agreeing to an item i by patient n (p[xni 1]) is described as a function of this patient’s adherence score (theta; θn) and the item’s difficulty score (delta; δi). In a medication adherence questionnaire, item difficulty scores would correspond to the number of patients reporting to be nonadherent on an item. Both the adherence scores and difficulty scores are measured in logits (log odd units) and estimated based on the data.Citation21 For every item and person, the Rasch model provides fit scores to test whether the items and persons behave in a fashion consistent with the Rasch model’s expectations. If all the items have sufficient fit, there is one dimension underlying the different items. An item with misfit shows a deviation from the model’s expectations and needs further inspection. If all person fit scores are within limits, it means that all persons have responded to the items consistently and as expected by the model.
Persons with a high adherence score are expected by the Rasch model to be nonadherent on the behaviors on which most of the persons are nonadherent, while persons with a low adherence score are also expected to be nonadherent on the behaviors on which fewer people are nonadherent. For example, a person with high adherence score would only take his medication a little later than usual, while a low adherent person could also stop taking medication for 1 week. This means that the items are transitively ordered by their difficulty scores (eg, if A>B and B>C, then A>C). We expected that using the Rasch model to create a scale with a wider range of behavioral adherence difficulties would result in a scale that differentiates between participants better than existing self-report measures.
The ProMAS
In this paper we describe the development of the Probabilistic Medication Adherence Scale (the ProMAS). The ProMAS assesses a range of adherence behaviors with varying difficulty levels, using the Rasch model approach. We expect that the use of these behaviors enables the derivation of one latent variable behind these behaviors; a disposition to be adherent. Thirty-seven behaviors were selected based on patient interviews, an extensive literature review, existing adherence measures,Citation16,Citation20,Citation25 and a pre-test. Items of the final scale were phrased such that they described behaviors only, and did not include cognitions or determinants of nonadherence. The scale was shortened by selecting the items with varying item difficulties, such that the item set matched the behaviors reported by the participants. The item set matches the behaviors reported when there is a range in item difficulty scores, such that the full range of person abilities is covered. The selected items were tested on item and person fit and dimensionality and compared to one of the most often used existing measures (the Medication Adherence Report Scale [MARS] developed by Horne and Weinman).Citation20,Citation26 The goal of this research was to develop a scale that included a range of adherence behaviors matched to the target population, to find a better way to quantify adherence behavior and to test whether one latent variable (an adherence disposition) can be inferred from the range of adherence behaviors. The behaviors assessed should provide data with sufficient reliability scores and correlations to the MARS. We expected that one underlying latent variable (adherence disposition) could be construed from the different nonadherence behaviors of the ProMAS, by showing sufficient fit with the Rasch model. Furthermore, we expected that the resulting adherence scores would correlate with the MARS and that the ProMAS would provide less skewed data with more variance compared to the data obtained with the MARS, which is more in line with adherence data assessed with objective methods.Citation1
Method
Participants
The study was completed by 370 participants, aged 65 years and over (mean age: 68.0 years, standard deviation [SD]: 7.1; 141 females, 213 males, 16 unknown), whose education ranged from primary education to university. Elderly participants were chosen because many elderly suffer from at least one chronic condition.Citation3 The sample included 182 participants with cardiovascular diseases, 92 with diabetes, 32 with osteoporosis, and 71 with chronic obstructive pulmonary disease. Many participants (234) took medication for a condition not listed, for example for their cholesterol, rheumatoid arthritis, or depression. About half of the participants suffered from comorbidities (181 participants). On average, participants had taken medication for 13 years. The participants were recruited by a recruitment agency (PanelClix).Citation27 The agency has gathered a panel of participants that have opted-in to participate in research in exchange for points. The agency randomly selected Dutch participants from its database aged 65 years and over. These participants were invited to participate in the study via an email including a web-link to the study. Participants were also able to access the link via the PanelClix website. Participants were asked whether they had a chronic condition, whether they took pills, and how often they took those pills. Only participants who took pills daily for a chronic condition could proceed to the survey and were included in the study. The survey was closed when enough participants were included in the study. The study was conducted online and participants filled in the survey from their homes on their own computer. After finishing the study, participants received a reward of €1.50 in the form of points provided to the participants by PanelClix.
Procedure and materials
The study consisted of a single online session, which took about 10 minutes to complete. Participants received a short introduction to the study, after which they were asked to fill out the ProMAS. Next, the MARSCitation20 was administered, followed by demographic questions. Finally, participants were thanked and debriefed. The study was in the Dutch language.
ProMAS
We composed an extensive list of 37 types of adherence behaviors based on patient interviews, a broad literature review, existing adherence measures (such as the MARS and Morisky Medication Adherence Scales),Citation16,Citation20,Citation25 and a pre-test. In the pre-test, 51 items were tested using Rasch analysis with 528 participants (different participants from the present study). Several items included in the pre-test were rephrased, removed, or added before inclusion in the current study. The behaviors were adapted to conform to the scale’s item format. All items in the final scale consisted of an unconditional statement describing an adherence behavior (and not its determinants). This means that items such as ‘I skip my medication when I feel good’ were not included because it contains a conditional element (when I feel good) and a determinant (only take medication when I do not feel good). For each item (see for the final item set and for the items that were removed), participants could indicate whether it corresponded with their own behavior by selecting ‘yes, true’ (coded with 1) or ‘no, not true’ (coded with 0).
Table 1 The final item set of the ProMAS, including item difficulty scores, fit statistics, and loadings on the first contrast
The 37 items on the ProMAS were analyzed using the Rasch methodology (see the introduction and Bond and FoxCitation21 for more information). For every item, a difficulty score (delta) was estimated, based on the frequency of reported adherence behaviors by the participants, and for every person, an adherence score (theta) was estimated, based on the sum of adherence behaviors reported. Difficulty scores (per item) and adherence scores (per person) are expressed in logits.Citation21 Higher individual adherence scores in this analysis represent better adherence rates. WINSTEPS software was used for all Rasch analyses.Citation28
MARS
The MARS is one of the most frequently used medication adherence self-report scalesCitation20 and was included for comparison with the ProMAS. The MARS consists of seven questions inquiring about different adherence behaviors and reasons, such as ‘I alter the dose of my medicines’ (see for the MARS items included in this study). Participants were asked to indicate their own behavior on a 5-point scale (1: never to 5: very often). Consistent with the original procedure, answers to the seven questions were averaged to provide an adherence score with a reasonable level of internal consistency, with higher scores representing better adherence (α=0.704).
Results
The analysis of the study consisted of two steps. In the first step, we shortened the scale by selecting the items that best matched the behaviors of the participants (and thereby covered the full range of person abilities). The goal of this step was to reduce the number of items, in order to decrease the burden on our (mostly elderly) participants. In the second step, we calculated fit statistics and compared the shortened scale to the MARS. The Rasch analysis was performed in WINSTEPS.Citation28 Comparisons between the MARS and ProMAS were analyzed in SPSS (IBM Corporation, IBM SPSS Statistics for Windows v20.0).
Step 1: selecting the items that best matched the participants’ behavior
The Rasch methodology was used to analyze the 37 items and to calculate the item difficulties and person adherence scores. The difference between the mean item difficulty and mean adherence score was 1.96 logits (SD: 1.51). Adherence scores were estimated with a person separation reliability of 0.80 and a Cronbach’s alpha of 0.89. The scale included a high number of relatively easy items for this sample. Many of these easy items had similar item difficulty scores and asked for similar information, and were therefore redundant. To shorten the ProMAS, we discarded these redundant items. Items to be discarded were selected based on item difficulty scores and fit statistics. Fit statistics in Rasch analysis are expressed in mean squares. Mean squares express how well the data fits the model by comparing the predicted model to the observed response patterns.Citation21 The expected value of the mean squares is 1, which indicates a perfect fit between the observed data and the Rasch model. Mean squares higher than 1 indicate misfit, while those lower than 1 indicate an overfit. Rasch fit statistics generally consist of infit and outfit statistics. While outfit statistics are based on the conventional mean squares, infit statistics place more weight on the persons with abilities close to that item’s difficulty and are therefore less susceptible to unexpected results from persons for which this item is relatively difficult or easy.Citation21 For this type of study, mean squares values between 0.6 and 1.4 are considered reasonable.Citation29 A mean squares value lower than 0.6 indicates that the response to an item is too deterministic (ie, a Guttman-like response pattern; 00001111), while a value higher than 1.4 indicates a deviation from the model’s expectations. Mean squares of more than 2 would degrade the measurement model. Next to the mean squares, infit and outfit statistics are provided in their standardized form, as z-scores.
Infit mean squares in this study ranged from 0.68 to 1.30 and outfit mean squares ranged from 0.40 to 1.95. Three items had a misfit with the model (ie, ‘I do not take medication when I feel they do not work’). These items were screened on their content and were not found to accurately measure adherence and were therefore removed from the scale.
The remaining items still included items that were too easy for this sample (ie, had low item difficulties). These items were ordered into groups with similar difficulty scores. For every group, items were screened on their content by the authors (to check similarity to other items) and fit. When items were similar in difficulty and content, the item with the best fit was retained (ie, mean squares closest to 1). This selection resulted in a final item set of 18 items (see for the final item set and for items that were not included). A second Rasch analysis was performed on the final item set. The difference between the mean item difficulty and mean adherence score was 1.42 logits (SD: 1.57).
Step 2: tests on the final item set
Fit statistics
Adherence scores could be estimated by the model with a separation reliability of 0.72 and a Cronbach’s alpha of 0.81. Fit statistics were calculated for both items and persons. For every person, the mean squared residuals of the response string were calculated.Citation29 For only 13 out of 370 participants (3.5% of the total sample) the model prediction did not fit the data (based on z-values ≥1.96). Furthermore, fit scores for the 18 items all fell within an acceptable range. Infit mean squares for the 18 items ranged from 0.76 to 1.21 and outfit mean squares from 0.51 to 1.29 (). Therefore, all infit and outfit mean squares values seemed to be within reasonable limits. z-scores indicated that only one item had a significant overfit (outfit) with the model (ie, the response pattern was too deterministic). This overfit was too small to degrade the measurement system. However, overfit could indicate that this item had a higher discriminative ability than the other items, while the Rasch model assumes that all discrimination abilities are equal. Further analysis revealed that this item had a discrimination index of 1.24, which is still within the limits of the Rasch model (ie, between 0.5 and 2).Citation30 Therefore, we concluded that all items fitted the model sufficiently.
We tested for item invariance by performing the Ben Wright’s challenge.Citation21 The sample was divided into a low and high adherent subsample by a median split. Item difficulty estimates for both subsamples were highly similar and all fell within 95% confidence intervals (r=0.946). These findings indicated that the item difficulty estimates were consistent and independent of the individuals taking part in the study.
To test whether item difficulty scores were also independent of the disease type, we calculated item difficulty scores for the participants that took medication for diabetes and not for cardiovascular diseases (N=48) and for participants that took medication for cardiovascular diseases but not for diabetes (N=138). Item difficulty scores were highly similar (r=0.865). Only one item did not fall within the 95% confidence intervals (item 15: ‘It has happened at least once that I did not take (one of) my medicines for a day’). This item had a lower item difficulty score for diabetes patients than for cardiovascular patients.
Dimensionality tests
All items sufficiently fitted the Rasch model, and therefore, it could be concluded that they all tapped into one dimension (medication adherence disposition). However, additional variance could be explained by a second dimension, after extraction of the Rasch dimension. Empirically, the Rasch model explained 35.6% of the variance in the data. If the data fit the Rasch model perfectly, the explained variance would be 35.9% (see LinacreCitation31 and LinacreCitation32 for calculations and information on explained variance). The remaining 64.1% is so-called quantification variance: residual variance because probabilities are estimated for discrete (0 or 1) events. We explored whether the residual variance (ie, variance not explained by the Rasch model) may constitute more than quantification variance, by performing a principal components analysis (PCA) on the standardized residuals (a common procedure in Rasch analysis).Citation33 The PCA revealed that the first contrast (ie, the second dimension) would explain an additional 8.5% of the variance with an eigenvalue of 2.4. A default critical eigenvalue for these studies does not exist, because the eigenvalue of noise is dependent on the number of items and persons. Therefore, it is necessary to estimate the critical eigenvalue for every dataset based on a set of simulated datasets. Following a procedure recommended by Raîche,Citation33 we calculated the eigenvalues of the first contrast in 100 simulated similar datasets. The mean of these eigenvalues was 1.45. This means that an eigenvalue of around 1.45 could be expected when the residual consisted of quantification variance only, indicating that the first contrast found in our data exceeded the noise level. Items scoring high on this contrast were related to skipping doses, whereas items scoring low were related to changing doses (see for the factor loadings on this contrast). Because all items fitted the Rasch measure sufficiently, this second dimension was not necessarily a problem; however, this contrast should be further investigated in future studies.
Comparison with the MARS
We compared the adherence estimates obtained with ProMAS to those obtained with the MARS. ProMAS scores ranged from −3.58 to 4.78 (sum scores from 1 to 18), with a mean of 1.4 (12.6 for the sum scores) and SD of 1.6 (3.7). Twenty-five participants (7%) had a maximum adherence score on the ProMAS. The MARS scores ranged from 1.14 to 4 with a mean of 3.6 (SD: 0.5) and 82 (22%) had a maximum adherence score (see for a categorical breakdown of adherence scores). As expected, the ProMAS adherence estimates correlated with the MARS scores (r=0.609), indicating that the ProMAS measured a similar construct as the MARS. As can be seen in , the scores correlated best for the low adherence patients. For the high adherence patients, little variance was found in the MARS scores, while the ProMAS provided more variance for these same persons. To test whether the ProMAS items would provide items with a wider range of item difficulty scores better matched to the behaviors of the participants than the MARS items, we performed a Rasch analysis including both the MARS and ProMAS items. The MARS scores were dichotomized by scoring ‘never’ as 1, and ‘seldom’, ‘sometimes’, ‘often’ and ‘always’ as 0. As expected, the item–person map () shows that item difficulty scores of the ProMAS items covered a wider range than the MARS items. Furthermore, at the high adherence side of the scale (above the 25 percentile range of persons, where most of the participants reside) seven out of the eight items belonged to the ProMAS. These items will be most capable of discriminating between the high adherence participants.
Figure 1 Scatterplot of the ProMAS and MARS scores.
Abbreviations: MARS, Medication Adherence Report Scale; ProMAS, Probabilistic Medication Adherence Scale.
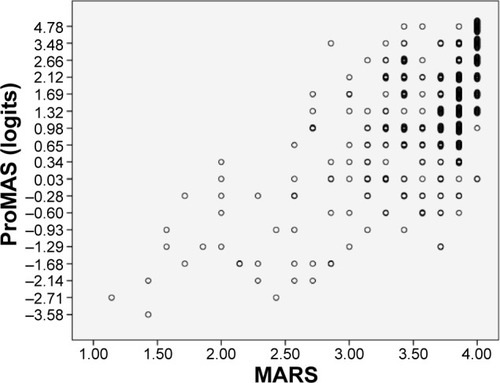
Figure 2 Item–person map for a Rasch analysis including both ProMAS (gray) and MARS (black) items.
Abbreviations: MARS, Medication Adherence Report Scale; ProMAS, Probabilistic Medication Adherence Scale.
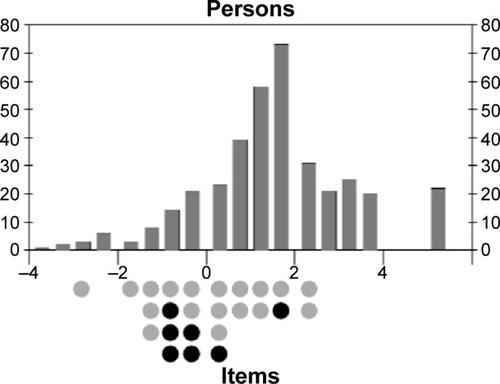
Table 2 Categorical breakdown of adherence scores of the MARS and the ProMAS
We tested whether the widened range in item difficulty scores in the ProMAS would result in more variance in adherence scores and less skewed results compared to the existing self-report measures. This was tested by comparing the skewness and kurtosis scores from the ProMAS to those of the MARS. The results indicated that the ProMAS Rasch estimates were not significantly skewed and did not have a significant kurtosis (z<1.96; see ), while the MARS scores were skewed (z=−20.10) and showed a significant kurtosis (z=28.87). The ProMAS simple sum scores were significantly skewed (z=−5.57), but less so than the MARS. In other words, the ProMAS provided less skewed data with more variance in adherence scores compared to the MARS. The differences in skewness and kurtosis can be seen in , where the distributions of the MARS and ProMAS are plotted. Additionally, we compared the distributions to a normal distribution by performing a Shapiro–Wilk test on the different adherence scores. All distributions deviated from normality. However, with a large sample size we can expect that even a small deviation from normality will become significant. The Shapiro–Wilk statistics indicated that the distribution of ProMAS estimates were closer to a normal distribution (ie, Shapiro–Wilk is closer to 1) compared to the MARS scores. See for all normality test results.
Figure 3 Distributions of ProMAS Rasch estimates (logits), ProMAS sum scores, and MARS scores (N=370).
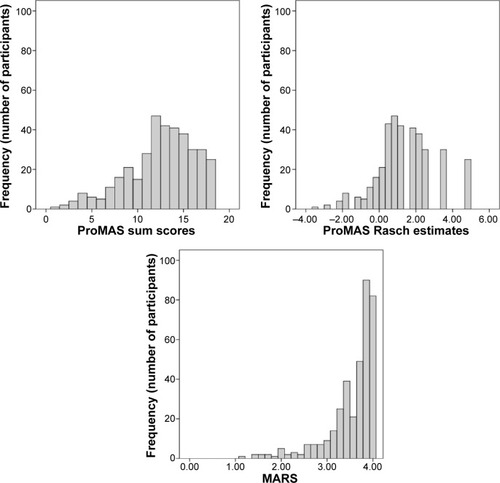
Table 3 Normality tests for the different adherence measures
Discussion
The goal of the current research was to find a better way to quantify medication adherence behavior and develop a reliable scale to measure medication adherence behaviors (the ProMAS) that deals with the main limitations of existing self-report adherence scales. These limitations concern the limited range of item difficulties in the adherence behaviors measured and the resulting ceiling effect. The ProMAS was constructed using behaviors from previous instruments, literature, patient interviews, and a pre-test. We tested the item set on fit to the Rasch model and comparisons to the MARS adherence scale. The results indicated that the ProMAS provided a reliable scale, which correlated with the MARS. Tests for normality showed that the new scale had more variance and a less skewed distribution than the MARS. Furthermore, our results have shown that the ProMAS items cover a wider range of behavior difficulties than the MARS items. From these results, we concluded that the ProMAS, based on the Rasch modeling approach, can more reliably distinguish between differences in medication adherence behavior than existing self-report measures.
The ProMAS has been internally validated with a Dutch sample of elderly patients taking medication daily for various chronic conditions, and possibly suffers from self-selection bias, and thus needs further validation in other samples. Item-free measurement in the Rasch model allows for the addition, rephrasing, or removal of items, as to further shorten the scale or to match the scale to a specific sample, for example, to target patients with a specific condition or to measure adherence towards a weekly regimen. When such changes are made, or when the questionnaire is used in a different language or for a specific disease, we advise that a Rasch analysis is performed and fit statistics are calculated for that sample.
Its wider range in item difficulties, lower skewness, and higher variance suggest that the ProMAS is more sensitive to differences in adherence between participants compared to the existing scales. Where most self-report measures suggest that most patients are perfectly adherent, our scale suggests a different pattern: many patients are nonadherent, but they differ in the extent to which they are adherent. This pattern seems to be closer to expectations of medication adherence as measured by objective methods.Citation1
Another improvement in comparison to current self-report measures is that the ProMAS includes only items that assess behavior. This results in a purer estimate of adherence behavior that is not confounded by the determinants of this behavior. However, for two items in the scale (about forgetting to take medication), it can be argued that they are not purely of a behavioral nature. We argue that, because it is socially very acceptable that patients forget their medication, it is easy to admit to. This means that in some cases, forgetting might not be the real reason for being nonadherent, but a way to admit to being nonadherent. Our analysis supports this claim, because the forget-items fit the Rasch model.
The distinction between intentional and unintentional nonadherence, as often reported in previous studies,Citation34 is not tested in this study. We argue that these types of nonadherence are differences in the determinants of the behavior, not the behavior itself. These determinants have been incorporated in some of the items in existing scales. For example, several existing scales contain items that include the deliberation process that determines the behavior to measure intentional nonadherence (eg, ‘Did you deliberately skip a dose?’). Even though we focused exclusively on the adherence behaviors by excluding any reference to the potential determinants of these behaviors from the items, our results suggest that intentional and unintentional nonadherence might result in a different pattern of adherence behaviors. This could explain the first contrast in our dimensionality analysis. For example, the unintentionally nonadherent might more often skip a dose, while the intentional nonadherent might change the dose more often. Whether the first contrast is dependent on different determinants should be further investigated in future research.
The ProMAS items can be transitively ordered (if A occurs more frequently than B and B more than C, then A will occur more frequently than C). For a scale with this ordering, it is more probable that a patient will perform a behavior that occurs more frequently than a behavior that occurs less frequently. When a patient does perform a less frequently occurring behavior, it becomes more probable that they will also perform the behaviors that occur more frequently than that behavior. In this way, patients’ adherence scores will give information about which behaviors they are more or less likely to perform. Furthermore, the order of the items by itself provides insights on the probability of occurrence of different behaviors described by the items. This order could be different for different conditions, medications, or target groups. Analyzing the ordering of the items could provide more insight into adherence. As a result, it is necessary to validate the scale under different conditions, to test whether the scale can be used for all types of conditions and medications.
One item did not fall within the 95% confidence intervals in the item invariance test between diabetes and cardiovascular diseases. This item had a lower item difficulty score for diabetes patients than for cardiovascular patients. This could indicate a problem with this item, meaning that patients with different diseases would answer this item differently. However, the diabetes subsample was fairly small (ie, consisting of 48 participants). The item needs further inspection in future research, where larger subsamples with different diseases should be tested.
While the ProMAS is quite capable of detecting and discriminating between adherence levels of patients, it entails self-reporting behavior, which suffers from several limitations related to self-report measures in general. It may, for example, be the case that people are unaware of their own behavior or that social desirability issues prevent them from being fully truthful about their adherence behaviors. For these reasons, self-reported adherence is expected to overestimate adherenceCitation10,Citation20 and the currently developed ProMAS is likely to suffer from this fundamental issue. Therefore, adherence scores might be confounded by the willingness or ability of the participants to report their behavior accurately.
Another limitation of the ProMAS is that, even though the scale includes items with a wider range of item difficulty scores than previous scales, the scale could still be improved by including more items with a high difficulty score (). In other words, the scale could be improved by the addition of items that measure adherence behaviors that only a small portion of participants will perform. Adding these items would allow for easier discrimination between the participants and more precise scoring of highly adherent participants.
Based on the results of the current research, we have reason to believe that the ProMAS can improve the assessment of medication adherence behavior compared to existing self-report measures. Because the scale, in contrast to existing self-report measures, only includes items that assess behavior, it is not confounded by beliefs, attitudes, and intentions. We argue that while these determinants are important in view of medication adherence, they should be assessed separately to prevent adherence behavior and the underlying determinants being mixed into one score. Assessing behavior separately makes the ProMAS better suited to explore the determinants of nonadherence and their impact on adherence behavior. However, future research should study whether the increased variance provided by the ProMAS better accords with actual adherence behavior, for example by correlating the outcome with objectively measured adherence.
Acknowledgments
We would like to thank Dr Antal Haans from Eindhoven University of Technology for reviewing an earlier version of this paper.
Supplementary materials
Table S1 Items not included in final item set
Table S2 MARS items included for comparison with the ProMAS
Disclosure
The authors report no conflicts of interest in this work.
References
- World Health OrganizationAdherence to Long-Term Therapies: Evidence for ActionGeneva, SwitzerlandWorld Health Organization2003 Available from: http://www.who.int/chp/knowledge/publications/adherence_report/en/Accessed December 31, 2014
- IMS Institute for Healthcare InformaticsAdvancing the Responsible Use of Medicines: Applying Levers for ChangeParsippany, NJIMS Institute for Healthcare Informatics2012 Available from: http://www.imshealth.com/ims/Global/Content/Insights/IMS%20Institute%20for%20Healthcare%20Informatics/Responsible%20Use%20of%20Medicines/IHII_Advancing_Responsible_Use_of_Meds_Report.pdfAccessed December 31, 2014
- HungWWRossJSBoockvarKSSiuALRecent trends in chronic disease, impairment and disability among older adults in the United StatesBMC Geriatr2011114721851629
- DolceJJCrispCManzellaBRichardsJMHardinJMBaileyWCMedication adherence patterns in chronic obstructive pulmonary diseaseChest19919948378412009784
- HaynesRBAcklooESahotaNMcDonaldHPYaoXInterventions for enhancing medication adherenceCochrane Database Syst Rev20082CD00001118425859
- KruegerKPBergerBAFelkeyBMedication adherence and persistence: a comprehensive reviewAdv Ther200522431335616418141
- SarafinoEPSmithTWHealth Psychology: Biopsychosocial InteractionsHoboken, NJJohn Wiley & Sons2010
- BlaschkeTFOsterbergLVrijensBUrquhartJAdherence to medications: insights arising from studies on the unreliable link between prescribed and actual drug dosing historiesAnnu Rev Pharmacol Toxicol20125227530121942628
- SimpsonSHEurichDTMajumdarSRA meta-analysis of the association between adherence to drug therapy and mortalityBMJ200633375571516790458
- VermeireEHearnshawHVan RoyenPDenekensJPatient adherence to treatment: three decades of research. A comprehensive reviewJ Clin Pharm Ther200126533134211679023
- NguyenTMLa CazeACottrellNWhat are validated self-report adherence scales really measuring?: a systematic reviewBr J Clin Pharmacol201477342744523803249
- GelladWFGrenardJLMarcumZAA systematic review of barriers to medication adherence in the elderly: looking beyond cost and regimen complexityAm J Geriatr Pharmacother201191112321459305
- MannDMPoniemanDLeventhalHHalmEAPredictors of adherence to diabetes medications: the role of disease and medication beliefsJ Behav Med20093232788419184390
- Van DijkLHeerdinkERSomaiDPatient risk profiles and practice variation in nonadherence to antidepressants, antihypertensives and oral hypoglycemicsBMC Health Serv Res200775117425792
- KronishIMYeSAdherence to cardiovascular medications: lessons learned and future directionsProg Cardiovasc Dis201355659060023621969
- ReachGMichaultABihanHPaulinoCCohenRLe ClésiauHPatients’ impatience is an independent determinant of poor diabetes controlDiabetes Metab201137649750421550831
- RüschNToddARBodenhausenGVWeidenPJCorriganPWImplicit versus explicit attitudes toward psychiatric medication: implications for insight and treatment adherenceSchizophr Res20091121–311912219410431
- MurrayMDMorrowDGWeinerMA conceptual framework to study medication adherence in older adultsAm J Geriatr Pharmacother200421364315555477
- van DulmenSSluijsEvan DijkLde RidderDHeerdinkRBensingJPatient adherence to medical treatment: a review of reviewsBMC Health Serv Res200775517439645
- HorneRWeinmanJSelf-regulation and self-management in asthma: exploring the role of illness perceptions and treatment beliefs in explaining non-adherence to preventer medicationPsychol Health20021711732
- BondTGFoxCMApplying the Rasch Model2nd edLondon, UKRoutledge2007
- KaiserFGOerkeBBognerFXBehavior-based environmental attitude: development of an instrument for adolescentsJ Environ Psychol2007273242251
- HaansAKaiserFGBouwhuisDGIjsselsteijnWAIndividual differences in the rubber-hand illusion: predicting self-reports of people’s personal experiencesActa Psychol (Amst)2012141216917722964058
- ByrkaKKaiserFGHealth performance of individuals within the Campbell paradigmInt J Psychol201248598699922857604
- MoriskyDEGreenLWLevineDMConcurrent and predictive validity of a self-reported measure of medication adherenceMed Care198624167743945130
- HorneRChapmanSCParhamRFreemantleNForbesACooperVUnderstanding patients’ adherence-related beliefs about medicines prescribed for long-term conditions: a meta-analytic review of the Necessity-Concerns FrameworkPLoS One2013812e8063324312488
- PanelClix2014 Available from: http://www.panelclix.co.uk/Accessed December 31, 2014
- LinacreJMWINSTEPS® (v3)2007 Available from: www.winsteps.comAccessed November 30, 2012
- WrightBDLinacreJMReasonable mean-square fit valuesRasch Meas Trans199482370
- LinacreJDiscrimination, guessing and carelessness: estimating IRT parameters with RaschRasch Meas Trans2004181959960
- LinacreJMData variance explained by Rasch measuresRasch Meas Trans20062011045
- LinacreJData variance: Explained, modeled and empiricalRasch Meas Trans2003173942943
- RaîcheGCritical Eigenvalue Sizes (Variances) in Standardized Residual Principal Components AnalysisRasch Meas Trans20051911012
- LehaneEMcCarthyGIntentional and unintentional medication non-adherence: a comprehensive framework for clinical research and practice? A discussion paperInt J Nurs Stud20074481468147716973166