
 ?Mathematical formulae have been encoded as MathML and are displayed in this HTML version using MathJax in order to improve their display. Uncheck the box to turn MathJax off. This feature requires Javascript. Click on a formula to zoom.
Abstract
Objectives
To identify patterns of adherence to nasal continuous positive airway pressure (nCPAP) use in the first 3 months of therapy among newly diagnosed adult patients with obstructive sleep apnea/hypopnea syndrome (OSAS) and their predictors. To develop pretherapy and in-therapy scores to predict adherence pattern.
Methods
Newly diagnosed adult OSAS patients were consecutively recruited from March to August 2013. Baseline clinical information and measures such as Epworth Sleepiness Scale (ESS), Fatigue Severity Scale (FSS), Zung’s Self-Rating Depression Scale (SDS), and The Pittsburgh Sleep Quality Index (PSQI) at baseline and at the end of 3rd-week therapy were collected. Twelve weeks’ adherence data were collected from the nCPAP memory card, and K-means cluster analysis was used to explore adherence patterns. Predictive scores were developed from the coefficients of cumulative logit models of adherence patterns using variables available at baseline and after 3 weeks of therapy. Performance of the score was validated using 500 bootstrap resamples.
Results
Seventy six patients completed a 12-week follow-up. Three patterns were revealed. Patients were identified as developing an adherence pattern that was poor (n=14, mean ± SD, 2.3±0.9 hours per night), moderate (n=19, 5.3±0.6 hours per night), or good (n=43, 6.8±0.3 hours per night). Cumulative logit regression models (good → moderate → poor) revealed independent baseline predictors to be ESS (per unit increase) (OR [95% CI], 0.763 [0.651, 0.893]), SDS (1.461 [1.238, 1.724]), and PSQI (2.261 [1.427, 3.584]); and 3-week therapy predictors to be ESS (0.554 [0.331, 0.926]), PSQI (2.548 [1.454, 4.465]), and the changes (3rd week–baseline data) in ESS (0.459 [0.243, 0.868]), FSS (3.556 [1.788, 7.070]), and PSQI (2.937 [1.273, 6.773]). Two predictive score formulas for poor adherence were developed. The area under the curve (AUC) of the receiver operating characteristics (ROC) curves for baseline and 3-week formulas were 0.989 and 0.999, respectively. Bootstrap analysis indicated positive predictive values of baseline and 3-week predictive scores in our patient population of 0.82 (95% CI [0.82, 0.83]) and 0.94 (95% CI [0.93, 0.94]), respectively.
Conclusion
A high level of prediction of poor adherence pattern is possible both before and at the first 3 weeks of therapy. The predictive scores should be further evaluated for external validity.
Background
Obstructive sleep apnea/hypopnea syndrome (OSAS) is a common sleep disorder characterized by repetitive obstruction of the upper airway that occurs in 2%–14% of adult populationsCitation1–Citation3 and 1% of pediatric age children,Citation4,Citation5 and causes oxygen desaturation and arousals from sleep.Citation6 OSAS has been reported to be an independent risk factor of cardiovascular diseases,Citation7,Citation8 traffic accidents caused by excessive daytime sleepiness (EDS),Citation9,Citation10 and executive dysfunctionCitation11,Citation12 and depression in both adults and children.Citation13,Citation14 Continuous positive airway pressure (CPAP) therapy has been demonstrated to be effective in treating OSAS by keeping the upper airway open and reducing the events of apnea/hypopnea.Citation15 However, the effectiveness of CPAP therapy depends on good adherence to CPAP use, such as using it for more than 4 hours per night during sleep.Citation16,Citation17 Only 40%–80% of OSAS patients have been reported to meet this minimum of 4 hours.Citation18–Citation23
To evaluate patients’ adherence, most studies adopted a mean of CPAP use per night between two time points and predefined adherence as a mean of over 4 hours per night.Citation18–Citation20 Another approach to evaluating adherence has been used in some prospective studies,Citation24,Citation25 which have described a long-term time-series trend of adherence to CPAP use and then defined patients’ adherence on the bases of patterns over time, such as good adherence pattern, consistent pattern, etc.
Previous studies have found that nonadherence to CPAP use was influenced not only by pretherapy factors such as demography (ie, age, sex),Citation21,Citation23,Citation26,Citation27 baseline clinical information (ie, apnea/hypopnea index [AHI], EDS, sleep quality),Citation19,Citation21,Citation28–Citation32 and psychological factors (ie, depression),Citation30,Citation33 but also by in-therapy variables such as the improvement of symptomsCitation34 and early adherence.Citation20,Citation35 While these studies have yielded valuable information on factors affecting adherence, as far as is known, none has applied the findings to develop a practical score that can be used to predict the pattern of adherence to CPAP use and to identify patients likely to develop a poor adherence pattern. Such patients could then be targeted for investigation of individual problems and for further encouragement in CPAP use.
The aims of this study, therefore, were to identify patterns of CPAP use in the first 12 weeks of therapy, and to develop practical scores that can be used, before or after the start of therapy, to predict poor adherence in a population of adult Chinese patients with OSAS.
Methods
Subjects
Using the guideline for OSAS diagnosis and therapy,Citation36 newly diagnosed OSAS patients aged 18 years or more were consecutively recruited from March to August 2013, at the Sleep Center of The First People’s Hospital of Yunnan Province, and the Department of Respiratory Medicine of The Second Affiliated Hospital of Kunming Medical University. Patients were excluded if they did not start nasal CPAP (nCPAP) therapy within 30 days after the titration trial at the sleep center.
Sleep test
The diagnostic polysomnography (Alice 5; Respironics, PA, USA) included electroencephalography, electrooculography, chin electromyography, airflow at the nose and mouth, abdominal and chest movements, electrocardiography, sleep position, and snoring frequency. An apneic episode was defined as a complete cessation of airflow or reduction in airflow by more than 90% of the baseline for at least 10 s, and a hypopneic episode was defined as a reduction in airflow by more than 30% of the baseline for at least 10 s in association with a fall in arterial oxygen saturation of at least 4%; or 50% of the baseline for at least 10 s in association with a fall in arterial oxygen saturation of at least 3%.Citation36
Data collection
Demographic data, height, weight, circumferences of neck, and waist and hip of each subject were recorded at the beginning of the study. Subjective daytime sleepiness, fatigue, depression, and sleep quality were measured using the Epworth Sleepiness Scale (ESS),Citation37 Fatigue Severity Scale (FSS),Citation38 Zung’s Self-Rating Depression Scale (SDS),Citation39 and The Pittsburgh Sleep Quality Index (PSQI)Citation40 before the onset of therapy and at the end of the 3rd week of therapy from the date of starting nCPAP therapy. To simplify the development of predictive scores, the integer values of FSS and SDS scales were used. Use of nCPAP was recorded by a memory card in the nCPAP, which stored the daily information on the times at pressure. Subjects were recommended to bring the nCPAP to the clinics to download the records at the end of the 12th week.
The protocol of this study was approved by the Ethics Committees of Prince of Songkla University and The Second Affiliated Hospital of Kunming Medical University. Informed consent was taken from all eligible participants.
Analysis
K-means cluster analysis was used to identify the patterns of adherence. The K-means method aims to partition the data into k groups such that the sum of squares from data within the assigned clusters is minimized.Citation41 Thus, we used the value of the between-cluster sum of squares (bss) divided by the total sum of squares (tss) as well as the number of subjects in the smallest cluster to decide on the optimum number of clusters to be selected. The number of clusters providing a high ratio of bss/tss but with a sufficient number of subjects in the smallest cluster to enable meaningful multivariate analysis to be undertaken was chosen. Ultimately, three clusters were chosen as optimal.
The potential predictor variables were then compared across the three clusters using the ANOVA F-test, Fisher’s exact test, or Kruskal–Wallis test, depending on the distribution of data. Paired t-test and Wilcoxon signed rank test were used to compare baseline data with the end of 3rd-week data. On the basis of the results of univariate analyses, variables were selected for inclusion in initial cumulative logit regression models to identify the independent predictors of adherence pattern, first using variables available at baseline and then those available after the first 3 weeks of therapy. Model refinement was conducted using manual backward exclusion, sequentially removing variables not contributing significantly to the fit of the model based on the change in log likelihood of successive models. All the significance tests were two-sided, and P-values less than 0.05 were considered as indicating statistical significance.
To develop a practical tool to predict adherence pattern, integer value weights were then allocated in place of the coefficients from the cumulative logit models, maintaining approximately the same ratios as among the coefficients. The sum of the weighted predictors was calculated for each patient and used as the single predictor in binary logistic models to predict the outcome of poor adherence pattern. Receiver operating characteristics (ROC) curves were constructed to demonstrate the discriminating ability of each model.
A suitable cut-off point was then chosen for each model. The cut-off points selected were those corresponding in our sample to the maximum specificity for which the sensitivity was 100%. Performance of the predictive models using these cut-off points was then explored by applying them to 500 bootstrap resamples created from our original sample.
Results
Eighty newly diagnosed OSAS patients were recruited in this study; four patients were lost to follow-up, one at the 3rd week and three at the 9th week. The remaining 76 patients finished the 12-week follow-up, giving a completion rate of 95%. Among these 76 patients, comprising 58 males and 18 females, the mean age was 48.1 years (range: 18–78) and mean AHI was 51.2 hour−1 (range: 15.0–138.0). The overall mean of the average duration of nightly use of nCPAP during 12 weeks of follow-up was 5.60 hours (range: 1.17–7.44) and within each 3-week period was 5.45 hours (range: 3.06–6.74) in weeks 1–3, 5.48 hours (range: 0.30–7.89) in weeks 4–6, 5.70 hours (range: 0.00–8.09) in weeks 7–9, and 5.78 hours (range: 0.45–7.76) in weeks 10–12. The 3-week average nightly adherences in each patient of the 12 weeks of study are shown in .
Figure 1 Distributions of adherence to nCPAP among newly diagnosed OSAS patients over time.
Abbreviations: nCPAP, nasal continuous positive airway pressure; OSAS, obstructive sleep apnea/hypopnea syndrome; CI, confidence interval.
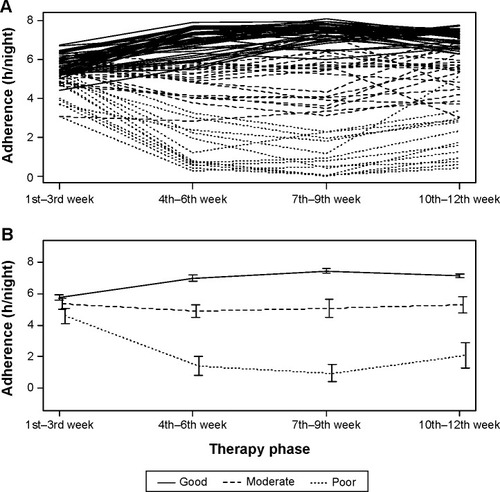
The values of bss/tss, and the number of subjects in the smallest cluster for different cluster numbers in the K-means cluster analysis are shown in . The three-cluster model was chosen, and the adherence patterns of the patients in each of these clusters are distinguished in , the patterns constituting an ordinal set. Fourteen patients (18.4%) formed a cluster with a noticeably declining adherence after the 3rd week and are referred to henceforth as having a poor adherence pattern (“poor pattern”), 19 patients (25%) tended to maintain their initial levels of adherence (“moderate pattern”), and 43 (56.6%) patients developed a noticeably improved adherence after the 3rd week (“good pattern”). The within-cluster means of average 3-week nightly adherence are indicated in . From the 4th to the 12th week, the within-cluster means (SD) of 3-week average nightly mean hours CPAP use for poor, moderate, and good patterns were 1.61 (1.06), 5.47 (0.71), and 7.18 (0.35).
Table 1 Evaluation parameter of bss/tss from K-means cluster analysis and the number of subjects in the smallest cluster from K-means cluster analysis
shows the values of variables according to the three adherence patterns identified by the K-means cluster analysis. The poor adherence group comprised a relatively larger proportion of females than the moderate and good groups. At baseline, two important measures of daytime symptoms, ESS and FSS scores, showed no significant difference among the three patterns, but those developing a poor adherence had worse depression. The measures of nocturnal symptoms, AHI and sleep quality score, differed significantly across the patterns. Patients with poor adherence pattern had a relatively lower AHI but worse sleep quality. After 3 weeks of therapy, the subjective feeling of sleepiness measured by the ESS score dramatically declined to a similar level among the three groups but with a significantly different absolute change across the three groups. The change in the FSS score showed not only a significant difference among the three groups but also an ordinal trend across the three adherence patterns. A similar trend to that of the FSS score was seen in the change in the SDS score, but with no change in the poor adherence group. Sleep quality in the poor adherence group showed no significant change after 3 weeks of therapy, a slightly increased (worse) score in moderate adherence, and a decreased (improved) score in the good adherence group ().
Table 2 Baseline and 3rd week information and the average nightly adherence during the study according to the three patterns of adherence
On the basis of the results of the univariate analyses, all baseline variables except ratio of blood oxygen saturation were included in an initial cumulative logit model to identify pretherapy predictors of the three adherence patterns (good → moderate → poor). After model refinement, ESS, SDS, and PSQI remained. Worse daytime sleepiness (higher score) (OR =0.763, 95% CI: 0.651, 0.893) favored a better adherence pattern, whereas worse depression (higher score) (OR = 1.461, 95% CI: 1.238, 1.724) and worse sleep quality (higher score) (OR =2.261, 95% CI: 1.427, 3.584) favored a poorer adherence pattern ().
Table 3 Cumulative logit regression results of baseline predictors of 12-week adherence pattern
Nine baseline variables, the average adherence hours of nCPAP during the 1st to 3rd week, and the changes in ESS, FSS, SDS, and PSQI scores were considered potential in-therapy predictors of three adherence groups and were included in a second initial cumulative logit model. After model refinement, five variables, namely, baseline ESS and PSQI scores and the changes in the scores of ESS, FSS, and PSQI, were identified as statistically significant independent predictors. Worse daytime sleepiness (higher score) (OR =0.554, 95% CI: −0.331, 0.926) at baseline and worsening sleepiness (positive value of change) (OR =0.459, 95% CI: 0.243, 0.868) in the first 3 weeks favored improved subsequent adherence. By contrast, poorer baseline sleep quality (higher score) (OR =2.548, 95% CI: 1.454, 4.465) and worsening sleep quality in the first 3 weeks (positive value of change) (OR =2.937, 95% CI: 1.273, 6.773) favored poorer subsequent adherence. Worsening fatigue in the first 3 weeks (positive value of change) (OR =3.556, 95% CI: 1.788, 7.070) was associated with a poorer pattern of adherence ().
Table 4 Cumulative logit regression results of first-3-week therapy predictors of 12-week adherence pattern
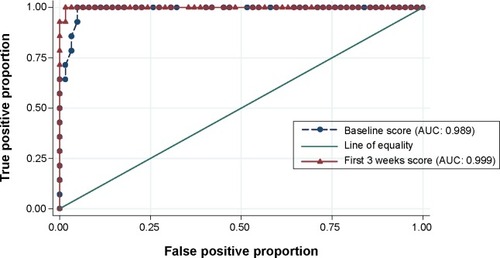
For practical application, the allocated weights for each variable in the models, shown in and , were used to combine the identified predictor variables into single scores for each patient. The distributions of these scores for each of the three adherence patterns are shown in . The scores were then used as the single predictor in binary logistic models in which the outcome was poor adherence pattern compared with moderate or good adherence pattern. ROC curves of both models had high area under the curve (AUC) (0.989 and 0.999, respectively) (P=0.166, chi-square test) (). The corresponding equations for the predictive scores, therefore, were
and
Figure 2 Distributions of baseline and first 3 weeks predictive score among three adherence patterns.
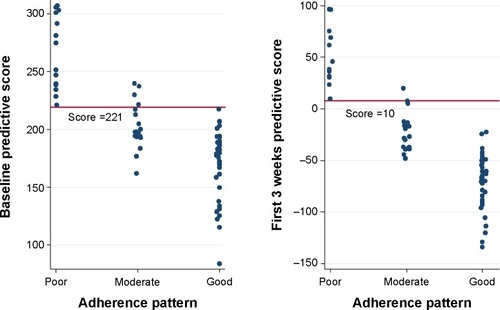
Figure 3 ROC curves of baseline and first-3-weeks predictive scores. Each symbol represents a different score.
From each ROC curve, a suitable cut-off point was chosen to explore the predictive ability of each score. The point chosen was that corresponding to the lowest false positive proportion consistent with 100% true positive proportion in our data set. These points were < 221/≥221for the baseline score and <10/≥10 for the 3-week score. Evaluation of the predictive performance of these scores and the corresponding cut-off points revealed that 95% of the values of positive predictive value lay between 0.815 and 0.832 for the baseline model and between 0.930 and 0.942 for the 3-week model ().
Table 5 Bootstrap evaluation of predictive ability of baseline and first-3-week predictive scores using the selected cut-off pointsTable Footnotea (mean and 95% bootstrap confidence interval)
Discussion
Three distinct patterns of adherence to CPAP use among adult Chinese patients with OSAS in the first 3 months of therapy were identified – those developing a poor level, those maintaining a moderate level, and those developing a good level of adherence. Practical scores that can be easily computed on the basis of ESS, SDS, and PSQI before start of therapy and based on baseline ESS and PSQI and change from baseline after the first 3 weeks of therapy in ESS, FSS, and PSQI were constructed, and each score was demonstrated to have a high predictive ability to identify patients with poor adherence pattern in a population similar to that providing the sample used in this study.
Adherence to CPAP use has been studied for decades, with most studies evaluating patients’ adherence using an average nightly adherence over the whole study period. The average values have then been compared with those previously identified as being correlated with clinical outcome.Citation16,Citation17 Thus, an average nightly adherence of > 7 hours was considered to be optimal adherence, 4 to ≤7 hours to be suboptimal, and <4 hours to be nonadherence.Citation16,Citation17
Similar to our study, Aloia et alCitation25 identified patterns of adherence among 71 patients in the USA from nightly records over 1 year to which they applied time-series analysis. The results of analysis were used to allocate patients to different patterns by two independent observers. In this way, seven different patterns were distinguished – good users, slow improvers, slow decliners, variable users, occasional attempters, early dropouts, and nonusers. However, no practical scoring system was developed in their study.
An interesting finding of the current study is that the timing of divergence of the patterns into good, moderate, and poor adherence was first apparent in the 4th- to 6th-week period. This phenomenon suggests that particular attention to monitoring adherence should be paid toward the end of the first 3 weeks of therapy.
Consistent with recent studies,Citation18,Citation19,Citation21,Citation30,Citation42 neither sex nor age was identified as an independent predictor of adherence in our study after adjusting for sleep-related parameters, even though 50% of the females had a poor adherence pattern, compared with only 9% of the males. Other potential risk factors of OSAS, such as high body mass index (BMI) and waist–hip ratio (WHR), were also not significant in the final models, again consistent with other recent studies.Citation18,Citation19,Citation21,Citation30,Citation42
The disease severity index, AHI, also was not a statistically significant predictor of adherence in this study. Similar results have been reported by others.Citation19,Citation43,Citation44 Compared with significant independent adherence predictors of this study, namely, ESS, SDS, and PSQI, the nonsignificance of AHI could be explained as being due to the lack of awareness of sleep apnea/hypopnea, which might not be easily detected by the patients or their bed partners during night time, or as being due to the effects of AHI rather than AHI itself that influenced the level of adherence. High levels of daytime sleepiness are self-evident in the daytimeCitation6,Citation9,Citation10 and may encourage OSAS patients to adhere to the therapy;Citation23,Citation29 ESS correspondingly contributes a negative weight to the predictive score. By contrast, poor sleep quality contributed a positive weight score to the predictive score. Poor sleep quality may cause patients to blame the poor quality on using the CPAP and thus avoid its use to ensure sleep quality. Low mood, which also has a positive score, also might cause a negative attitude toward the use of CPAP. Means et alCitation33 indicated that depression could reduce CPAP use hours.
In our 3-week model, average nightly adherence during the first 3 weeks was not a significant predictor independent of the parameters retained in the model, despite its differing significantly across the three adherence groups in univariate analysis, and has been reported to be related to subsequent adherence in other studies.Citation20,Citation35 This suggests that the characteristics of daytime sleepiness, fatigue, and sleep quality are stronger predictors of overall adherence pattern than the early adherence. In terms of a practical score to predict subsequent adherence, the lack of a requirement to consider the first 3 weeks of adherence is something of an advantage, as to reliably measure adherence would require the information to be read from the smart card of the CPAP device, which in turn would require the patient to bring in the card or the device and for the availability of a card reader. Using a clinical scale may be simpler.
Improvements in fatigue and sleep quality after the first 3 weeks of therapy were related to better adherence in this study. Previous studies have also indicated that when patients feel they have benefited fromCitation34 or are satisfiedCitation35 with CPAP therapy, they tend to increase their use of CPAP. Unexpectedly, an improvement in ESS (negative change) over the first 3 weeks was associated with a greater probability of being a poor adherer in our 3-week model. The explanation is that, while improvement on ESS was correlated with an improvement in FSS, change in FSS was more strongly related than ESS to adherence pattern; including both predictors resulted in a change in the direction of influence of ESS on adherence pattern.
Practical numerical scores to predict outcome have been developed for many different clinical settings,Citation45,Citation46 although, to our knowledge, not previously for adherence to CPAP therapy.
A strength of our study is the use of an objective method to identify adherence patterns, the use of multiple regression models and integer weights to generate the predictive scores, and the evaluation of the predictive ability of the scores using a bootstrap approach,Citation47,Citation48 which avoids the tendency to overestimate the quality of a proposed prediction tool.
Of the two scores, that for use before start of therapy and that for use after the first 3 weeks of therapy, the latter seems, not surprisingly, to have somewhat better predictive ability. A shortcoming of using the 3-week score, however, is the delay in identifying probable poor adherers. A previous studyCitation35 reported that about 22% of the patients refused to continue therapy after 2 weeks’ trial. Thus, using the baseline score could help to identify high-risk patients before they develop poor adherence or nonadherence.
In conclusion, two simple scores with a high predictive ability to identify patients who are likely to develop poor adherence to nCPAP use have been constructed. The scores require the results of ESS, FSS, SDS, and PSQI scales, each of which is simple to administer at a clinic visit. Application of these scales is expected to increase the cost-effectiveness of interventions for patients with OSAS. Although these scores were developed for adult Chinese patients, these or similar scores could be developed for OSAS patients among other populations. Further investigation to evaluate the external validity of such scores is suggested.
Acknowledgments
This study was supported by the Yunnan Provincial Science and Technology Department (2011CZ048) and the National Natural Science Foundation of China (81460017). The study was conducted in partial fulfillment of the requirements of PhD degree in Epidemiology of the first author at Prince of Songkla University.
Disclosure
All the authors report no conflicts of interest in this study.
References
- PeppardPEYoungTBarnetJHPaltaMHagenEWHlaKMIncreased prevalence of sleep-disordered breathing in adultsAm J Epidemiol20131771006101423589584
- KimJInKKimJPrevalence of sleep-disordered breathing in middle-aged Korean men and womenAm J Respir Crit Care Med20041701108111315347562
- YoungTPaltaMDempseyJSkatrudJWeberSBadrSThe occurrence of sleep-disordered breathing among middle-aged adultsN Engl J Med1993328123012358464434
- BrunettiLRanaSLospallutiMLPrevalence of obstructive sleep apnea syndrome in a cohort of 1,207 children of southern ItalyChest200112061930193511742924
- BixlerEOVgontzasANLinHMSleep disordered breathing in children in a general population sample: prevalence and risk factorsSleep200932673173619544748
- American Academy of Sleep MedicineInternational Classification of Sleep Disorders, Revised: Diagnostic and Coding ManualChicago, ILAmerican Academy of Sleep Medicine 2001
- McNicholasWTBonsigoreMRManagement Committee of EU COST ACTION B26. Sleep apnoea as an independent risk factor for cardiovascular disease: current evidence, basic mechanisms and research prioritiesEur Respir J20072915617817197482
- MarinJMCarrizoSJVicenteEAgustiAGLong-term cardiovascular outcomes in men with obstructive sleep apnoea-hypopnoea with or without treatment with continuous positive airway pressure: an observational studyLancet20053651046105315781100
- LloberesPLevyGDescalsCSelf-reported sleepiness while driving as a risk factor for traffic accidents in patients with obstructive sleep apnoea syndrome and in non-apnoeic snorersRespir Med20009497197611059950
- LindbergECarterNGislasonTJansonCRole of snoring and daytime sleepiness in occupational accidentsAm J Respir Crit Care Med20011642031203511739131
- SaunamakiTHimanenSLPoloOJehkonenMExecutive dysfunction in patients with obstructive sleep apnea syndromeEur Neurol200962423724219672077
- EspositoMAntinolfiLGallaiBExecutive dysfunction in children affected by obstructive sleep apnea syndrome: an observational studyNeuropsychiatr Dis Treat201391087109423976855
- GylenEAnttalainenUSaaresrantaTRelationship between habitual sleep duration, obesity and depressive symptoms in patients with sleep apnoeaObes Res Clin Pract201485e459e46525263835
- CarotenutoMEspositoMParisiLDepressive symptoms and childhood sleep apnea syndromeNeuropsychiatr Dis Treat2012836937322977304
- GayPWeaverTELoubeDIberCEvaluation of positive airway pressure treatment for sleeprelated breathing disorders in adultsSleep20062938140116553025
- WeaverTEMaislinGDingesDFRelationship between hours of CPAP use and achieving normal levels of sleepiness and daily functioningSleep200730671171917580592
- AnticNACatchesidePBuchanCThe effect of CPAP in normalizing daytime sleepiness, quality of life, and neurocognitive function in patients with moderate to severe OSASleep201134111111921203366
- YeLPackAIMaislinGPredictors of continuous positive airway pressure use during the first week of treatmentJ Sleep Res201221441942621988137
- WallaceDMVargasSSSchwartzSJAloiaMSShafazandSDeterminants of continuous positive airway pressure adherence in a sleep clinic cohort of South Florida Hispanic veteransSleep Breath201317135136322528953
- BudhirajaRParthasarathySDrakeCLEarly CPAP use identifies subsequent adherence to CPAP therapySleep200730332032417425228
- AlvesCCaminhaJMda SilvaAMMendoncaDCompliance to continuous positive airway pressure therapy in a group of Portuguese patients with obstructive sleep apnea syndromeSleep Breath201216255556221688210
- LewisKESealeLBartleIEWatkinsAJEbdenPEarly predictors of CPAP use for the treatment of obstructive sleep apneaSleep200427113413814998250
- SinDDMayersIManGCPawlukLLong-term compliance rates to continuous positive airway pressure in obstructive sleep apnea: a population-based studyChest2002121243043511834653
- KribbsNBPackAIKlineLRObjective measurement of patterns of nasal CPAP use by patients with obstructive sleep apneaAm Rev Respir Dis199314748878958466125
- AloiaMSGoodwinMSVelicerWFTime series analysis of treatment adherence patterns in individuals with obstructive sleep apneaAnn Behav Med2008361445318726659
- WoehrleHGramlAWeinreichGAge- and gender-dependent adherence with continuous positive airway pressure therapySleep Med201112101034103622033117
- JansonCNogesESvedberg-RandtSLindbergEWhat characterizes patients who are unable to tolerate continuous positive airway pressure (CPAP) treatment?Respir Med200094214514910714420
- TarasiukAReznorGGreenberg-DotanSReuveniHFinancial incentive increases CPAP acceptance in patients from low socioeconomic backgroundPLoS One201273e3317822479368
- WolkoveNBaltzanMKamelHDabrusinRPalayewMLong-term compliance with continuous positive airway pressure in patients with obstructive sleep apneaCan Respir J200815736536918949106
- PiehCBachMPoppRInsomnia symptoms influence CPAP complianceSleep Breath20131719910422311553
- YetkinOKunterEGunenHCPAP compliance in patients with obstructive sleep apnea syndromeSleep Breath200812436536718481129
- SomiahMTaxinZKeatingJSleep quality, short-term and long-term CPAP adherenceJ Clin Sleep Med20128548950023066359
- MeansMKUlmerCSEdingerJDEthnic differences in continuous positive airway pressure (CPAP) adherence in veterans with and without psychiatric disordersBehav Sleep Med20108426027320924838
- CrawfordMRBartlettDJCoughlinSRThe effect of continuous positive airway pressure usage on sleepiness in obstructive sleep apnoea: real effects or expectation of benefit?Thorax2012671092092422639230
- PopescuGLathamMAllgarVElliottMWContinuous positive airway pressure for sleep apnoea/hypopnoea syndrome: usefulness of a 2 week trial to identify factors associated with long term useThorax200156972773311514695
- Chinese Society of Respiratory DiseasesObstructive sleep apnea/hypopnea diagnosis guidelineChin J Tuberc Respir Dis201235912
- JohnsMWA new method for measuring daytime sleepiness: the Epworth sleepiness scaleSleep19911465405451798888
- KruppLBLaRoccaNGMuir-NashJSteinbergADThe fatigue severity scale. Application to patients with multiple sclerosis and systemic lupus erythematosusArch Neurol19894610112111232803071
- ZungWWA self-rating depression scaleArch Gen Psychiatry196512637014221692
- BuysseDJReynoldsCF3rdMonkTHBermanSRKupferDJThe Pittsburgh Sleep Quality Index: a new instrument for psychiatric practice and researchPsychiatry Res19892821932132748771
- HartiganJAWongMAA K-means clustering algorithmAppl Stat197928100108
- BakkerJPO’KeeffeKMNeillAMCampbellAJEthnic disparities in CPAP adherence in New Zealand: effects of socioeconomic status, health literacy and self-efficacySleep201134111595160322043130
- SawyerAMCanamucioAMoriartyHWeaverTERichardsKCKunaSTDo cognitive perceptions influence CPAP use?Patient Educ Couns2011851859121071166
- CampbellANeillALoryREthnicity and socioeconomic status predict initial continuous positive airway pressure compliance in New Zealand adults with obstructive sleep apnoeaIntern Med J2012426e95e10121040323
- RamchandranKJShegaJWVon RoennJA predictive model to identify hospitalized cancer patients at risk for 30-day mortality based on admission criteria via the electronic medical recordCancer2013119112074208023504709
- CanaveseGBruzziPCatturichAA risk score model predictive of the presence of additional disease in the axilla in early-breast cancer patients with one or two metastatic sentinel lymph nodesEur J Surg Oncol201440783584224684810
- SteyerbergEWBleekerSEMollHAGrobbeeDEMoonsKGInternal and external validation of predictive models: a simulation study of bias and precision in small samplesJ Clin Epidemiol200356544144712812818
- SteyerbergEWHarrellFEJrBorsboomGJEijkemansMJVergouweYHabbemaJDInternal validation of predictive models: efficiency of some procedures for logistic regression analysisJ Clin Epidemiol200154877478111470385