
Abstract
Background
Studies in chronic noncancer pain settings have found that opioid use increases health care utilization. Despite the key role of analgesics, specifically opioids, in the setting of cancer pain, there is no literature to our knowledge about the relationship between adherence to prescribed around-the-clock (ATC) analgesics and acute health care utilization (hospitalization) among patients with cancer pain.
Purpose
To identify adherence patterns over time for cancer patients taking ATC analgesics for pain, cluster these patterns into adherence types, combine the types into an adherence risk factor for hospitalization, identify other risk factors for hospitalization, and identify risk factors for inconsistent analgesic adherence.
Materials and methods
Data from a 3-month prospective observational study of patients diagnosed with solid tumors or multiple myeloma, having cancer-related pain, and having at least one prescription of oral ATC analgesics were collected. Adherence data were collected electronically using the medication event-monitoring system. Analyses were conducted using adaptive modeling methods based on heuristic search through alternative models controlled by likelihood cross-validation scores.
Results
Six adherence types were identified and combined into the risk factor for hospitalization of inconsistent versus consistent adherence over time. Twenty other individually significant risk factors for hospitalization were identified, but inconsistent analgesic adherence was the strongest of these predictors (ie, generating the largest likelihood cross-validation score). These risk factors were adaptively combined into a model for hospitalization based on six pairwise interaction risk factors with exceptional discrimination (ie, area under the receiver-operating-characteristic curve of 0.91). Patients had from zero to five of these risk factors, with an odds ratio of 5.44 (95% confidence interval 3.09–9.58) for hospitalization, with a unit increase in the number of such risk factors.
Conclusion
Inconsistent adherence to prescribed ATC analgesics, specifically the interaction of strong opioids and inconsistent adherence, is a strong risk factor for hospitalization among cancer outpatients with pain.
Introduction
Patients with cancer experience multiple and burdensome care transitions, including hospitalizations and greater use of emergency departments.Citation1–Citation8 Improvements in overall cancer survival make it imperative to understand factors that relate to unnecessary acute health care utilization among patients with cancer.
Analgesics remain the predominant paradigm of cancer pain management, and the majority of the patients with moderate-to-severe cancer pain are treated with opioids. In the US, the prevalence of insured people with opioid claims has increased, and individuals with cancer have significantly more pharmacy claims, as well as claims for higher doses of opioids.Citation9 A recent report by the Medicare Payment Advisory Commission showed that 1.1 million Medicare Part D (drug coverage) beneficiaries with cancer received 6.2 million opioid prescriptions or an annual average of 5.5 prescriptions per beneficiary, accounting for a cost of $0.26 billion.Citation10 A number of studies, conducted mainly in chronic noncancer pain (CNCP) settings, have found that opioid use increases adverse events and acute health care utilization.Citation11–Citation13 Patients who are prescribed opioids incur higher health care costs in multiple health care utilization domains, including inpatient, outpatient emergency department, physician and pharmacy services, and other outpatient settings.Citation14 Despite the key role of analgesics in the setting of cancer pain, there is no literature to our knowledge about the relationship between adherence to prescribed around-the-clock (ATC) analgesics and health care utilization among outpatients with cancer pain.
We are not aware either of any studies that have typified patterns of analgesic adherence for cancer pain using objective adherence measures. Patterns of adherence are expected to differ among patients, based on motivational, clinical, and circumstantial factors, such as analgesic beliefs and fears,Citation15–Citation21 self-efficacy and satisfaction with pain management,Citation22 and access and cost-related concerns.Citation23 Adherence also varies by type of analgesics being prescribed and complexity of the medication regimen. In one study of self-reported adherence to analgesia for cancer pain, a majority (51%) of patients reported lower levels of analgesic adherence.Citation24 Only 9% were in the high-analgesic-adherence group.Citation24 It is not clear how different patterns of analgesic use for cancer pain may relate to health care utilization outcomes.
This study is a secondary analysis of a 3-month prospective observational study designed to investigate preference and adherence to prescribed ATC analgesia in outpatients with cancer pain.Citation25,Citation26 A serendipitous finding not addressed in the original study was that ATC analgesic adherence patterns predicted 3-month hospitalization in outpatients with cancer pain. We present the analyses pertaining to this finding here. The specific aims were:
to assess unique types of analgesic adherence patterns using MEMS® (medication event-monitoring system; MVW Switzerland Ltd., Sion, Switzerland) over time in outpatients with cancer pain who were prescribed ATC analgesics
to investigate if the unique types of analgesic adherence patterns over time predict health care utilization outcomes (hospitalizations) in this sample of cancer outpatients who were prescribed ATC analgesics
to identify predictors of inconsistent analgesic adherence patterns over time in this sample of cancer outpatients who were prescribed ATC analgesics.
Materials and methods
Study design and sample
A prospective observational study with repeated measures at two time points, ie, baseline and 3 months, was employed. Participants (n=196) were recruited between December 2009 and August 2011 from two outpatient medical oncology clinics of a large academic medical center in Philadelphia. Patients were invited to participate in the study if they were self-identified as African-American or white, at least 18 years of age, diagnosed with solid tumors or multiple myeloma, having cancer-related pain, and had at least one prescription of oral ATC analgesics. Patients were excluded from participation if they were prescribed ATC analgesics using only a transdermal system (eg, fentanyl patch) due to limitations of MEMS bottles. The study was approved by the Institutional Review Board of the University of Pennsylvania, and all participants provided informed consent.
Study measures
Prescribed ATC analgesics
The information regarding prescribed ATC analgesics (index analgesic) was collected based on patients’ self-report during baseline survey, and was triangulated with patients’ electronic medical records. Index analgesics were coded according to the World Health Organization (WHO) analgesic ladder.Citation27,Citation28 This includes step 1 (nonopioid analgesics), step 2 (weak-opioid analgesics, such as codeine), and step 3 (strong opioids, such as morphine, oxycodone, and methadone). We further coded the strong opioids (WHO step 3) as immediate-release versus extended- or sustained-release (long-acting) opioids.
MEMS analgesic adherence
Analgesic adherence was captured using MEMS. MEMS is a medication bottle with a microprocessor that records openings of the MEMS cap in real time. Dose adherence was the primary measure for the parent study of ATC analgesic adherence, defined as the percentage of the total number of prescribed doses that were actually taken by the participant.
Each participant was instructed on the correct use of the MEMS bottle at baseline, followed by a phone call within the first 7 days. Participants were asked about their use of MEMS and if they had any questions about its proper use. Participants were instructed to 1) use the MEMS bottle only to take the index analgesic, 2) take the prescribed analgesic from the MEMS bottle for the entire duration of the study, including any refills for the index medication, 3) notify any changes in the medication’s dose or frequency to the study staff, and 4) document any instances of bottle openings other than when taking the index medications in a medication logbook provided by the study staff.
Drug, dose, and frequency of change of the index medication
PowerView (MVW Switzerland Ltd., Sion, Switzerland) software was used to record MEMS adherence. If the index medication or its frequency changed over the study period, a new medication entry (phase) was created, with the previous phase ending at PowerView’s default time of 2.59 am on the day of the change and the next phase beginning at 3 am. In the event of a dose change of the index medication over the study period, the average of the two (or more) dosages was reported without creating a new phase. If a participant recorded in the log having taken doses that the MEMS bottle did not record, the events were added to the MEMS data before computation. This could occur, for example, if a patient took out four pills at once for a 2-day trip. Similarly, if a patient reported extra openings for reasons other than when taking the index medication, extra openings were deleted from the MEMS adherence computation. Excluded events included openings to count remaining pills, accidental openings, and openings to fill the bottle with refilled index medication.
Hospitalizations
Data on hospitalization (including the name of the facility, dates of admission, and reason for admission) were gathered based on self-report between the index period (baseline and 3 months) and review of study logs and patients’ medical records. The duration of hospitalization was calculated by subtracting the admission date from the discharge date. The hospitalization periods were adjusted in the adherence computation as unmonitored periods starting on the calendar day of admission at 3 am and ending on the calendar after discharge at 2.59 am.
Covariates and confounders
Preference for analgesic treatment
Choice-based conjoint analysis, a trade-off analysis technique, was used to assess preferences and trade-offs patients employ in using prescribed analgesics. The detailed methodology we used to design and validate the choice-based conjoint experiment has been described previously.Citation25 Trade-offs were elicited on five analgesic attributes: 1) type of analgesic, 2) percentage pain relief with analgesics, 3) type of side effects, 4) severity of side effects, and 5) out-of-pocket cost of analgesics.
Pain severity and pain-related function
The Brief Pain Inventory was used to assess pain severity (four items: pain at its worst, least, average, and now) and pain-related functional interference (seven items: general activity, mood, walking ability, normal work, relationships, sleep, and enjoyment of life).Citation29 Each item is scored on a 0–10 scale (0= no pain and 10= pain as bad as you can imagine; 0= no interference and 10= interferes completely). The psychometrics of the Brief Pain Inventory are well-established, with a Cronbach’s α that ranges from 0.77 to 0.91.
Pain Management Index
The Pain Management Index (PMI) is a measure of adequacy of pain treatment based on the WHO guidelines for treating cancer painCitation27,Citation28 and on the most potent analgesic prescribed to a patient relative to the level of their reported pain. The PMI is calculated by subtracting the patient’s “worst pain” score (from the Brief Pain Inventory, coded as mild, moderate, or severe) from the most potent analgesia prescribed according to the three-step WHO analgesic ladder. A negative PMI score indicates inadequate analgesic prescription relative to the reported pain level.
Analgesic attitudes and barriers
The Barriers Questionnaire (BQ)-II,Citation20 a widely used measure to assess patients’ beliefs about the management of cancer pain, was employed. The BQ-II is a 27-item instrument that elicits patients’ pain-management concerns in eight domains: 1) fear of addiction, 2) fear of tolerance, 3) fear of side effects, 4) fatalism about cancer pain, 5) desire to be a good patient, 6) fear of distracting health provider from treating cancer, 7) fear that the analgesics impair the immune system, and 8) concern that analgesics may mask ability to monitor illness symptoms. The responses range from 0 (do not agree) to 5 (agree very much). The scoring is based on sums for items for the total scale and subscales (physiological, fatalism, communication, and harmful effects). The internal consistency of the scale is excellent, at 0.89.Citation20
Analgesic side effects
Analgesic-related side effects were assessed using the Medication Side-Effects Checklist. This elicits information on the presence and severity of eight common analgesic side effects during the past week (0–10, no severity–extreme severity). The internal consistency reliability is greater than 0.80.
Intentional versus unintentional nonadherence
A validated self-report measure, the Morisky Medication Adherence Scale, was used to elicit intentional (active) and unintentional (passive) dimensions of analgesic nonadherence. Items corresponding to unintentional nonadherence include “I sometimes forget to take my pain medicine” and “I am sometimes careless about taking my pain medicine”. Items corresponding to intentional nonadherence include “When I feel better, I sometimes stop taking my pain medicine” and “If I feel worse when I take the pain medicine, sometimes I stop taking it”. The participants were instructed to indicate the extent to which they agreed with each statement on the Morisky 4-point scale. The scores for the four items were aggregated to give a score ranging from 0 to 4; higher scores indicated higher levels of reported nonadherence. The tool’s internal consistency in different studies has ranged from 0.61 to 0.73.Citation24,Citation30
Social Support Questionnaire
A six-item questionnaire was used to measure participants’ perceptions of social support and satisfaction with social support.Citation31 The first part of the questionnaire asks participants to list individuals who provide social support in that domain (eg, whom they can count on to be dependable when they need help), and the second part of the questionnaire asks participants to indicate their level of satisfaction with this support. This questionnaire is a shortened version of the original 27-item Social Support Questionnaire.Citation31
Sociodemographic, pain-treatment, and illness variables
Self-reported sociodemographic data were gathered on age, sex, self-identified race, marital status, education, health insurance, household income, job status, and health literacy. Health literacy was assessed using three brief screening questions:Citation32 “How often do you have someone help you read hospital materials?”; “How confident are you filling out medical forms by yourself?”; and “How often do you have problems learning about your medical condition because of difficulty understanding written information?” These questions have been found to be effective in detecting inadequate health literacy (areas under the receiver-operating-characteristic [ROC] curve of 0.87, 0.80, and 0.76, respectively). This brief measure has also been found to perform well against the widely used Test of Functional Health Literacy in Adults.Citation32 Responses range from “always” to “never”.
Pain treatment-related variables included total number and types of analgesics and coanalgesics, most potent analgesic prescribed, hours pain medications are effective, and pain relief with analgesics. Illness-related variables collected from patients’ medical records included stage of cancer, time since cancer diagnosis, past history of drug or substance abuse, comorbidities to compute the Charlson Comorbidity Index,Citation33 presence of chronic kidney disease, and presence of depression.
Statistical analysis
Adaptive modeling
Linear, logistic, and Poisson regression models for continuous, discrete, and count/rate outcomes can be adaptively modeled in terms of subsets of predictors with a two-phase process based on an heuristic search.Citation34 The model is first expanded by systematically adding in possibly power-transformed predictors, then contracted by removing unneeded terms and readjusting the powers for the remaining transforms.Citation34
Likelihood cross-validation
Likelihood cross-validation (LCV) scores are used to evaluate and compare alternative regression models for the same outcome. The data are randomly partitioned into k disjoint subsets called folds. Likelihoods (or likelihood-like functions, eg, extended quasilikelihoods)Citation35 for data in each fold are computed with model parameters estimated using the data in the other folds. These deleted fold likelihoods are combined into an LCV score, which is “larger is better”. Tolerance parameters indicating tolerable decreases in the LCV scores at given stages of the adaptive modeling process are used to control that process.
LCV-ratio tests
A model with a larger LCV score is not necessarily more preferable; the difference needs to be substantial. This can be determined using χ2-based LCV-ratio tests, analogous to likelihood-ratio tests. These are expressed in terms of a cutoff for a substantial (distinct, significant) percentage decrease in the LCV score for the model with the lower score compared to the model with the larger score. If the percentage decrease is larger than the cutoff, the model with the larger LCV score provides a substantial improvement over the model with the smaller LCV score. Otherwise, the model with the lower score is a competitive alternative, and if simpler (eg, based on fewer terms or not including interactions), it is then preferable as a parsimonious, competitive alternative. The cutoff changes with the sample size. An LCV-ratio test is used to control the contraction phase of the adaptive modeling process. The contraction continues as long as the next contracted model is a competitive alternative to the prior model and is also more parsimonious since it has one less term.
LCV-ratio tests are more conservative than tests for zero coefficients. For example, models based on a single risk factor can have a significant (P<0.05) slope for that risk factor, but the percentage decrease for the constant model compared to the model with that risk factor can be less than the cutoff for the data. Examples are provided in the “Results” section.
Individual patient-adherence patterns
MEMS cap openings were grouped into intervals within each individual patient’s study participation period of at least 3 days. Counts and rates per day per prescribed dose were computed for each such interval and modeled using Poisson regression methods. Adaptive modeling was used to fit possibly nonlinear curves for mean adherence and adherence variability (based on dispersions)Citation35 over time in the study. LCV scores were computed using extended quasilikelihoods based on the Poisson distribution.
Adherence types
Estimates of mean adherence and adherence variability at 20 proportionally spaced time points within each patient’s study participation period (and so a vector with 40 entries) were clustered. A variety of hierarchical clustering procedures and k-means clustering, each with varying numbers of clusters, were considered in this analysis as long as each cluster included at least 5% of the observations (to avoid sparse cases). LCV scores were computed using mixtures of multivariate normal distributions and then maximized to identify the most appropriate clustering alternative and number of clusters.
Risk factors for hospitalization
Individual risk factors for being hospitalized during the 3 months of patients’ study participation were adaptively determined using logistic regression models with LCV scores based on the Bernoulli distribution. Possible predictors included the adaptively generated adherence types, the commonly used dose-adherence measure, and the baseline measures described earlier. Each of the 27 items of the BQ-II was considered, as well as its total and subscales, to address more fully the impact of analgesic attitudes and barriers on hospitalization. Values for categorical predictors were combined into a two-level risk factor, generating the best LCV score. Values for ordinal and continuous predictors were combined into two levels corresponding to smaller or larger values than each observed value; the observed threshold value generating the best LCV score determined the associated risk factor. Groupings were considered only if both levels corresponded to at least 10% of the observations (to avoid sparse cases). The level generating an odds ratio (OR) >1 was used to define the associated risk factor for hospitalization. When a predictor had missing values, observations with missing values were combined with the non-risk factor-level observations to be conservative and so that the risk factor level was based entirely on observations with nonmissing predictor values.
Categorizing ordinal or continuous predictors into two levels has the potential for substantial loss of predictive capability. This issue was addressed by comparing LCV scores for the categorized risk factor to the model linear in the associated predictor. This comparison is only feasible for predictors with no missing values.
Individually significant (P<0.05) risk factors for hospitalization were identified first. Then, these were used to adaptively generate a multiple risk-factor model for hospitalization. These risk factors were also used to adaptively generate a multiple risk-factor plus pairwise-interaction model. Pairwise interactions were adaptively generated as long as the associated two levels corresponded to at least 10% of the observations (to avoid sparse cases) and the estimated slope was positive (so that it was a risk factor rather than a protective factor). These models were compared using LCV scores to identify the most appropriate model for the data. For some risk factors, there were no patients who were hospitalized for any of the risk-factor levels, causing problems for standard Wald χ2 tests (as commonly used for standard logistic regression models) of zero slopes for those risk factors, but not for associated robust empirical Wald z-tests (as used for generalized linear models). Consequently, for models with such risk factors, robust empirical Wald z-tests were reported instead.
Collinearity for the most appropriate model was assessed using Nagelkerke R2 values for logistic regression models of each risk factor or interaction in terms of the other risk factors and interactions. The count of how many of this model’s risk factors and interactions patients had was used as a risk index. The area under the ROC curve was computed for models, as well as the cross-validated accuracy (the percentage of observations correctly predicted using the maximum likelihood estimate, ie, the outcome value with the greater estimated probability using deleted parameter estimates and the risk-factor settings for an observation).
Risk factors for inconsistent adherence
The two-level risk factor based on the adaptive adherence types generated for predicting hospitalization was modeled using logistic regression in the same way as hospitalization. Possible predictors considered in these analyses were the baseline measures described earlier other than those related to adherence. Note that the threshold for a risk factor for inconsistent adherence based on a given variable can be different than the threshold for the risk factor for hospitalization based on that same variable.
Results
Baseline descriptive statistics
Usable MEMS data were available for 191 (97.4%) of the study participants. Descriptive statistics for these participants are provided in for variables in the categories of 1) sociodemographic; 2) illness; 3) pain, function, and pain treatment; 4) analgesic attitudes and barriers; and 5) subjective adherence.
Table 1 Baseline variables
Individual patient-adherence patterns
displays grouped adherence data along with mean adherence (the inner curve) and unit error bounds (the lower and upper curves representing ±1 estimated standard deviation in adherence rates) for selected patients 1–6. The raw data points are displayed as diamonds. These correspond to counts of MEMS cap openings in associated subintervals of time during study participation normalized by the length in days of the subintervals and by the prescribed rate. Therefore, the ideal mean adherence curve has a constant value of 1 at all times, with smaller variability around the value of 1 representing better adherence.
Figure 1 Adherence patterns for selected patients, including observed cap opening rates per day per dose, fitted mean adherence curve, and lower and upper unit error-bound curves.
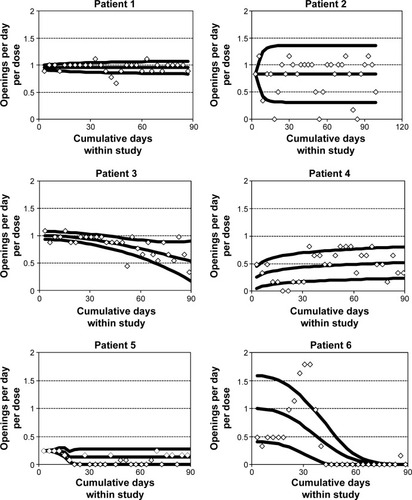
Patient 1 had consistent mean adherence over length of the study, with relatively low adherence variability. Patient 2 also had consistent mean adherence, but a little lower than the ideal value of 1 and with more variability than patient 1. Patient 3 had mean adherence at the start of the study close to 1 with low adherence variability, but mean adherence decreased somewhat over time while adherence variability increased. Patient 4 had moderate levels of mean adherence for most of the study, with more adherence variability than patient 1 but less than patient 2. Patient 5 had low mean adherence throughout the study, with low levels of adherence variability. Patient 6 had mean adherence starting out at approximately 1 and decreasing to 0 by the end of the study, while adherence variability started out very high and also decreased over time to 0.
Adherence types
Six adherence types were adaptively generated. Mean adherence and adherence-variability centroids (ie, averages of the entries of the clustered 40 vectors within each cluster) are plotted in . provides a description of these six adherence types, including sizes, characterizations of mean adherence and adherence-variability centroids, and averages of dose adherence for patients in each adherence type. Patients 1–6 had adherence patterns within adherence types 1–6, respectively.
Figure 2 Plots of mean adherence and adherence-variability centroids for adherence types.
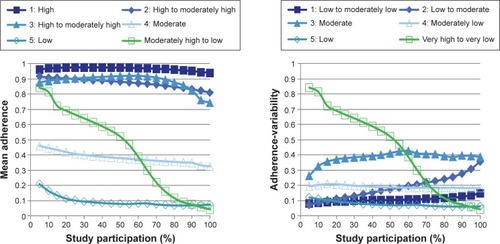
Table 2 Description of adherence types
Risk factors for hospitalization
A total of 32 (16.8%) patients with MEMS data were hospitalized at some point during study participation. contains the 21 individually significant risk factors for hospitalization identified through adaptive modeling.
Table 3 Individually significant risk factors for hospitalization
The strongest individually significant risk factor for hospitalization was inconsistent (clusters 1–5) versus consistent (cluster 1) adherence (), as it generated the largest LCV score of 0.66672 for predicting hospitalization (LCV scores not reported in ). The cutoff for a substantial percentage decrease in the LCV score for this data set with 191 observations was 1%. The constant model for predicting hospitalization had an LCV score of 0.63391 with a substantial decrease of 4.92% (ie, greater than the cutoff of 1%) compared to the model based on inconsistent adherence. The constant model generated a substantial percentage decrease for nine (43.9%) of the 21 risk factors provided in , indicating the conservative nature of LCV-ratio tests in comparison to standard tests for zero slopes.
Of the 21 risk factors (), 17 were based on ordinal or continuous variables with no missing data. Two of these variables (general health; BQ-II item – pain medicine makes you say or do embarrassing things) generated better (larger) LCV scores than their associated risk factors, but those risk factors generated competitive LCV scores (ie, with percentage decrease less than 1%). The other variables generated worse (smaller) LCV scores, with four of these variables (BQ-II item – confusion from pain medicine cannot be controlled; BQ-II item – if doctors have to deal with pain, they won’t concentrate on curing the disease; BQ-II item – pain medicine can harm your immune system; dose adherence) generating LCV scores with substantial percentage decreases compared to their associated risk factors. Consequently, not only was no predictive capability lost by categorization of these 17 variables, categorization provided substantial improvements in predictive capability in four cases.
describes the multiple risk-factor model for hospitalization adaptively generated considering the 21 risk factors provided in . Hospitalization was predicted by the combination of the five risk factors: 1) younger age, 2) lower health literacy, 3) strong-opioid use, 4) higher BQ-II rating that pain medicine can harm your immune system, and 5) inconsistent adherence.
Table 4 Multiple risk-factor model for hospitalization
The LCV score was 0.71116, which was a substantial improvement over the best individual risk-factor model, with a percentage decrease in the LCV score of 6.25%. The area under the ROC curve was 0.85, which is considered excellent discrimination.Citation36 The cross-validated accuracy was 83.2% (ie, with correct deleted prediction of 159 of 191 observed outcome values). Inconsistent adherence was the most important of these five risk factors in the sense that its removal from the model generated the largest percentage decrease in the LCV score.
describes the model for hospitalization adaptively generated considering the 21 risk factors provided in and their pairwise interactions. Hospitalization was predicted by the combination of the following six interaction risk factors (and no noninteraction risk factors): 1) strong-opioid use and inconsistent adherence; 2) employed at home part-time, unemployed, or other employment status and higher BQ-II rating that if doctors have to deal with pain, they won’t concentrate on curing the disease; 3) lower social support and higher BQ-II rating that using pain medicine can harm your immune system; 4) primary insurance Medicaid, other, Veterans Affairs, or none and higher BQ-II rating that pain medicine makes you say or do embarrassing things; 5) younger age and higher severity of analgesic side effects; and 6) lower health literacy and higher severity of analgesic side effects.
Table 5 Multiple pairwise risk-factor interaction model for hospitalization
The LCV score was 0.73603, which was a substantial improvement over the multiple risk-factors model, with a decrease in the LCV score of 3.38%. The area under the ROC curve was 0.91, which is considered exceptional discrimination.Citation36 The cross-validated accuracy was 85.9% (ie, with correct deleted prediction of 164 of 191 observed outcome values). The interaction of strong-opioid use and inconsistent adherence was the most important of these six interaction risk factors, with its removal from the model generating the largest percentage decrease in the LCV score.
To assess the possibility of collinearity among these six interactions, logistic regression models were computed, predicting each of these six interactions as a function of the other five. The largest Nagelkerke R2 value for these models was 10.8%, indicating that collinearity was not a problem for the six-interaction model.
Patients had zero to five of these interaction risk factors. Of the 34, 68, 53, 24, eight, and four patients with zero to five of these interaction risk factors, respectively, the percentage hospitalized was 0, 1.5%, 18.9%, 45.8%, 75.0%, and 100%, respectively. The hospitalization-risk index model based on the count of the number of these interaction risk factors as the only predictor of hospitalization had an LCV score of 0.74740, which provided a substantial improvement over the six-interaction model, with a decrease in the LCV score of 1.52%. The area under the ROC curve model was excellent, at 0.89. The cross-validated accuracy was 85.9% (ie, with correct deleted prediction of 164 of 191 observed outcome values). The estimated OR for hospitalization with a unit increase in the number of these risk factors a patient had was 5.44, with a 95% confidence interval of 3.09–9.58.
Risk factors for inconsistent adherence
A total of 146 (76.4%) patients with MEMS data had inconsistent adherence during study participation. contains the eleven individually significant risk factors for inconsistent adherence identified through adaptive modeling. Note that thresholds for risk factors are adaptively generated, and so the thresholds for inconsistent adherence in can be different from thresholds for hospitalization in , eg, the threshold for the risk factor based on age is 61 years in and 50 years in .
Table 6 Individually significant risk factors for inconsistent adherence
The strongest individually significant risk factor for predicting inconsistent adherence, generating the largest LCV score of 0.59129, was prescription of ATC analgesics other than long-acting opioids (LCV scores not reported in ). The cutoff for a substantial decrease in the LCV score was also 1%. The constant model for predicting inconsistent adherence had an LCV score of 0.57722 with a substantial decrease of 2.38% compared to the model based on prescription of ATC analgesics other than long-acting opioids. The constant model generated a substantial percentage decrease for eight (72.7%) of the eleven risk factors provided in , once again indicating the conservative nature of LCV-ratio tests in comparison to standard tests for zero slopes.
Of the eleven risk factors provided in , five were based on ordinal or continuous variables with no missing data. None of these variables generated better LCV scores than their associated risk factors. All five of these variables generated LCV scores with substantial percentage decreases compared to their associated risk factors. Consequently, not only was no predictive capability lost by categorization of these five variables, categorization provided substantial improvements in predictive capability in all five cases.
describes the multiple risk-factor model for predicting inconsistent adherence adaptively generated considering the eleven risk factors provided in . Inconsistent adherence was predicted by the combination of the two risk factors–younger age and prescription of ATC analgesics–other than long-acting opioids. The LCV score was 0.59857, which was a substantial improvement over the best individual risk-factor model, with percentage decrease in the LCV score of 1.22%. The area under the ROC curve was 0.69, just below good discrimination of 0.70.Citation36 The cross-validated accuracy was 73.3% (ie, with correct deleted prediction of 140 of 191 observed outcome values). Prescription of ATC analgesics other than long-acting opioids was the more important of these two risk factors, with its removal from the model generating the larger percentage decrease in the LCV score.
Table 7 Multiple risk-factor model for inconsistent adherence
describes the model for inconsistent adherence adaptively generated considering the eleven risk factors provided in and their pairwise interactions. Inconsistent adherence was predicted by the combination of the following three interaction risk factors and one noninteraction risk factor: 1) shorter duration of cancer pain and higher BQ-II rating that pain medicine is very addictive, 2) lower income and fewer days within last 30 days with physical health not good, 3) less education and younger age, and 4) prescription of nonopioids or weak opioids.
Table 8 Multiple risk-factor and pairwise interaction model for inconsistent adherence
The LCV score was 0.62541, which was a substantial improvement over the multiple risk-factor model, with a decrease in the LCV score of 4.29%. The area under the ROC curve was 0.77, which is considered good discrimination.Citation36 The cross-validated accuracy was 78.0% (ie, with correct deleted prediction of 149 of 191 observed outcome values). The interaction of shorter duration of cancer pain and higher BQ-II rating that pain medicine is very addictive was the most important of these four interaction and noninteraction risk factors, with its removal from the model generating the largest percentage decrease in the LCV score.
To assess the possibility of collinearity between these four risk factors, logistic regression models were computed predicting each of them as a function of the other three. The largest Nagelkerke R2 value for these models was 7.3%, indicating that collinearity was not a problem for the interaction and noninteraction risk-factor model.
Patients had zero to four of these interaction and noninter-action risk factors. Of the 61, 77, 35, 16, and two patients with zero to four of these risk factors, respectively, the percentage with inconsistent adherence was 57.4%, 80.5%, 88.6%, 100%, and 100%, respectively. The inconsistent-adherence risk-index model based on the count of the number of these risk factors as the only predictor of inconsistent adherence had an LCV score of 0.60890, but with a substantial percentage decrease over the four-interaction and noninteraction risk-factor model. The area under the ROC curve model was good, at 0.71. The cross-validated accuracy was 76.4% (ie, with correct deleted prediction of 146 of 191 observed outcome values). The estimated OR for inconsistent adherence with a unit increase in the number of these risk factors a patient had was 2.87, with 95% confidence interval of 1.75–4.73.
Discussion
While there have been several studies in the CNCP setting documenting an association between chronic opioid therapy and health care utilization and other adverse outcomes,Citation11,Citation14,Citation37–Citation41 patients with cancer pain have been largely exempt from these investigations.Citation40–Citation47 This is the first study to our knowledge that has demonstrated an association between prescribed analgesic adherence patterns and acute health care utilization among patients with cancer pain.
In this study, 17% of patients with cancer were hospitalized, which is considerable given the short 3-month duration of observation. Our main finding was that inconsistent adherence to prescribed ATC analgesics (as measured using MEMS) was the most powerful risk factor for hospitalization in both individual risk-factor models and multiple risk-factor models that adaptively considered other confounders of hospitalization, including pain severity and stage of cancer. In addition, we identified that younger age, lower health literacy, being prescribed a strong (WHO step 3) ATC opioid, and belief that pain medicine can harm the immune system were the other independent predictors of hospitalization in the multivariable model. When we considered relevant interactions, a combination of six interactions () provided substantial improvement in predictive capability compared to the multiple risk-factor model. Of note, there was a linear relationship between the number of interactions patients had and the risk of hospitalization. For instance, patients with no interactions were unlikely to be hospitalized, whereas 75%–100% of patients with four to five interactions, respectively, were hospitalized over the study period. The interaction of strong-opioid use and inconsistent adherence was the most important of the six interactions.
Consistent with studies in CNCP settings,Citation11,Citation14,Citation37–Citation41 our study found an association between prescription of strong opioids and health care utilization among cancer outpatients. Importantly, the interaction of strong-opioid use and inconsistent adherence was the most important risk factor for hospitalization. The available research suggests that inconsistent adherence may be a prevalent clinical problem in patients with cancer pain. In one study of self-reported adherence to long-acting opioids among patients with advanced lung cancer, more than one in four (28%) patients reported a medication frequency that did not match the frequency of their prescribed daily dose.Citation48 Patients who reported inaccurate frequency were also more likely to have lower reported adherence to the prescribed opioids.Citation48 The authors concluded that comprehending opioid regimens may be a critical clinical indicator of adherence to opioids.
It is important to note how our findings are different from those of health utilization in CNCP. Most studies in the CNCP setting have compared health care utilization outcomes of patients on chronic opioid treatment versus those who are not receiving opioid treatment.Citation14,Citation37,Citation38 This approach appears mainly due to the debate about the appropriateness of opioids for CNCP.Citation49 However, based on current guidelines, opioids are important for the treatment of moderate-to-severe cancer pain,Citation50 and are the only consistently available and reimbursed treatment in the absence of strong evidence on complementary and alternative treatments for cancer pain.Citation51
Patients with cancer pain may need to manage multiple-medication regimens, including multiple analgesics and coanalgesic prescriptions, making it difficult to comprehend medication regimens. The commonly used WHO guidelines provide no guidance to prescribers on multiple-opioid prescribing.Citation52 Consequently, patients with socioeconomic disadvantage, eg, those with lower education, income, health literacy, and poor health requiring multiple-medication management, may be at particular risk of inconsistent adherence. Indeed, in the present study, inconsistent adherence to opioids was predicted by lower education and income levels. Medication adherence literature has found household income of less than $20,000 and higher out-of-pocket cost of medications to be associated with adherence behaviors that include decreasing the frequency and dose of prescribed medications, avoiding refills or extending time between refills.Citation53–Citation56
In considering predictors of inconsistent adherence, prescription of an index analgesic other than long-acting opioids was the most important risk factor in the multiple risk-factor model. Consistently, in one of the few US studies employing objective measures to quantify analgesic adherence among cancer outpatients, we previously reported an overall dose adherence to ATC analgesics using MEMS to be only 65%.Citation23 However, on subanalysis, the adherence rate was better for strong opioids (69%) and specifically better for long-acting opioids (74%).Citation23 In another study of patients with advanced lung cancer, researchers reported an adherence rate for long-acting opioids of 85%; however, adherence in this study was monitored based on self-reported measures,Citation48 which tend to overestimate rates of adherence by 10%–30%.Citation57–Citation62
Of the risk factors of inconsistent adherence in the present study, the interaction of shorter duration of cancer pain and higher analgesic belief (BQ-II item – pain medicine is very addictive) was the most important. The role of opioid-related attitudes and barriers and consequent intentional nonadherence to analgesia for cancer pain have been widely established in previous studies to understand and improve cancer-pain outcomes.Citation16,Citation20,Citation63 However, a systematic reviewCitation64 and meta-analysisCitation65 showed that the available interventions to change opioid-related attitudes and barriers do not improve adherence to analgesia. Our findings suggest that patients relatively earlier in their cancer diagnosis may be more likely to benefit from educational interventions to modify opioid-related attitudes and barriers.
Importantly, understanding/framing of what should be considered opioid-related patient beliefs and barriers versus actual opioid-related clinical risks in the light of emerging literature in the cancer-pain setting should be clarified in these educational training programs. A 2014 National Institutes of Health Pathways to Prevention Conference (Role of Opioids in the Treatment of Chronic Pain) underscored the “scant” evidence to guide clinicians about the outcomes of long-term opioid therapy. Experts also discussed murky boundaries between chronic cancer and CNCP.Citation49 Improved survival rates for patients with cancer means that patients are living longer with multiple painful conditions due to cancer, its treatment, or both; there is increasing attention to early integration of pain and symptom management in the disease process for cancer patients, making it more likely for cancer patients to be on long-term opioid therapy.Citation66
Strengths and limitations
This is the only study to our knowledge that has identified an empirical typology of analgesic adherence for cancer pain using objective adherence measures and linked these different types to acute health care utilization. Our study was limited in several respects. Hospitalization was not the primary outcome in the parent study; the link between analgesic-use patterns and hospitalization was an incidental finding in our study. Since our primary outcome in the original study was not hospitalization, we did not collect comprehensive data on all potential confounders in explaining hospitalization outcomes. Also, the study period (3-month prospective design) did not allow adequate observation period for the range of health care-utilization outcomes to occur. We also did not quantify emergency department use or aberrant opioid-related behaviors. This latter outcome is also important, given the emerging literature about the aberrant opioid-related behaviors among cancer patients.Citation67 Furthermore, MEMS recordings do not guarantee ingestion of medications, and cap openings other than taking medications may result in inaccuracies in adherence monitoring (even though we accounted for cap openings for reasons other than taking prescribed medications, eg, for medication refills). Also, the route of opioid use has been found to be associated with health care utilization. In one study, when compared to oral opioids, transdermal opioids reduced health care utilization.Citation68 Due to the limitations of MEMS, we excluded patients receiving transdermal system only, which may have resulted in an underestimation of the levels of adherence in this study.
Conclusion and implications
Opioids carry risks to individuals and society that have traditionally been ignored in cancer patients.Citation67,Citation69,Citation70 Due to the extent that opioids are used in the cancer-pain setting, researchers have voiced concern about safe use of opioids in patients with cancer pain, including the need for routine opioid risk monitoring.Citation66,Citation67,Citation69,Citation70 While our study did not quantify aberrant opioid-related risks in cancer patients, we found six unique and vastly varied analgesic adherence types in this small sample of cancer outpatients. Studies in CNCP have shown that patients receiving opioid therapy experience greater health care utilization in almost all categories of use, including inpatient, outpatient emergency department, pharmacy, and physician services.Citation11,Citation14,Citation37–Citation41 In spite of this, cancer patients are almost invariably excluded from studies of chronic opioid-related outcomes.Citation40–Citation47 Nevertheless, consistent with the studies in noncancer settings, our study found an association between prescription of strong opioids and health care utilization among cancer outpatients. In effect, the interaction of strong-opioid use and inconsistent adherence was the most important risk factor for hospitalization in this study. This means that patient and clinician education to improve patterns of opioid adherence may be an important modifiable risk factor for decreasing unnecessary health care use. In the light of our preliminary data, there is also an acute need for more rigorous studies to clarify the role of patterns of opioid adherence in clinical and health service outcomes in patients with cancer pain.
Acknowledgments
This work was supported by an NIH Challenge Grant to Dr Salimah H Meghani (NIH/NINR RC1-NR011591). The authors gratefully acknowledge the assistance of Andrew J Robinson and Megan Patey with preparation of the data for analysis.
Disclosure
The authors report no conflicts of interest in this work.
References
- Institute of MedicineDelivering High-Quality Cancer Care: Charting a New Course for a System in CrisisWashingtonIOM2013
- CourtneyDMAldeenAZGormanSMCancer-associated neutropenic fever: clinical outcome and economic costs of emergency department careOncologist20071281019102617766662
- GeraciJMTsangWValdresRVEscalanteCPProgressive disease in patients with cancer presenting to an emergency room with acute symptoms predicts short-term mortalitySupport Care Cancer200614101038104516572312
- PerroneJHollanderJEDatnerEMEmergency department evaluation of patients with fever and chemotherapy-induced neutropeniaJ Emerg Med200427211511915261351
- SwensonKKRoseMARitzLMurrayCLAdlisSARecognition and evaluation of oncology-related symptoms in the emergency departmentAnn Emerg Med199526112177793714
- FortnerBVOkonTAPortenoyRKA survey of pain-related hospitalizations, emergency department visits, and physician office visits reported by cancer patients with and without history of breakthrough painJ Pain200231384414622852
- RichardsonDPDalyCSutradharRHospitalization rates among survivors of young adult malignanciesJ Clin Oncol201533242655265926169617
- MayerDKTraversDWyssALeakAWallerAWhy do patients with cancer visit emergency departments? Results of a 2008 population study in North CarolinaJ Clin Oncol201129192683268821606431
- WilliamsRESampsonTJKalilaniLWurzelmannJIJanningSWEpidemiology of opioid pharmacy claims in the United StatesJ Opioid Manag20084314515218717509
- Medicare Payment Advisory CommissionReport to the Congress: Medicare and the Health Care Delivery SystemWashingtonMedPAC2015
- LeiderHLDhaliwalJDavisEJKulakodluMBuikemaARHealthcare costs and nonadherence among chronic opioid usersAm J Manag Care2011171324021348566
- VogtMTKwohCKCopeDKOsialTACulybaMStarzTWAnalgesic usage for low back pain: impact on health care costs and service useSpine (Phila Pa 1986)200530910751081
- VolinnEFargoJDFinePGOpioid therapy for nonspecific low back pain and the outcome of chronic work lossPain2009142319420119181448
- XieLJoshiAVSchaafDDifferences in healthcare utilization and associated costs between patients prescribed vs. nonprescribed opioids during an inpatient or emergency department visitPain Pract201414544645623809064
- MeghaniSHHouldinADThe meanings of and attitudes about cancer pain among African AmericansOncol Nurs Forum20073461179118618024344
- GunnarsdottirSDonovanHSSerlinRCVogeCWardSPatient-related barriers to pain management: the Barriers Questionnaire II (BQ-II)Pain200299338539612406513
- MeghaniSHKeaneAPreference for analgesic treatment for cancer pain among African AmericansJ Pain Symptom Manage200734213614717531436
- WardSDonovanHSOwenBGrosenESerlinRAn individualized intervention to overcome patient-related barriers to pain management in women with gynecologic cancersRes Nurs Health200023539340511052393
- WardSECarlson-DakesKHughesSHKwekkeboomKLDonovanHSThe impact on quality of life of patient-related barriers to pain managementRes Nurs Health19982154054139761138
- WardSEGoldbergNMiller-McCauleyVPatient-related barriers to management of cancer painPain19935233193247681557
- WardSEWangKKSerlinRCPetersonSLMurrayMEA randomized trial of a tailored barriers intervention for Cancer Information Service (CIS) callers in painPain20091441–2495619406576
- ValebergBTMiaskowskiCHanestadBRBjordalKMoumTRustøenTPrevalence rates for and predictors of self-reported adherence of oncology outpatients with analgesic medicationsClin J Pain200824762763618716502
- MeghaniSHThompsonAMChittamsJBrunerDWRiegelBAdherence to analgesics for cancer pain: a comparative study of African Americans and whites using an electronic monitoring deviceJ Pain201516982583526080042
- TzengJIChangCCChangHJLinCCAssessing analgesic regimen adherence with the Morisky Medication Adherence Measure for Taiwanese patients with cancer painJ Pain Symptom Manage200836215716618411015
- MeghaniSHChittamsJHanlonALCurryJMeasuring preferences for analgesic treatment for cancer pain: how do African-Americans and Whites perform on choice-based conjoint (CBC) analysis experiments?BMC Med Inform Decis Mak20131311824134426
- MeghaniSHThompsonAMChittamsJBrunerDWRiegelBAdherence to analgesics for cancer pain: a comparative study of African Americans and whites using an electronic monitoring deviceJ Pain201516982583526080042
- World Health OrganizationCancer Pain Relief and Palliative CareGenevaWHO1996
- World Health OrganizationCancer Pain ReliefGenevaWHO1986
- CleelandCSRyanKMPain assessment: global use of the Brief Pain InventoryAnn Acad Med Singapore19942321291388080219
- MoriskyDEGreenLWLevineDMConcurrent and predictive validity of a self-reported measure of medication adherenceMed Care19862467743945130
- SarasonIGLevineHMBashamRBSarasonBRAssessing social support: the Social Support QuestionnaireJ Pers Soc Psychol1983441127139
- ChewLDBradleyKABoykoEJBrief questions to identify patients with inadequate health literacyFam Med200436858859415343421
- CharlsonMEPompeiPAlesKLMacKenzieCRA new method of classifying prognostic comorbidity in longitudinal studies: development and validationJ Chronic Dis19874053733833558716
- KnaflGJDelucchiKLBovaCAFennieKPDingKWilliamsABA systematic approach for analyzing electronically monitored adherence dataEkwallBCronquistMMicro Electro Mechanical Systems (MEMS) Technology, Fabrication Processes and ApplicationsHauppauge, NYNova Science Publishers2010166
- McCullaghPNelderJAGeneralized Linear Models2nd edBoca Raton (FL)Chapman & Hall1999
- HosmerDWLemeshowSApplied Logistic Regression2nd edNew YorkJohn Wiley & Sons2000
- DeyoRASmithDHJohnsonESOpioids for back pain patients: primary care prescribing patterns and use of servicesJ Am Board Fam Med201124671772722086815
- KoeppeJLydaKArmonCAssociation between opioid use and health care utilization as measured by emergency room visits and hospitalizations among persons living with HIVClin J Pain2013291195796123370078
- ZedlerBXieLWangLDevelopment of a risk index for serious prescription opioid-induced respiratory depression or overdose in Veterans’ Health Administration patientsPain Med20151681566157926077738
- KernDMZhouSChavoshiSTreatment patterns, healthcare utilization, and costs of chronic opioid treatment for non-cancer pain in the United StatesAm J Manag Care2015213e222e23426014310
- BaserOXieLMardekianJSchaafDWangLJoshiAVPrevalence of diagnosed opioid abuse and its economic burden in the Veterans Health AdministrationPain Pract201414543744523809020
- BradenJBRussoJFanMYEmergency department visits among recipients of chronic opioid therapyArch Intern Med2010170161425143220837827
- SjøgrenPGrønbaekMPeuckmannVEkholmOA population-based cohort study on chronic pain: the role of opioidsClin J Pain201026976376920842015
- JensenMKThomsenABHøjstedJ10-Year follow-up of chronic non-malignant pain patients: opioid use, health related quality of life and health care utilizationEur J Pain200610542343316054407
- SehgalNColsonJSmithHSChronic pain treatment with opioid analgesics: benefits versus harms of long-term therapyExpert Rev Neurother201313111201122024175722
- DunnKMSaundersKWRutterCMOpioid prescriptions for chronic pain and overdose: a cohort studyAnn Intern Med20101522859220083827
- LiuYLoganJEPaulozziLJZhangKJonesCMPotential misuse and inappropriate prescription practices involving opioid analgesicsAm J Manag Care201319864866524304213
- YoongJTraegerLNGallagherERPirlWFGreerJATemelJSA pilot study to investigate adherence to long-acting opioids among patients with advanced lung cancerJ Palliat Med201316439139623445248
- National Institutes of HealthPathways to Prevention Workshop: September 29–30, 2014 – The Role of Opioids in the Treatment of Chronic Pain2014 Available from: https://prevention.nih.gov/docs/programs/p2p/ODPPainPanelStatementFinal_10-02-14.pdfAccessed July 31, 2015
- National Comprehensive Cancer NetworkAdult Cancer Pain (Version 2). NCCN Clinical Practice Guidelines in Oncology2015 Available from: http://www.nccn.orgAccessed August 25, 2015
- BardiaABartonDLProkopLJBauerBAMoynihanTJEfficacy of complementary and alternative medicine therapies in relieving cancer pain: a systematic reviewJ Clin Oncol200624345457546417135649
- GaoWGullifordMBennettMIMurtaghFEHigginsonIJManaging cancer pain at the end of life with multiple strong opioids: a population-based retrospective cohort study in primary carePloS One201491e7926624475016
- WagnerTHHeislerMPietteJDPrescription drug co-payments and cost-related medication underuseHealth Econ Policy Law20083Pt 1516718634632
- PietteJDHeislerMWagnerTHCost-related medication underuse: do patients with chronic illnesses tell their doctors?Arch Intern Med2004164161749175515364667
- PietteJDHeislerMWagnerTHCost-related medication underuse among chronically ill adults: the treatments people forgo, how often, and who is at riskAm J Public Health200494101782178715451750
- HeislerMWagnerTHPietteJDPatient strategies to cope with high prescription medication costs: who is cutting back on necessities, increasing debt, or underusing medications?J Behav Med2005281435115887875
- DanielsTGoodacreLSuttonCPollardKConwaySPeckhamDAccurate assessment of adherence: self-report and clinician report vs electronic monitoring of nebulizersChest2011140242543221330381
- ZellerARamseierETeagtmeyerABattegayEPatients’ self-reported adherence to cardiovascular medication using electronic monitors as comparatorsHypertens Res200831112037204319098375
- ArnstenJHDemasPAFarzadeganHAntiretroviral therapy adherence and viral suppression in HIV-infected drug users: comparison of self-report and electronic monitoringClin Infect Dis20013381417142311550118
- ChungKFNayaICompliance with an oral asthma medication: a pilot study using an electronic monitoring deviceRespir Med200094985285811001076
- HamiltonGAMeasuring adherence in a hypertension clinical trialEur J Cardiovasc Nurs20032321922814622630
- LaFleurJOderdaGMMethods to measure patient compliance with medication regimensJ Pain Palliat Care Pharmacother2004183818715364635
- MeghaniSHBrunerDWA pilot study to identify correlates of intentional versus unintentional nonadherence to analgesic treatment for cancer painPain Manag Nurs2013142e22e3023688368
- OldenmengerWHSillevis SmittPAvan DoorenSStoterGvan der RijtCCA systematic review on barriers hindering adequate cancer pain management and interventions to reduce them: a critical appraisalEur J Cancer20094581370138019201599
- BennettMIBagnallAMJosé ClossSHow effective are patient-based educational interventions in the management of cancer pain? Systematic review and meta-analysisPain2009143319219919285376
- GudinJRisk evaluation and mitigation strategies (REMS) for extended-release and long-acting opioid analgesics: considerations for palliative care practiceJ Pain Palliat Care Pharmacother201226213614322764852
- AnghelescuDLEhrentrautJHFaughnanLGOpioid misuse and abuse: risk assessment and management in patients with cancer painJ Natl Compr Canc Netw20131181023103123946178
- HenshawJSDo transdermal opioids reduce healthcare use in an Australian rural pain population? A comparison with oral opioidsJ Opioid Manag20117213514421561037
- KoyyalaguntaDBrueraEAignerCNusratHDriverLNovyDRisk stratification of opioid misuse among patients with cancer pain using the SOAPP-SFPain Med201314566767523631401
- MaJDHortonJMHwangMAtayeeRSRoelandEJA single-center, retrospective analysis evaluating the utilization of the opioid risk tool in opioid-treated cancer patientsJ Pain Palliat Care Pharmacother20142814924417217