Abstract
The Academic Motivation Scale (AMS), supported in Self-Determination Theory, has been applied in recent decades as well in high school as in college education. Although several versions in Spanish are available, the underlying linguistic and cultural differences raise important issues when they are applied to Latin-American population. Consequently an adapted version of the AMS was developed, and its construct validity was analyzed in Argentine students. Results obtained on a sample that included 723 students from Buenos Aires (393 high school and 330 college students) verified adequate psychometric properties in this new version, solving some controversies regarded to its dimensionality.
Introduction
One of the most studied topics in educational psychology is academic motivation. Its direct and indirect influence on learning processes has been proven in numerous investigations.Citation1–Citation4 On one hand, it has been linked to the effort and persistence invested in the depth of information processing and to the use of self-regulated cognitive and metacognitive strategies.Citation5 On the other hand, its close association with self-efficacy perception, goal establishment, and generation of achievement expectations has been pointed out repeatedly.Citation6,Citation7 Previous investigations have remarked on how motivation modulates valorization of assigned tasks and marks the pertinence of using external rewards.Citation8,Citation9 As well as that, it has been suggested that low achievement, desertion, and difficulties in the transition between educational levels are often evidence of problems that, in order to design palliative interventions, may be targeted from a motivational perspective.Citation10,Citation11
As a consequence of its complexity and its central role in the educational milieu, the need for the development of instruments capable of providing researchers and professionals valid and reliable measures of this construct has been stressed.Citation12 Most of the scales have been based on different conceptual proposals. The corpus that was used to give shape to a good amount of the research in this field is the self-determination theory, which has its origin in the work of Deci and Ryan.Citation13 This is a macrotheory related to human development and the function of personality in different social contexts. It considers that motivation can be expressed through a continuum of increasing self-determination with three fundamental positions reflecting the degree of autonomy on which behaviors are based: amotivation and extrinsic and intrinsic motivation ().
Figure 1 Self-determination continuum based on Deci and RyanCitation13 and Vallerand et al.Citation14
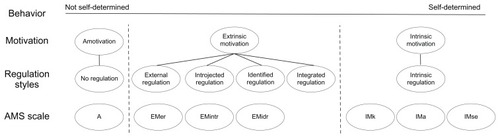
Amotivation represents the nonregulated extreme of the continuum, and it is characterized by the individual’s perception of lack of control over events, incompetence and absence of purpose. In extrinsic motivation (EM), which is situated in the midpoint of the mentioned continuum, the goal being chased constitutes the main driving force of behavior, which is divided into four subtypes of progressive regulation: external, introjected, identified, and integrated. In the first of them, behaviors are enforced by others and are carried out to avoid punishment or to obtain rewards. In introjected regulation, behaviors are executed in order to improve one’s self-esteem or to avoid anxiety and guilt that may arise for not carrying them out. In identified regulation, the individual chooses the activities by extrinsic motives (eg, society values enrolling in superior studies). The last subtype (integrated regulation) would appear only in adulthood, when individual needs and values converge with those expected by the social context (eg, studying broadens one’s horizons). Finally, intrinsic motivation (IM) occupies the autonomous regulation pole where the pleasure of executing behaviors by own choice prevails: activities become a goal themselves.
Years later, Vallerand et alCitation14 expanded this initial description introducing a new division of three subtypes of IM referred to in the academic milieu: orientation towards knowledge (the task is carried out for the pleasure of learning), orientation towards achievement (satisfaction emerges when products are generated or when one’s own limits are overcome), and orientation towards stimulating experiences (it involves activities developed to perceive comforting aesthetics, intellectual or sensorial sensations) ().Citation14
In regard of its assessment, the Academic Motivation Scale (AMS) is one of the most used instruments.Citation14 Aimed at adolescents and adults in academic environments, its original French and English versions have 28 items distributed in seven subscales that respond to the dimensions referenced in self-determination theory. The subtype titled EM-integrated regulation is an exception which was excluded as it appears later in adult life. The seven-factor structure, postulated in the initial theoretical model from Vallerand et al, was verified by subsequent confirmatory analyses and showed adequate internal consistency.Citation14,Citation15 Research carried out in Spain, the United States of America, Greece, and Paraguay focused mostly on college students and found a better statistic fit for this seven-factor model in contrast with five-, three-, and one-factor solutions.Citation16–Citation21 The five-factor structure corresponds with the original proposal from Deci and Ryan.Citation13 The three-factor model was added to confirm if MI and ME dimensions could be grouped. Finally, unidimensionality was tested as the simplest alternative.
The use of the AMS has allowed researchers to distinguish relevant associations between motivation and academic variables. This way, for example, students who showed a greater self-determination level also achieved higher quality learning with a better academic record, showed more interest in class, a greater perceived competence and, as a general rule, better attendance at school.Citation22–Citation25
The existing literature describes an instrument with remarkable theoretical and psychometric strength that permits a valid and reliable assessment of the construct. However, cultural differences inherent to diverse populations over which it was expected to be used, as well as contextual dissimilarities between educational levels, warn about the need to review the wording or interpretation of some of its items before using them. Núñez et al, for example, revealed problems in the use of Spanish in Latin America, verifying regional semantic connotations associated to some terms.Citation20 These difficulties end up affecting the psychometric functioning in terms of its factor structure and internal consistency.
The present research was stimulated by the significant interest that the assessment of motivation has in the educational milieu and the need to have adapted and validated versions of the AMS available in different countries and cultural contexts. Therefore, we attempted to validate empirically two versions of the scale for its use with Argentine high school and college students. The main goal is to make two versions of the AMS available for researchers and professionals, which will guarantee the reliability and validity standards usually required for all measures. In a complementary manner, and following previous research, the psychometric analysis of the goodness of fit of one-, three-, five-, and seven-factor models will give even more empirical evidence about the dimensionality of the construct.
Methods
Participants
The sample was composed of 723 students of public and private institutions in Buenos Aires who were of middle socioeconomic status. Even though sampling was not randomized, the distribution by sex and age reflected the proportions referred by the Argentine Educational Ministry.Citation26 The high school group was composed of 393 students (64.9% female; 35.1% male; aged between 13 and 19 years; mean [M] = 15.24; standard deviation [SD] = 1.60). The college group was composed of 330 individuals (68.1% female; 31.9% male; aged between 17 and 35 years; M = 23.45; SD = 4.47). In order to gain the maximum possible representation, students of different schools were included (psychology, medicine, veterinary, engineering, chemistry, and literature departments), also considering the official data of percentage of students in each career.
Instruments and procedure
A version of the AMS into Spanish for Argentine subjects was used for data recollection.Citation14
Data were gathered by collective administration of the AMS scale in the classrooms of each institution. Students or the parents of underage participants signed informed consent statements. Students were not paid for their participation in the study. Anonymity and data confidential treatment were guaranteed at all times. An Institutional Ethics Committee of the University of Buenos Aires, Psychology Department, backed up the current research with a corresponding written report which was in concordance of the Declaration of Helsinki.
Data analysis
Expert judgment was analyzed by the calculation of Aiken indexes. Descriptive statistics (M, SDs, skewedness, and kurtosis indexes) were calculated in order to study item distribution at a univariate level. When assessing multivariate normality, Mardia’s coefficient was examined. A confirmatory factor analysis was conducted to study the factorial structure of the scale. Given the nonnormality of data, unweighted least squares (ULS) was the chosen method. In a complementary manner, a bootstrap procedure using 500 random samples was applied to attempt to guarantee stability in the results. Finally, Cronbach’s alphas as well as Elosúa and Zumbo’s ordinal version of the Cronbach’s alpha were estimated to inform factor consistency.Citation27 To empirically calibrate the suitability of the use of each specific version, differentiated analyses for each group or academic level were completed. Analyses were carried out by PASW Statistic (v 18.00; SPSS Inc, Chicago, IL) and AMOS (v 18.0; SPSS Inc).
Results
Content analysis
A back-translation of the English version of the AMS was made to achieve an adequate adaptation of the original scale to the context and linguistic peculiarities of the Spanish spoken in Argentina. This task considered the contents of both French and Spanish versions. Given that the original English and French versions were aimed at college students, items were adapted to high school students (eg, I can’t understand what am I doing in college became I can’t understand what am I doing in school). Versions for each educational level were obtained.
Following the work of Núñez et al, emphasis was placed on studying the content of each element at different stages.Citation20 A pilot study was conducted with 25 college and 15 high school students. Results showed that some terms, such as pleasure and satisfaction, triggered interpretations unrelated to the academic environment. As a consequence of this finding, the terms were replaced by terms with neutral connotations (eg, Because I enjoy learning new things was used instead of For the pleasure and the satisfaction I experience while I learn new things). The seven-point Likert scale was reduced to a four-point one (1, strongly disagree; 2, disagree; 3, agree; and 4, strongly agree) that was more intuitive for our students and provided semantic anchorage points that considerably facilitated their response.
Then, five experts in psychometrics and educational psychology gave their individual judgments, which promoted additional modifications of some items and subscales. It was pointed out that EM-introjected regulation only contemplated items that referred to the ego. Their advice resulted in the substitution of two items on guilty feelings (eg, going to college so as not to disappoint their family), which favored a more complete operationalization of the underlying dimension.
In the same way, it was suggested that IM-stimulating experiences included only activities of learning through reading. Considering this observation, one of the original items was replaced by another one referring to practical tasks (eg, conducting an activity related to a future profession). This way, the instrument could account for the diversity of activities according to the student’s planned career after graduation. Finally, 28 items had Aiken coefficients equal or higher than 0.80, which ensured content validity of both specific versions for each educational level.
Construct validity
In addition to their means and standard deviations, standardized values of skewedness and kurtosis of each item were analyzed. and show that most items had values over ±1.96. On a multivariate level, kurtosis values above 5.99 were found in both groups (critical ratio high-school [CRHS] = 32.914; critical ratio college [CRC] = 89.078). Therefore, the null hypothesis of normal distribution was rejected in both uni0 and multivariate analyses. As a consequence, the method of choice for the factorial study was ULS since, according to experts, this method does not have any assumptions about the distribution, is more robust in small samples, and is recommended for ordinal variables.Citation28,Citation29
Table 1 Item analysis and descriptive statistics of the high school sample
Table 2 Item analysis and descriptive statistics of the college sample
Other researchers analyzed one-, three-, five-, and seven-factor models for their goodness-of-fit.Citation16–Citation18,Citation21 Following Byrne and Kline, on the assessment of global fit, different indexes were considered simultaneously ().Citation30,Citation31
Table 3 Goodness-of-fit indexes obtained by ULS
The Goodness-of-Fit Index (GFI) estimates the error committed when reproducing the variance and covariance matrix. The Adjusted Goodness-of-Fit Index (AGFI) differs in that it adjusts considering the degrees of freedom of the specified model. The Normal Fit Index (NFI) and Relative Fit Index (RFI) compare the hypothesized model with the null model. They provide a complete measure of data variation. All of these indexes must show values over 0.90 to confirm the model. Root mean square residual (RMR) represents an average of the residual values resulting from the fitting of the variance– covariance matrix with the variance–covariance matrix of the hypothesized model. Values under 0.05 are acceptable.
GFI and AGFI showed values over 0.90 for models of seven-, five-, and three-factors in both groups, being always higher in the seven-factor model. RFI and NFI showed values higher than 0.90 in both groups just for the seven-factor model. Finally, RMR reached acceptable values for the seven- and five-factor models, with better values for the seven-factor model.
Model respecification
After examining the parameters of the seven-factor model, item 27 (EM-external regulation subscale) was left out because its factorial weight was nonsignificant in both groups and this affected internal consistency. Also, some correlations between latent variables were nonsignificant, especially in the college student group. The respecification of the model by eliminating item 27 resulted in a considerable increase of goodness of fit. In the high school student group, the GFI was 0.973, AGFI was 0.967, NFI was 0.961, RFI was 0.955, and RMR was 0.051. In the college student group, GFI was 0.955, AGFI was 0.944, NFI was 0.923, RFI was 0.911, and RMR was 0.046. A complementary analysis using maximum likelihood estimation was carried out to obtain χ2 values. This allowed a comparison of model 1 (28 items) with model 2 (27 items). Despite the fact that the χ2 estimation is still significant, an important decrease in the value of the estimation occurs in the high school student group (Model 1: χ2 = 769.1; df = 329; Model 2: χ2 = 669; gl = 303; Δχ2 = 100.1; P < 0.001) and the college student group (Model 1: χ2 = 791.1; gl = 329; Model 2: χ2 = 680; gl = 303; Δχ2 = 110.3; P < 0.001). Model 2 (27-item version) was chosen as the best alternative.
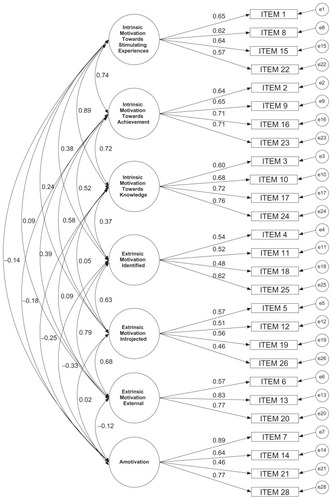
and contain the λ and ϕ parameters obtained by bootstrap, with mean values and confidence intervals of 90%. All parameters were significant, with factorial weights mostly between 0.60 and 0.70. In the college student group, Item 21 (Amotivation scale) had a lower factorial weight, but it was not discarded in order to obtain similar scales for both groups by contemplating specific item contents, but also ensuring specificity by educational level. The calculated corrected homogeneity indexes for each dimension had acceptable values (between 0.30 and 0.71) ( and ).
Table 4 Standardized factorial weights obtained by bootstrap
Table 5 Correlations between factors obtained by bootstrap
As for the correlations between factors, in most cases the values estimated resulted significant (especially in the high school student group). The highest indexes were found between the dimensions located closer in the self-determination continuum, as this theory established (especially in the three IM dimensions). The lowest were found between the most remote dimensions (IM-stimulating experiences and amotivation). Higher correlations were found in the scales of IM in comparison to those of EM. Between EM-identified regulation (EMidr) and EM-external regulation (EMer) strongest correlations were verified, compared to EM-introjected regulation (EMintr), which is located in the theoretical continuum between these two ( and ).
Figure 2 High school sample: estimated parameters.
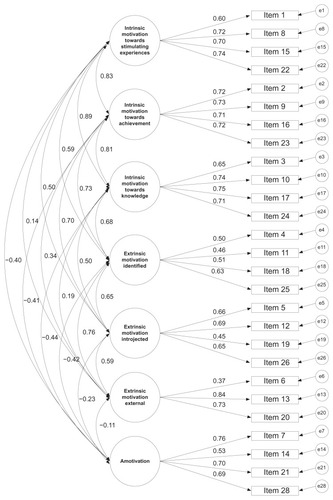
Figure 3 College sample: estimated parameters.
Consistency of the factors
Cronbach’s alpha values ranged between 0.60 and 0.81 (). Though ordinal alphas showed indexes practically identical (between 0.59 and 0.82), they were in general a bit higher in all dimensions.
Table 6 Internal consistency for dimensions
Motivational differences between educational levels
Finally, differences with statistical significance were found in the high school and college student groups in all subscales, using t-tests. While high school students had higher averages in the EM and amotivation subscales, college students obtained higher scores in IM subscales ().
Table 7 Differences in motivational types according to educational level
Discussion
Supported by self-determination theory, the AMS probably constitutes the most used instrument for the assessment of student motivation.Citation14 It has been used in many countries and versions in different languages are available. Despite this, in Latin America, cultural and linguistic differences often entail serious problems for comprehension and interpretation of some items. These difficulties affect the scale’s psychometric strengths directly. The experience of applying the scale in the context of high school and college education in Argentina shows the need for increased efforts in developing specific versions for this country.
Following the recommendations by Núñez et al on the convenience of reviewing AMS elements in a Latin American context, a pilot study and an examination by expert judges were performed,Citation20 which resulted in a reformulation of some items and a review of the type of responses used. These tasks were executed with the intention of obtaining two versions of the AMS with similar contents, but adapted to the situational conditions for high school and college educational levels, taking into account local linguistic peculiarities (Appendices 1 and 2).
Psychometric analyses verified acceptable qualities for the instrument in both cases. Internal consistency values were very similar to previous versions where EMidr presented lower alphas.Citation16–Citation20 As Cokley et al and Núñez et al proposed, this is possibly due to the fact that this EM subscale is most proximate to IM, something that could lead to some overlapping between them.Citation17,Citation20
From a perspective of the factorial structure of the scale, as found by Barkoukis et al, Cokley et al, Fairchild et al, and Núñez et al, a better fit for the seven-factor model was observed. A more detailed examination indicated an even better fit when leaving out an item (Item 27).Citation16–Citation18,Citation21
An element of discussion arises in the relations within the dimensions that compose the scale. The present investigation has found that, in general, the highest correlations occur between the closest dimensions in the self-determination continuum, as proposed theoretically.Citation15–Citation20 In addition to this, it seems logical that, in contrast to EM subscales, IM orientations showed higher correlation coefficients since their origin is internal and, consequently, more homogenous. More diversity is expected to be found in EM regulations since they come from external sources.
Nevertheless, some important theoretical deviations, as have been reported for the Spanish and Paraguayan versions, were found. EMidr correlated higher with EMer than with EMintr despite not being proximal in the theoretical continuum.Citation19,Citation20 A possible explanation is the one offered by Cokley et al, who pointed out that the division between EM and IM would be less sharp than the one originally postulated by Deci and Ryan.Citation13,Citation17
When examining profile differences between the high school and college student groups, it was found that college students showed a strong intrinsic prevalence (IM), while the younger students had higher averages in the EM and Amotivation subscales. This is coherent with the educational system characteristics, taking into account that in Argentina high school is mandatory and college studies are of personal choice. These results are consistent with those of other investigations.Citation32 Ratelle et al also found that college students appeared to be predominantly regulated in an autonomous manner, but the motivational profiles of high school students combined different degrees of IM and EM.Citation24
As for this study limitation, it is clear that the availability of a major sample would grant strength to the obtained results, especially when contemplating the generalization of the factorial structure found. The use of the ULS method and a bootstrap procedure attempted to counterbalance this sampling limitation and the lack of normality observed in the data distribution. Either way, results remain coherent with those in the literature.Citation16–Citation21
Conclusions
The present investigation was planned with the intention of solving a clear problem of application and providing a measure for assessing motivation in the academic milieu that met required psychometric properties. In spite of the abundant existing literature about self-determination theory and the numerous studies centered in the AMS, researchers have not discussed the convenience of having versions of the scale properly adapted and validated from a linguistic and contextual point of view. In this sense, the Argentine case does not constitute an exception. This empirical work and these psychometric results make available two versions of the scale to be used with high school and college students to Argentine researchers. Furthermore, one of the values of this study is the validation of a version for high school students, a population with fewer precedents than the college student group.Citation16,Citation21
It is known that adapted scales provide psychometric quality, but restrict comparisons between populations since they are assessed by different measures. This aspect constitutes a limitation for comparative research and implies an advance in terms of operationalization of the construct in specific contexts. Far from stating parallelism or equivalence, an aspiration that exceeds the goals pursued here, achieving similar versions comparable in terms of content and applicable to high school and college student groups, is a concrete step forward for research and classroom evaluations. Adapted scales underlines its utility for descriptive studies in local populations, in developmental research, and studies of intervention efficacy. The possible use in individual or institutional monitoring is highlighted. This is important because motivation is associated with academic achievement and psychological adjustment.Citation22–Citation24,Citation32
However, future investigations should aim to improve these contributions by adding evidence of convergent validity and inquiring into the comparability of the versions.
Disclosures
The present investigation has been carried out with endorsement of Buenos Aires University (UBA) and the National Council of Scientific and Technical Research (CONICET). The authors report no conflicts of interest in this work.
References
- CôtéJELevineCGAttitude versus aptitude: Is intelligence or motivation more important for positive higher-educational outcomes?J Adolesc Res20001515880
- MiñanoPGilarRCastejónJLUn modelo estructural de variables cognitivo motivacionales explicativas del rendimiento académico en lengua española y matemáticas. [An structural model of motivational cognitive variables that explain academic achievement in Spanish language and mathematics.]Anales de Psicología20122814554
- MurphyPKAlexanderPAA motivated exploration of motivation terminologyContemp Educ Psychol20002535310620380
- PintrichPRDe GrootEVMotivational and self-regulated learning components of academic performanceJ Educ Psychol19908213240
- PintrichPRThe role of goal orientation in self-regulated learningBoekaertsMPintrichPRZeidnerMHandbook of Self- RegulationSan Diego, CAAcademic Press2000452502
- GilPBernarasEElizaldeLMArrietaMEstrategias de aprendizaje y patrones de motivación del alumnado de cuatro titulaciones del campus de Gipuzkoa. [Learning strategies and motivational patterns of students of four career in the Gipuzkoa campus.]Infancia y Aprendizaje2009323329341
- Torrano MontalvoFGonzález TorresMCEl aprendizaje autorregulado: Presente y futuro de la investigación. [Self-regulated learning: Present and future of research.]Rev Electrón Investig Psicoeduc200421134
- SalimSRMotivaciones, enfoques y estrategias de aprendizaje en estudiantes de Bioquímica de una universidad pública Argentina. [Motivations, approaches and strategies for learning in students of a university biochemistry at Argentina.]Rev Electróne Investig Educ200681116
- UrielFCarrerasMAOngaratoPStoverJFernández LiporaceMEstrategias de estudio y aprendizaje en estudiantes de nivel medio y universitario. [Study and learning strategies in high school and college students.]Acta Psiquiátr Psicol Am Lat2011573178188
- OliverMCEimerGABálsamoNFCrivelloMEPermanecia y abandono en química general en las carreras de ingeniería de la Universidad Tecnológica Nacional-Facultad Regional Córdoba (UTN-FRC), Argentina. [Permanence and neglect in general chemistry in the engineering of the National Technological University, Cordoba Regional Faculty.]Avances en Ciencia e Ingeniería201122117129
- VázquezSMRendimiento académico y patrones de aprendizaje en estudiantes de ingeniería. [Academic performance and learning patterns in engineering students.]Ingeniería y Universidad2009131105136
- BarcaAPortoAMSantorumRBarcaEDeterminantes motivacionales y aprendizaje en el alumnado de educación secundaria con alto y bajo rendimiento académico. Un análisis desde la diversidad. [Motivational determinants and learning in high school students with high and low academic achievement: an analysis of the diversity.]Barca LozanoAMotivación y Aprendizaje en Contextos EducativosGranada, SpainGrupo Editorial Universitario200959106
- DeciELRyanRMIntrinsic Motivation and Self-determination in Human BehaviorNew York, NYPlenum Press1985
- VallerandRJBlaisMRBriereNMPelletierLGConstruction et validation de l’Echelle de Motivation en Éducation (EME). [Construction and validation of the Ëchelle de Motivation en Éducation (EME).]Can J Behav Sci199821323349
- VallerandRJPelletierLGBlaisMRBriereNMSenécalCVallierèsEFThe Academic Motivation Scale: a measure of intrinsic, extrinsic, and amotivation in educationEduc Psychol Meas19925210031017
- BarkoukisVTsorbatzoudisHGrouiosGSideridisGThe assessment of intrinsic and extrinsic motivation and amotivation: Validity and reliability of the Greek version of the academic motivation scaleAssessment in Education: Principles, Policy and Practice20081513955
- CokleyKOBernardNCunninghamDMotoikeJA psychometric investigation of the academic motivation scale using a United States sampleMeasurement and Evaluation in Counseling and Development200134109119
- FairchildAJHorstSJFinneySJBarronKEEvaluating existing and new validity evidence for the Academic Motivation ScaleContemp Educ Psychol2005303331358
- NúñezJLMartín-AlboJNavarroJGValidación de la versión española de la Ëchelle de Motivation en ÉducationPsicothema2005172334349
- NúñezJLMartín-AlboJNavarroJGGrijalvoFValidación de la Escala de Motivación Educativa (EME) en Paraguay. [Validation of the Spanish Version of the Ëchelle de Motivation en Éducation.]Interam J Psychol2006402185192
- NuñezJLMartín-AlboJNavarroJGSuárezZAdaptación y validación de la versión española de la Escala de Motivación Educativa en estudiantes de educación secundaria postobligatoria. [Adaptation and validation of the Spanish version of the Academic Motivation Scale in high school students.]Estudios de Psicología201031189100
- AhmedWBruinsmaMAStructural model of self-concept, autonomous motivation and academic performance in cross-cultural perspectiveRev Electron Investig Psicoeduc Psigopedag200643551576
- LegaultLGreen DemersIPelletierLWhy do high school students lack motivation in the classroom? Toward an understanding of amotivation and the role of social supportJ Educ Psychol2006983567582
- RatelleCFGuayFVallerandRJLaroseSSenécalCAutonomous, controlled, and amotivated types of academic motivation: A person-oriented analysisJ Educ Psychol2007994734746
- VallerandRJFortierMSGuayFSelf-determination and persistence in a real-life setting: toward a motivational model of high school dropoutJ Pers Soc Psychol1997725116111769150590
- Ministerio de Educación de la NaciónAnuario Estadístico Educativo [National Ministry of Education. Annual Educational Statistics.]Buenos Aires, ArgentinaMinisterio de Educación2010
- ElosúaPZumboBDCoeficientes de confiabilidad para escalas de respuesta categórica ordenada. [Fiability coefficients of ordinal data.]Psicothema200820489690118940100
- ForeroCGMaydeu-OlivaresAGallardo-PujolDFactor analysis with ordinal indicators: A Monte Carlo study comparing DWLS and ULS estimationStruct Equ Modeling2009164625641
- XiménezCEffect of variable and subject sampling on recovery of weak factors in CFAMethodology2007326780
- ByrneBMStructural Equation Modeling with AMOSNew York, NYRoutledge2009
- KlineRBPrinciples and Practice of Structural Equation ModelingNew York, NYGuilford2005
- RatelleCFGuayFLaroseSSenécalCFamily correlates of trajectories of academic motivation during a school transition: A semiparametric group-based approachJ Educ Psychol2004964743754
Appendix
Appendix 1 Academic Motivation Scale: high school version (in Argentine Spanish)
Appendix 2 Academic Motivation Scale: college version (in Argentine Spanish)