
Abstract
Background
Previous studies have explored the relationship between negative life events and depression, but little is known about the bidirectional relationship between negative life events and depression, particularly in specific groups of medical cadets.
Purpose
This study aimed to explore the relationship between negative life events and depressive symptoms among medical cadets during their four years of college.
Methods
An analysis of 4-wave longitudinal data collected from 2015–2018 was conducted using a cross-lagged panel network (CLPN) model to explore the complex causal relationship between negative life events and depressive symptoms in medical cadets (N=433).
Results
We found differences in negative life events and depressive symptoms among medical cadets across four network models over four years of university. Nodes A-21, A-20, A-23 and A-24, and depressive symptoms D-6 showed greater lagged effect values.
Conclusion
Our findings suggest that there is a lagged and mutually causal interaction between negative life events and depressive symptoms in medical cadets over 4 years of college, but that the predictability of negative life events is more important. However, more attention needs to be paid to the predictive role of depressive symptoms, especially those in early life which are often overlooked. Our study provides new insights into the relationship between negative life events and depressive symptoms in university students and helps to refine strategies for prevention and intervention of depression.
Introduction
Depression, one of the most prevalent mental illnesses, is characterized by physical and mental symptoms such as reduced appetite, sleep problems, persistent sadness and loss of interest, affecting approximately 5% of the world’s population, and is a major contributor to disability as well as the global burden of disease.Citation1 In developing countries, many people with depression do not receive adequate treatment, resulting in high rates of depression prevalence and relapse. According to the Blue Book of Mental Health: Report on National Mental Health Development in China,Citation2 approximately 18.5% of university students are affected by depression and the rate of suicide increases significantly with the rise of depression level. Meanwhile, recent reports indicate that the prevalence of depression is on the rise.Citation3,Citation4 Numerous studies have been conducted on the prevention and treatment of depression in the general population with a lot of research results,Citation5,Citation6 but few studies were performed on that in Chinese military personnel, especially the military medical cadets who are more vulnerable to depression.Citation7,Citation8 This may be related to the fact that military medical cadets are subjected to both heavy academic workloads and military training, resulting in a high level of depression,Citation7 accompanied with a high suicide rateCitation8,Citation9 which is the main reason for non-combat attrition in the military.Citation10 Therefore, it is necessary to further explore the pathogenesis and prevention and intervention of depression in the military personnel.
The pathologic mechanism of depression is very complex and has not yet been fully understood.Citation11 The main pathogenesis includes changes in the brain, including neurotransmitter imbalance,Citation12 structural and functional changes in the brain,Citation13 dysfunction of the neuroendocrine system,Citation14 mitochondrial damage,Citation15 and abnormalities in the default network of brain patterns,Citation16,Citation17 which are represented by cognitive bias in psychological activities, such as negative thinking mode,Citation18 process biasCitation19 and cognitive distortion.Citation20 Depression often coexists with many other diseases, such as anxiety, dementia and fear.Citation21,Citation22 Given the complex pathologic mechanisms, understanding the underlying causes of depression is of great significance for the treatment of depression.Citation23 Although there is a general consensus that both genetic and environmental factors influence depression,Citation24,Citation25 environmental factors play a more important role in the prevention and intervention of depression as genetic factors are unlikely to change on a large scale.Citation26,Citation27
Many social environmental factors influence depression,Citation28 making the study very challenging. In China, the study at military medical universities generally lasts four to five years for undergraduate students, making the university time a main period of transition from school to workplace.Citation29 Military medical students must grapple with multiple life scenarios. For example, newcomers must adjust themselves to new environment and confront interpersonal problems, and as they become seniors they may face other problems such as internship, job hunting, and complex interpersonal interactions. At the same time, the home environment of university students is also changing. For example, their parents often reach middle age at this time with more health problems,Citation30 and the older family members gradually pass away.Citation31 These changes can increase the stress levels of university students. Life stressors are one of the main causes of depression.Citation32,Citation33 Depressive episodes can affect interpersonal relationships,Citation34 academic workCitation35 and quality of life,Citation36 with committing suicide as the worst consequence. Studies have shown that recent negative life events increase the risk and severity of depression.Citation37 Depressive symptoms might cause interpersonal relationship deterioration and low quality of learning and work, etc., which are the very stressful events that induce depression. This implies that negative life events and depressive symptoms are to some extent in a vicious circle, which has not been well explored. The above problems may be common among college students, but the situation is more challenging for military medical students when they are faced with these problems due to the strict management. For example, military cadets rarely take time off to be with their family members when they are sick.Citation38
It is important to explore the predictive (causal) relationship between negative life events and depressive symptoms in the time dimension, and a new cross-lagged panel model can be used to address this issue.Citation39 In a cross-lagged panel design, two (or more) structural data are measured at two (or more) discrete time points. By calculating the regression of the set of variables from the first occasion (T1) on the set of variables from the second occasion of measurement (T2), it is possible to estimate the “cross-lagged” effect of each variable on the other variable at a given time lag (i.e., whatever the time lag between the two periods of evaluation), while controlling the autoregressive effect of each variable on itself. Cross-lagged panel models are the most appropriate when individuals have data on several structures at several discrete time points, and when the research is focused on the causal effects of these structures over time.Citation40 The cross-lagged panel network model is a combination of a mental network model and a cross-lagged panel model, which utilizes regularized regression estimates to identify autoregressive and cross-lagged paths that demonstrate the influence of one another in the temporal domain,Citation40 thus allowing us to obtain a finer degree of information.
The life circumstances and stressful events of the university students may differ from year by year, and the relationship between these events and depressive symptoms may also vary. To further understand the changes in life events and depressive symptoms over time among medical cadets, the current study explored the longitudinal relationship of negative life events and depressive symptoms using Cross-Lagged Panel Network Models.Citation39 We analyzed 4-wave data from medical cadets over four years and therefore hypothesized: (1) the network of life events and depressive symptoms over four years from freshman to senior is heterogeneous, i.e., the temporal network is not replicable, and (2) negative life events and depressive symptoms are mutually predictive of each other (vicious circle).
Materials and Methods
Study Design and Procedure
We reanalyzed data from a longitudinal survey with 4 waves spaced one year apart (2015–2018), and the choice of data nodes was determined according to the research theme, which was to explore and improve the relationship between negative life events and depressive symptoms. A convenience sampling approach was used to recruit freshmen in this survey in 2015 through verbal invitations from the faculty or posters around the campus. All surveys were conducted at the midterm of the fall semester of each academic year. The survey was carried out in quiet classrooms where the students completed a series of questionnaires, including such variables as: demographic variables, depression, and negative life events. The subjects received course credit for their participation after the investigation in the fourth year. The study was approved by the Medical Ethics Committee of Army Medical University (Project No: 30970898). The study complies with the Declaration of Helsinki, and the written informed consent was obtained from all the participants. The study team protected the physical and mental health of the participants and promised to keep the data confidential to protect the rights of the participants.
Participants
A total of 505 military medical cadets in Chongqing, China, were recruited for this investigation in 2015, and they completed the baseline investigation. The students were further invited to take part in a four-year longitudinal investigation from 2015 to 2018, 433 of whom completed the four-year longitudinal survey, including 389 males and 44 females, and 72 cadets were absent during the follow-up investigation (loss rate was 14.26%). The age of participants ranged from 17 to 25 (mean = 18.93± 1.41). The majority of the participants in the study were male, as they were all from a military medical university.
Measure Tools
Negative Life Events
To collect life-stress information, the Adolescent Self-Rating Life-Events Checklist (ASLEC) was used, which was designed by Liu in 1997.Citation41 This scale is a retrospective self-report questionnaire that includes 27 items measuring the frequency and intensity of negative life events. In the current study, the mean Cronbach’ α coefficients for the scale was 0.76, with a separate Cronbach’ α coefficient of 0.81, 0.73, 0.77 and 0.72 for each wave.
Depressive Symptoms
The Patient Health Questionnaire (PHQ-9)Citation42 was used to assess participants’ depression levels. The PHQ-9, containing 9 questions, is the most commonly used depression survey with excellent reliability and validity. In the current survey, the mean Cronbach’ α coefficients for the scale was 0.80, with a separate Cronbach’ α coefficient of 0.72, 0.79, 0.82 and 0.85 for each wave.
Data Analysis
The data was analyzed using Excel software and the validity of the measurement instruments was estimated using SPSS 25.0Citation43 for descriptive statistical analysis. To establish CLPN models, an average of 1.77% of the data was interpolated using R-package mice. The details of missing data are listed in Figure S1. Contemporaneous and cross-lagged networks were estimated and graphically visualized via R 4.0.3 (https://www.R-project.org).
Using the network analysis, the interrelationships between 27 negative life events and 9 depressive symptoms were explored. The current CLPN model is better suited to nodes fewer than 30,Citation39 but the number of our network nodes was slightly higher than the recommended one, totaling 36. Given the operational economy of the software and the purpose of the study, we did not discard any of these nodes because of the relatively homogeneous nature of our scale and the heterogeneity of these events, e.g., the death of a friend affects individuals differently from the death of a family member, even though many previous studies have optimized the number of nodes through a range of methods such as factor loadings, importance and theoretical underpinnings.Citation40,Citation44 As suggested by Rhemtulla & van Bork,Citation40 the more variables are collapsed, the more composite variables are extracted from specific observable behaviours/beliefs/attitudes, and to avoid human error, we did not consider collapsing or censoring nodes, either.
First, we estimated the Graphical Gaussian Model (GGM) for the 4-wave cross-sectional data, and then used a graphical least absolute shrinkage and selection algorithm (GLASSO) to optimize the Gaussian model, combined with an extended Bayesian information criterion (EBIC), setting the hyperparameter γ to 0.5. The smaller edge connections were made to shrink to 0, forming a sparse network and avoiding false positive edges for a more robust interpretation of the network.Citation45 For the cross-sectional network, we considered the expected influence centrality of each model,Citation46 and the expected influence centrality of the bridge.Citation47 The nodes of the network represent the items of each variable, and the edges connecting the nodes indicate the regularized partial correlation coefficients, with thicker edges indicating stronger relationships.Citation45
Finally, we estimated cross-lagged networks for the 4-wave data. We conducted analysis of the last 2 steps according to the 3-step analysisCitation40 by first fitting regularized regression models to estimate cross-lagged and autoregressive coefficients across time. And then, results were summarized by generating graphs and calculating summary statistics (e.g., within and outside predictions by node). We used the T1 main demographic variables “gender” and “age” as covariates in the cross-lagged network, using minimum absolute shrinkage with 10-fold cross-validation and selection operator regularization to estimate the temporal network.Citation40 The network structure was analyzed by the R-package glmnet, and the visualization was performed using the R-package qgraph. Higher cross-lagged predictions indicated that the latter node was more influenced by all other nodes at the early time point. In contrast, lower cross-lagged prediction values indicated that the earlier node was more influenced by all other nodes at a later time point.Citation40 For the temporal network, we considered 2 indicators: inExpected Influence (InEI) and outExpected Influence (OutEI). The former indicates the relative predictability, i.e., the extent to which each variable is predicted by other variables in the network; the latter indicates the relative influence of the target node, i.e., the extent to which each variable predicts other variables in the network. Clinically, OutEI can be considered a therapeutic target, while inEI an important therapeutic outcome.Citation48
The accuracy and stability of edge weights were estimated using two bootstrap methods implemented in the R package bootnet.Citation49 First, the accuracy of the network was estimated by calculating the 95% confidence intervals (CI) for each metric using 1000 iterations of the non-parametric bootstrap method. To evaluate the dependability of the centrality index, we estimated the correlation stability (CS) coefficients by implementing case-drop bootstrapping (nboot = 1000). It is considered to be adequate if the CS coefficients are higher than 0.25, with a desirable value of 0.5 or higher.Citation49 And then, edge weight difference tests and centrality difference tests were performed to examine if the variations between edge weights or node centrality were statistically significant (see Epskamp et al,Citation39 for a detailed description of these methods).
Consistent with a previous multi-wave data study,Citation50 we also considered the replicability of cross-period networks to demonstrate differences in negative life events and depression networks among college students over 4 years. To assess network replicability, we used the same methods to estimate replication networks of symptoms at T2 predicting T3 variables, as well as T3 to T4 predictions. Similarity between the four networks was assessed using (1) correlations between lists of edges, which provides a global measure of network similarity, (2) the percentage of individual edges in one network that replicates in another (i.e., odds ratios OR > 1 or OR < 1 across the four networks), (3) correlations of centrality indices between networks, and (4) consistency of the most central symptoms.
Results
Cross-Sectional Network
illustrates the cross-sectional network structure of the 4-wave data. In the T1 network, the CS coefficients of edge, EI and BridgeEI were 0.21, 0.28 and 0, respectively; in the T2 network, the CS coefficients of edge, EI and BridgeEI were 0.28, 0.44 and 0, respectively; in the T3 network, the CS coefficients were 0.36, 0.28 and 0.13, respectively; in the T4 network, the CS coefficients for edge, EI and BridgeEI were 0.59, 0.67 and 0.05, respectively, and all of the CS coefficients for bridgeEI were below the recommended critical values (Figures S2 and S3);.Citation45,Citation49 We therefore only interpreted the edge and EI values.
Figure 1 The cross-sectional network structure of negative life events-depression symptoms.
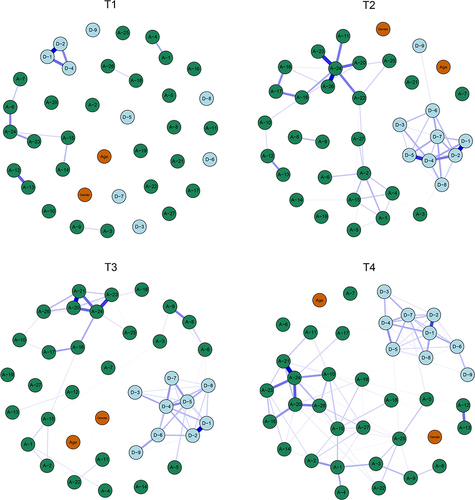
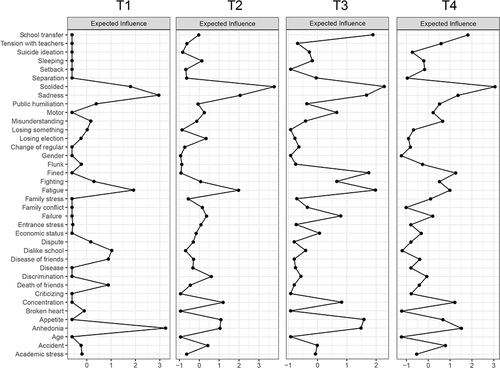
We found that the network was relatively sparsely connected for T1 (the number of edge connections was 14), while the connection density of the network gradually increased as time passed (the number of edge connections was 62 for T2, 61 for T3 and 90 for T4). The most strongly connected nodes were D-1 - D-2 and A-12 - A-13 in the T1 network; D-1 - D-2 and A-24 - A-26 in the T2 network; D-1 - D-2 and A-20 - A-21 in the T3 network; A-21 - A-24 and D-1 - D-2 in the T4 network (). The nodes with the highest EI values were D-1 and D-2 in the T1 network; A-24, D-1 and D-4 in the T2 network; A-24 and D-4 in the T3 network; A-24 and A-20 in the T4 network ().
Figure 2 The centrality of expected influence of 4-wave cross-sectional networks (z-score).
Cross-Lagged Panel Network
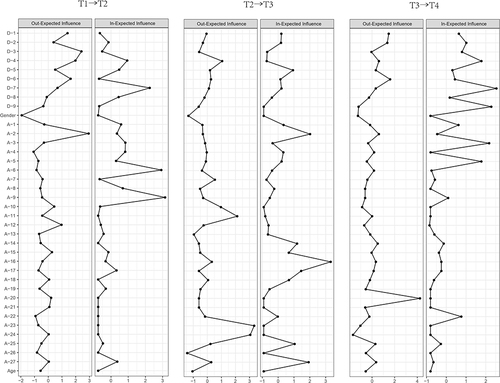
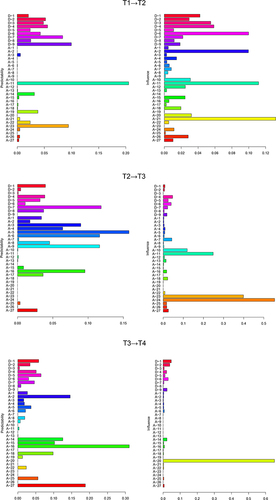
In the T1→T2 network, the nodes with the highest InEI values were A-9 and A-6, and the nodes with the highest OutEI values were A-2 and D-3; in the T2→T3 network, the nodes with the highest InEI values were A-16, A-2 and A-27, and the nodes with the highest OutEI values were A-23 and A-24; in the T3→T4 network, the nodes with the highest InEI values were D-7 and D-9, and the nodes with the highest OutEI values were A-20 and D-6 (, Table S1).
Figure 3 The centrality of in-expected influence and out-expected influence of 4-wave cross-sectional networks (z-score).
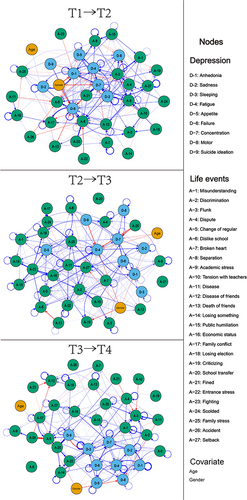
shows the cross-lagged panel network. A total of 188 edge connections were identified in the T1→T2 network, where the strongest edges across communities were A-21->D-7, D-6->A-17, D-6->A-6; 175 edge connections were identified in the T2→T3 network, where the strongest edges across communities were A-18->D-4, A-23->D-5, A-11->D-5; 157 edge connections were identified in the T3→T4 network, where the strongest edges across communities were A-20->D-9, A-14->D-3, D-7->A-3 (Table S2, node weights OR values), where the arrows indicate cross-time effects (eg., the arrow from A-21->D-7 indicates the path from A-21 at T1 to D-7 at T2). The thickness of the arrows indicates the strength of these effects (thicker arrows indicate stronger relationships), and the color indicates the direction of the effect (blue arrows indicate positive effects). Low correlation exists between T1→T2 and T2→T3, T2→T3 and T3→T4 network edges (r = 0.037, r = 0.036, respectively). There were 41 replicable edges in T1→T2 and T2→T3 networks, accounting for 21.81% of the total number of edges in T1→T2 network and 23.43% of T2→T3 network, respectively. There were 37 replicable edges in T2→T3 and T3→T4 networks, accounting for 21.14% of the total number of edges in T2→T3 network and 23.57% of T3→T4 network, respectively.
Figure 4 The cross-lagged panel networks of negative life events and depression symptoms.
The CS coefficients of edge, InEI, OutEI and BridgeEI in the T1→T2 network were 0, 0, 0.36 and 0, respectively, and the stability of edge, InEI and BridgeEI were below the recommended critical values. The edge, InEI, OutEI and BridgeEI in the T2→T3 network were 0, 0, 0.36 and 0, respectively, and the stability of InEI, outEI and BridgeEI was also lower than the recommended critical values. The CS coefficients for edge, InEI, OutEI and BridgeEI in the T3→T4 network were 0.36, 0.36, 0.36 and 0, respectively, and the stability of edge and bridgeEI was lower than the recommended values (Figures S4 and S5).Citation45,Citation49
shows the total cross-lagged results. In the T1→T2 network, A-21, A-2 had the greatest impact on depressive symptoms, and D-6 had the greatest impact on negative events. In the T2→T3 network, A-23, A-24 and A-11 had the greatest impact on depressive symptoms. In the T3→T4 network, A-20 had the greatest impact on depressive symptoms. All the nodes mentioned above had low predictability and high influence.Citation49 Predictability refers to the proportion of variance of a given T2 node in the T1 variables, and the influence refers to the impact of T1 nodes on T2 variables, which did not include the autoregressive effects of a given node or the influence of nodes with the same cluster,Citation51,Citation52 and so on for other nodes.
Figure 5 Predictability and influence of cross-lagged panel networks.
Discussion
Cadets serve as the major reserve combat power of the military. To promote research on this particular group, this study used cross-lagged panel network models to estimate the longitudinal relationship between negative life events and depressive symptoms in medical cadets. Directional estimation using 4-wave longitudinal data complicated the relationship in the time dimension, with negative life events and depressive symptoms among university students becoming progressively more strongly related over time. Multi-wave (≥3 waves) longitudinal data can extend the interrelationship between variables, as in the 2-wave study,Citation53 eg., T1 negative life events predict T2 depressive symptoms, while T2 depressive symptoms predict T3 negative life events. Modeling the temporal relationship between negative life events and depressive symptoms provides an opportunity to improve the understanding of the pathogenesis of depression and thus facilitate the prevention and intervention.
This study found that the dense connection of the contemporaneous networks of negative life events and depressive symptoms among medical cadets during their university years became stronger with increasing grade levels, and the number of edges in the temporal network was higher than that in the contemporaneous network. This implies that there is a delay in the relationship between negative life events and depressive symptoms; in other words, negative life events and depressive symptoms in the freshman year are more predictive than those in the sophomore year. This delay may explain the higher prevalence of depression among the sophomore (36.7%) compared with the freshmen (26.7%),Citation54 as well as the increase in depression prevalence with grade.Citation55 Our study extends the results of many previous studies using cross-sectional survey data,Citation56 which often examined the undirected relationship between negative life events and depressive symptoms,Citation57 or used structural equation modeling (SEM) which also typically only included negative life events as predictive variables for depression.Citation58
The prevalence of depression would be increasingly high if there is a vicious cycle of negative life events and depressive symptoms. Interestingly, however, the prevalence of depression typically ranges from 9.3% to 55.9%.Citation59 This might be attributed to the dissolution of certain aspects of this vicious cycle. Taking the death of a family member as an example, the cadets will be no longer faced with such negative life events after the death of a certain number of family members and therefore the consequent effects will disappear, thus affecting the whole cycle. In the current study, for example, A-21 (being fined) is the most important predictive variable in the T1→T2 network, but not in the T2→T3 and T3→T4 networks. These altered life events influence the cadets’ health levels.Citation60
Overall, for the cross-lagged results, negative life events had a major influence (including A-21 in the T1→T2 network, A-23 and A-24 in the T2→T3 network, and A-20 in the T3→T4 network), indicating that they had the greatest impact on other nodes in the network. This is in line with other studies that have used negative life events as predictive variables.Citation37,Citation55 However, we found that depressive symptoms were equally influential in the network, for example, D-6 in the T1→T2 network. In fact, our results showed that depressive symptoms of the T1-T2 network had a large lagging effect on subsequent symptoms, while the effects of depressive symptoms of the T2→T3 and T3→T4 networks were relatively small. The role of depressive symptoms as a predictor for negative life events is often overlooked, and our evidence suggests that attention should be paid to the interaction between negative life events and depressive symptoms, especially to depressive symptoms during the freshman year, which is consistent with previous views.Citation61 However, we do not know whether this lagging effect is present in teenagers, especially during adolescence when the prevalence of depression rises sharply.Citation62
In addition, differences were found in the effects of gender on negative life events and depressive symptoms at different stages of the network. The T1 stage had the greatest impact on the T2 stage, and the impact of gender decreased over time. In the early stages, gender mainly affected depressive symptoms, such as D-1 and D-6, while in the later stages, gender began to affect negative life events, such as A-19 and A-27 in T2 → T3 network, and A-5 in T3 → T4 network. We believe that this gender difference is mainly a different response between males and females when faced with these events, such as the response after being criticized or punished (A-19).Citation63 Previous cross-sectional studies have reported that with the progress of depression, the impact of life events on depression is minimal, while the impact of gender remains significant.Citation64 In contrast, our study demonstrated that the impact of gender on depression gradually decreased. Considering that previous studies were cross-sectional surveys, the time effect may have been overlooked. However, due to the limited sample size of this study, further investigations are needed to determine the specific impact of gender on depression.
This study explored the cross-lagged effects of negative life events and depressive symptoms in military medical cadets over a 4-year period. A cross-lagged network model was used to estimate a network of 4-wave longitudinal data, which can help us to identify the direction of the relationship and understand the temporal relationships of these nodes. Since the previous research was focused on cross-sectional data,Citation57 a growing number of researchers are now advocating the modeling of longitudinal networks.Citation50,Citation65,Citation66 Our study is an extension of the longitudinal network model, and provides recommendations for prevention and intervention of negative life events and depression among military medical cadets. In addition, the study examined the interaction between the stressor and the disease from a unique perspective, aiming to emphasize that attention should be paid to the influence of the mental illness on the causative factors in order to better understand the underlying mechanisms. Finally, we suggest that school administrators should develop appropriate management systems. For example, a mental health assessment should be conducted for all new college students and a mental health profile should be created. Immediate intervention should be provided for early and prominent psychological symptoms, especially the “D-6 (failure)” of college freshmen. Students’ sense of failure can cause a series of negative reactions, such as stigma or labeling,Citation67 which can affect the subsequent college life. Interventions using supportive counseling programs can improve this situation.Citation68
However, this study has several limitations. First, the current sample recruited from a single university is homogeneous, and the sample size is small (433 medical cadets), resulting in some of the indicators in the network not meeting the relevant recommended criteria.Citation49 Second, although gender and age were chosen as covariates, there are many factors that influence depression which we did not control. This may have influenced the results, especially when the sample size was small. In addition, depressive symptoms and negative life events were evaluated for different durations. In particular, depressive symptoms were evaluated based on subjective rating of participants in the past 2 weeks, which may have been influenced by the individual’s mood rather than objective symptoms (as assessed by a psychiatrist). Therefore, in future studies, the main influencing factors should be controlled, the time range for measurement should be balanced, and the sample size should be expanded. Since the stability of some results in this study was lower than the recommended value, the interpretation of the results should be taken discreetly. Finally, our cross-lagged network included a total of 36 nodes, which is higher than the 30 nodes suggested by Epskamp,Citation39 which may increase the computational difficulty of the software. In conclusion, our study provides new insights into the complex relationship between negative life events and depression in medical cadets, but a large sample of evidence is needed to support this.
Conclusion
This study used a cross-lagged panel network model to estimate the complex longitudinal relationship between negative life events and depressive symptoms over 4 years among military medical cadets. We found that the network models differed across the 4 years and that the interaction of nodal variables was delayed. Furthermore, the evidence for a causal interaction between negative life events and depressive symptoms was extended. Therefore, for interventions targeting depression in medical cadets, attention should be paid to temporal effects as well as dual prevention and interventions of negative life events and depressive symptoms. In particular, A-21, A-20, A-23 and A-24, as well as D-6 showed greater external influence values, implying that these nodes play a very important role in the depression and lives of military medical cadets. Future studies should focus on the correlation between early negative life events and depressive symptoms, particularly in adolescence with large samples.
Abbreviations
PHQ-9, Patient Health Questionnaire; ASLEC, Adolescent self-rating life events checklist; CI, Confidence interval; CS, Correlation stability; GGM, Gaussian graphical model; LASSO, Least Absolute Shrinkage and Selection Operator; EBIC, extended Bayesian information criterion; inEI, in Expected Influence; outEI, out expected Influence; T1, times one, one year; OR, odds ratios.
Disclosure
The authors report no conflicts of interest in this work.
Acknowledgments
Preparation of this article was supported by key project of Natural Science Foundation of Chongqing (cstc2020jcyj-zdxmX0009), the key project and innovation project of People’s Liberation Army of China (2021HL003). The authors thanked all participants and graduate cadets who took part in this study. We are grateful for the help of the HOME for Researchers tool.
References
- World Health Organization. Depression; 2022. Available from: https://www.who.int/news-room/fact-sheets/detail/depression. Accessed March 5, 2022.
- Fu X, Zhang K, Chen X, Chen Z. Report on National Mental Health Development in China (2019–2020). Social Sciences Academic Press (CHINA); 2021.
- News from CNR. The incidence of depression among Chinese adolescents is increasing year by year and the National Health Commission has included depression screening in students’ health check-ups. China National Radio; 2020.
- People’s Daily Health APP. 2022 Blue Book on National Depression. People’s Daily Health APP; 2022.
- Benjet C, Zainal NH, Albor Y, et al. A precision treatment model for internet-delivered cognitive behavioral therapy for anxiety and depression among university students: a secondary analysis of a randomized clinical trial. JAMA Psychiatry. 2023;80:768. doi:10.1001/jamapsychiatry.2023.1675
- Ippolito G, Bertaccini R, Tarasi L, et al. The role of alpha oscillations among the main neuropsychiatric disorders in the adult and developing human brain: evidence from the last 10 years of research. Biomedicines. 2022;10. doi:10.3390/biomedicines10123189
- Wu H, Feng Z, Song X. A study on depression status and its related factors of young army men. Chin J Health Care Med. 2009;11:433–436.
- Wang Z, Wang B, Zhang L, Chen Y, Wang H, Tan Q. Prevalence of suicidal idea and its influencing factors in military personnel. Chin J Public Health. 2010;26:187–188.
- Sun J, Ji J. Military suicide status and prevention strategies. Chin J Behav Med Sci. 2004;2004:110–111.
- Zhao Q, Ma H, Huang W, Li H. Advances in research on factors influencing suicide in the military. J Psychiatry. 2020;33:233–236.
- Orsolini L, Pompili S, Tempia Valenta S, Salvi V, Volpe U. C-reactive protein as a biomarker for major depressive disorder? Int J Mol Sci. 2022;23:1616. doi:10.3390/ijms23031616
- Lee W, Kang B-H, Yang H, et al. Spread spectrum SERS allows label-free detection of attomolar neurotransmitters. Nat Commun. 2021;12:159. doi:10.1038/s41467-020-20413-8
- Li Y, Fan C, Wang L, et al. MicroRNA-26a-3p rescues depression-like behaviors in male rats via preventing hippocampal neuronal anomalies. J Clin Invest. 2021;2021:131.
- Strickland PL, Deakin JFW, Percival C, Dixon J, Gater RA, Goldberg DP. Bio-social origins of depression in the community. Interactions between social adversity, cortisol and serotonin neurotransmission. Br J Psychiatry. 2002;180:168–173. doi:10.1192/bjp.180.2.168
- Tanaka M, Szabó Á, Spekker E, Polyák H, Tóth F, Vécsei L. Mitochondrial Impairment: a common motif in neuropsychiatric presentation? The link to the tryptophan-kynurenine metabolic system. Cells. 2022;11:2607. doi:10.3390/cells11162607
- Gao Y, Wang M, Yu R, et al. Abnormal default mode network homogeneity in treatment-naive patients with first-episode depression. Front Psychiatry. 2018;9:697. doi:10.3389/fpsyt.2018.00697
- Bezmaternykh DD, Melnikov MY, Savelov AA, et al. Brain networks connectivity in mild to moderate depression: resting state fMRI study with implications to nonpharmacological treatment. Neural Plast. 2021;2021:8846097. doi:10.1155/2021/8846097
- Foland-Ross LC, Hamilton JP, Joormann J, Berman MG, Jonides J, Gotlib IH. The neural basis of difficulties disengaging from negative irrelevant material in major depression. Psychol Sci. 2013;24:334–344. doi:10.1177/0956797612457380
- Zhang TR, Larosa A, Di Raddo M-E, Wong V, Wong AS, Wong TP. Negative memory engrams in the hippocampus enhance the susceptibility to chronic social defeat stress. J Neurosci. 2019;39:7576–7590. doi:10.1523/JNEUROSCI.1958-18.2019
- Maramis MM, Mahajudin MS, Khotib J. Impaired cognitive flexibility and working memory precedes depression: a rat model to study depression. Neuropsychobiology. 2021;80:225–233. doi:10.1159/000508682
- Tanaka M, Vécsei L. Editorial of special issue “crosstalk between depression, anxiety, and dementia: comorbidity in behavioral neurology and neuropsychiatry”. Biomedicines. 2021;9:517. doi:10.3390/biomedicines9050517
- Battaglia S, Nazzi C, Thayer JF. Fear-induced bradycardia in mental disorders: foundations, current advances, future perspectives. Neurosci Biobehav Rev. 2023;149:105163. doi:10.1016/j.neubiorev.2023.105163
- Belmaker RH, Agam G. Major depressive disorder. N Engl J Med. 2008;358:55–68. doi:10.1056/NEJMra073096
- Otte C, Gold SM, Penninx BW, et al. Major depressive disorder. Nat Rev Dis Primers. 2016;2:16065. doi:10.1038/nrdp.2016.65
- Barbu MC, Huider F, Campbell A, et al. Methylome-wide association study of antidepressant use in Generation Scotland and the Netherlands Twin Register implicates the innate immune system. Mol Psychiatry. 2022;27:1647–1657. doi:10.1038/s41380-021-01412-7
- Nasser EH, Overholser JC. Recovery from major depression: the role of support from family, friends, and spiritual beliefs. Acta Psychiatr Scand. 2005;111:125–132. doi:10.1111/j.1600-0447.2004.00423.x
- Kuwahara K, Honda T, Nakagawa T, Yamamoto S, Hayashi T, Mizoue T. Intensity of leisure-time exercise and risk of depressive symptoms among Japanese workers: a cohort study. J Epidemiol. 2018;28:94–98. doi:10.2188/jea.JE20170009
- Funkhouser CJ, Kaiser AJE, Alqueza KL, et al. Depression risk factors and affect dynamics: an experience sampling study. J Psychiatr Res. 2021;135:68–75. doi:10.1016/j.jpsychires.2021.01.007
- Tang F, Byrne M, Qin P. Psychological distress and risk for suicidal behavior among university students in contemporary China. J Affect Disord. 2018;228:101–108. doi:10.1016/j.jad.2017.12.005
- GBD. 2019 risk factors collaborators. Global burden of 87 risk factors in 204 countries and territories, 1990–2019: a systematic analysis for the global burden of disease study 2019. Lancet. 2020;396:1223–1249. doi:10.1016/S0140-6736(20)30752-2
- The Xinhua News Agency. Life expectancy per capita in China increases to 78.2 years in 2021; 2022. Available from: https://www.gov.cn/xinwen/2022-07/12/content_5700668.htm. Accessed June 28, 2023.
- Hammen C. Risk factors for depression: an autobiographical review. Annu Rev Clin Psychol. 2018;14:1–28. doi:10.1146/annurev-clinpsy-050817-084811
- Caspi A, Sugden K, Moffitt TE, et al. Influence of life stress on depression: moderation by a polymorphism in the 5-HTT gene. Science. 2003;301:386–389. doi:10.1126/science.1083968
- Rose-Clarke K, Hassan E, Bk P, et al. A cross-cultural interpersonal model of adolescent depression: a qualitative study in rural Nepal. Soc Sci Med. 2021;270:113623. doi:10.1016/j.socscimed.2020.113623
- Sinha V, Singh RN. Immunological role of hardiness on depression. Indian J Psychol Med. 2009;31:39–44. doi:10.4103/0253-7176.53314
- Solmi M, Koyanagi A, Thompson T, Fornaro M, Correll CU, Veronese N. Network analysis of the relationship between depressive symptoms, demographics, nutrition, quality of life and medical condition factors in the Osteoarthritis Initiative database cohort of elderly North-American adults with or at risk for osteoarthritis. Epidemiol Psychiatr Sci. 2019;29:e14. doi:10.1017/S204579601800077X
- Yacaman-Mendez D, Hallgren M, Forsell Y. Childhood adversities, negative life events and outcomes of non-pharmacological treatments for depression in primary care: a secondary analysis of a randomized controlled trial. J Psychiatr Res. 2019;110:152–158. doi:10.1016/j.jpsychires.2019.01.004
- China Military. Chinese people’s liberation Army Academy cadet management regulations; 2006. Available from: http://www.81.cn/rdzt/2014/0421bkjx/2014-04/18/content_5870503.htm. Accessed June 26, 2023.
- Epskamp S. Psychometric network models from time-series and panel data. Psychometrika. 2020;85:206–231. doi:10.1007/s11336-020-09697-3
- Rhemtulla M, van Bork R, van Borkulo CD. Cross-lagged network models. Multivariate Behav Res. 2018;56:314–328. doi:10.1080/00273171.2018.1489771
- Liu X, Liu L, Yang J, et al. Validity and reliability analysis of adolescent self-rating life events checklist. Chin Ment Health J. 1997;1997:39–41.
- Bian C, He X, Qian J, Wu W, Li C. The reliability and validity of a modified patient health questionnaire for screening depressive syndrome in general hospital outpatients. J Tongji Univ. 2009;132:136–140.
- IBM Corp. IBM SPSS Statistics for Windows. IBM Corp; 2017.
- Black L, Panayiotou M, Humphrey N. Internalizing symptoms, well-being, and correlates in adolescence: a multiverse exploration via cross-lagged panel network models. Dev Psychopathol. 2022;34:1477–1491. doi:10.1017/S0954579421000225
- Epskamp S, Fried EI. A tutorial on regularized partial correlation networks. Psychol Methods. 2018;23:617–634. doi:10.1037/met0000167
- McNally RJ. Can network analysis transform psychopathology? Behav Res Ther. 2016;86:95–104. doi:10.1016/j.brat.2016.06.006
- Jones PJ, Ma R, McNally RJ. Bridge centrality: a network approach to understanding comorbidity. Multivariate Behav Res. 2021;56:353–367. doi:10.1080/00273171.2019.1614898
- Chavez-Baldini U, Verweij K, de Beurs D, et al. The interplay between psychopathological symptoms: transdiagnostic cross-lagged panel network model. BJPsych Open. 2022;8:e116. doi:10.1192/bjo.2022.516
- Epskamp S, Borsboom D, Fried EI. Estimating psychological networks and their accuracy: a tutorial paper. Behav Res Methods. 2018;50:195–212. doi:10.3758/s13428-017-0862-1
- Funkhouser CJ, Chacko AA, Correa KA, Kaiser AJE, Shankman SA. Unique longitudinal relationships between symptoms of psychopathology in youth: a cross‐lagged panel network analysis in the ABCD study. J Child Psychol Psychiatry. 2021;62:184–194. doi:10.1111/jcpp.13256
- Moriarity DP, Bart CP, Stumper A, Jones P, Alloy LB. Mood symptoms and impairment due to substance use: a network perspective on comorbidity. J Affect Disord. 2021;278:423–432. doi:10.1016/j.jad.2020.09.086
- Bernstein EE, Kleiman EM, van Bork R, et al. Unique and predictive relationships between components of cognitive vulnerability and symptoms of depression. Depress Anxiety. 2019;36:950–959. doi:10.1002/da.22935
- Li Y, Kwok SYCL. A longitudinal network analysis of the interactions of risk and protective factors for suicidal potential in early adolescents. J Youth Adolesc. 2022. doi:10.1007/s10964-022-01698-y
- Ji L, Chen C, Hou B, et al. A study of negative life events driven depressive symptoms and academic engagement in Chinese college students. Sci Rep. 2021;11:17160. doi:10.1038/s41598-021-96768-9
- Chen Z, Shen S, Dai Q. Long-term and short-term psycho-social predictors of early-adulthood depression: role of childhood trauma, neuroticism, social-support, resilience, and life-events. Curr Psychol. 2021. doi:10.1007/s12144-021-01570-5
- Han L, Zhao S, Pan X, Liao C-J. The impact of students with left-behind experiences on childhood: the relationship between negative life events and depression among college students in China. Int J Soc Psychiatry. 2018;64:56–62. doi:10.1177/0020764017739332
- Li K, Guang Y, Ren L, et al. Network analysis of the relationship between negative life events and depressive symptoms in the left-behind children. BMC Psychiatry. 2021;21:1–11. doi:10.1186/s12888-021-03445-2
- Hardt J, Johnson JG. Suicidality, depression, major and minor negative life events: a mediator model. Psychosoc Med. 2010;7:Doc05. doi:10.3205/psm000067
- Rotenstein LS, Ramos MA, Torre M, et al. Prevalence of depression, depressive symptoms, and suicidal ideation among medical students. JAMA. 2016;316:2214. doi:10.1001/jama.2016.17324
- Artani A, Bhamani SS, Azam I, AbdulSultan M, Khoja A, Kamal AK. Adaptation of the Recent Life Changes Questionnaire (RLCQ) to measure stressful life events in adults residing in an urban megapolis in Pakistan. BMC Psychiatry. 2017;17:169. doi:10.1186/s12888-017-1315-1
- Hammen C. Adolescent depression: stressful interpersonal contexts and risk for recurrence. Curr Dir Psychol Sci. 2009;18:200–204. doi:10.1111/j.1467-8721.2009.01636.x
- Thapar A, Collishaw S, Pine DS, Thapar AK. Depression in adolescence. Lancet. 2012;379:1056–1067. doi:10.1016/S0140-6736(11)60871-4
- Peterson KM, Smith DA. An actor-partner interdependence model of spousal criticism and depression. J Abnorm Psychol. 2010;119:555–562. doi:10.1037/a0020115
- Sun X-J, Niu G-F, You Z-Q, Zhou Z-K, Tang Y. Gender, negative life events and coping on different stages of depression severity: a cross-sectional study among Chinese university students. J Affect Disord. 2017;209:177–181. doi:10.1016/j.jad.2016.11.025
- Chen C, Li F, Liu C, Li K, Yang Q, Ren L. The relations between mental well-being and burnout in medical staff during the COVID-19 pandemic: a network analysis. Front Public Health. 2022;10:1.
- Achenbach TM, McConaughy SH, Ivanova MY, Rescorla LA. Manual for the ASEBA Brief Problem Monitor (BPM). Burlington, VT, USA: ASEBA; 2011.
- Nunes K, Du S, Philip R, et al. Science students’ perspectives on how to decrease the stigma of failure. FEBS Open Bio. 2022;12:24–37. doi:10.1002/2211-5463.13345
- Peyrovi H, Parvizy S, Haghani H. Supportive counselling programme for nursing students experiencing academic failure: randomized controlled trial. J Adv Nurs. 2009;65:1899–1906. doi:10.1111/j.1365-2648.2009.05037.x