
Abstract
Background
The London Measure of Unplanned Pregnancy (LMUP) is a psychometrically validated measure of the degree of intention of a current or recent pregnancy. The LMUP is increasingly being used worldwide, and can be used to evaluate family planning or preconception care programs. However, beyond recommending the use of the full LMUP scale, there is no published guidance on how to use the LMUP as an outcome measure. Ordinal logistic regression has been recommended informally, but studies published to date have all used binary logistic regression and dichotomized the scale at different cut points. There is thus a need for evidence-based guidance to provide a standardized methodology for multivariate analysis and to enable comparison of results. This paper makes recommendations for the regression method for analysis of the LMUP as an outcome measure.
Materials and methods
Data collected from 4,244 pregnant women in Malawi were used to compare five regression methods: linear, logistic with two cut points, and ordinal logistic with either the full or grouped LMUP score. The recommendations were then tested on the original UK LMUP data.
Results
There were small but no important differences in the findings across the regression models. Logistic regression resulted in the largest loss of information, and assumptions were violated for the linear and ordinal logistic regression. Consequently, robust standard errors were used for linear regression and a partial proportional odds ordinal logistic regression model attempted. The latter could only be fitted for grouped LMUP score.
Conclusion
We recommend the linear regression model with robust standard errors to make full use of the LMUP score when analyzed as an outcome measure. Ordinal logistic regression could be considered, but a partial proportional odds model with grouped LMUP score may be required. Logistic regression is the least-favored option, due to the loss of information. For logistic regression, the cut point for un/planned pregnancy should be between nine and ten. These recommendations will standardize the analysis of LMUP data and enhance comparability of results across studies.
Background
In 2012, 85 million women experienced an unintended pregnancy: 40% of all pregnancies globally.Citation1 This was in part a consequence of the fact that 222 million women worldwide are not using an effective method of contraception, despite not wanting a child in the near future.Citation2 Fully meeting the need for family planning could reduce maternal deaths by a further 30%,Citation3 neonatal deaths by 0.6 million per year, and later infant deaths by 0.5 million per year, predominantly in low-income countries.Citation2
Reducing unintended pregnancy and its adverse effects on maternal and neonatal outcomes remains a high priority for global reproductive health. In order to meet the need for family planning globally fully, we must develop a better understanding of women’s pregnancy intentions and behaviors. Improving contraceptive use is the mainstay of these efforts, as effective family planning programs should lead to a reduction in unplanned pregnancies. Similarly, effective preconception care should lead to an increase in planned pregnancies. However, currently there are challenges in the measurement of pregnancy intention as an outcome measure.
Most current estimates of levels of unintended pregnancy are derived from questions used in population-based surveys, such as the National Survey of Family Growth and the Pregnancy Risk Assessment Monitoring System in the US and Demographic and Health Surveys in low-income countries. For example, Demographic and Health Surveys ask a single question of women up to 5 years after their last birth to determine whether that pregnancy was intended or unintended.
However, pregnancy intention has increasingly been recognized as a complex concept that encompasses “affective, cognitive, cultural and contextual dimensions”.Citation4 The aforementioned methodologies are unsatisfactory, as they diminish a complex concept to two categories, are likely to introduce recall bias, and overestimate intention, because reported intention may be greater after delivery then during pregnancyCitation5 and abortions are omitted. While these surveys have provided useful information over the last 100 years, there has been increasing discussion of the limitations of these methodologies and of the need to develop a more sophisticated way of measuring the complex construct that is pregnancy intention.Citation4,Citation6–Citation12
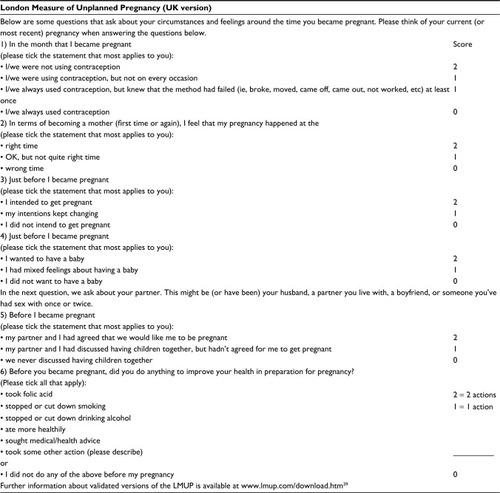
The London Measure of Unplanned Pregnancy (LMUP) is a psychometrically validated measure of the degree of intention/planning of a current or recent pregnancy.Citation7 The LMUP is officially a measure of both pregnancy planning and intention, making no distinction between these broad concepts, consistent with the qualitative evidence underpinning the development of the measure. We also use the terms “planning” and “intention” interchangeably in this paper. As shown in , LMUP comprises six questions, each scored 0, 1, or 2. These are summed to create an ordinal variable on a scale of 0–12, with each increase in score reflecting an increase in pregnancy intention. At first publication, provisional guidance about the interpretation of the scores was given by Barrett et al to aid the production of prevalence estimates (0–3, unplanned; 4–9, ambivalent; 10–12, planned); however, they recommended using the full scale in analysis.Citation7
Figure 1 LMUP questions and scoring.
Abbreviation: LMUP, London Measure of Unplanned Pregnancy.
The LMUP has been formally and informally validated in multiple and diverse settings,Citation13–Citation17 and is increasingly being used as a research tool.Citation18–Citation25 There are multiple potential uses for the LMUP, but when used to evaluate the effectiveness of family planning or preconception care programs it is a patient reported outcome measure (PROM). A recent consensus statement has recommended the LMUP as an outcome measure for preconception care in the US.Citation26
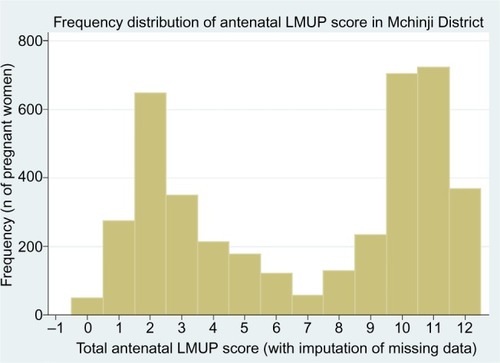
Pregnancy intention is a strongly socially patterned phenomenon, and the distribution of LMUP scores is affected by the composition of the sample. In the original UK validation study,Citation7 with a sample closely matching the UK population of pregnant women, the distribution of LMUP scores was negatively skewed, probably bimodal (). This distribution has been replicated in other large, population-based UK studies.Citation21,Citation22 In other studies around the world, the distribution has consistently been abnormal,Citation14,Citation15,Citation17 and bimodality is seen in our current Malawi data ().
Figure 2 The distribution of LMUP scores in the original UK data.
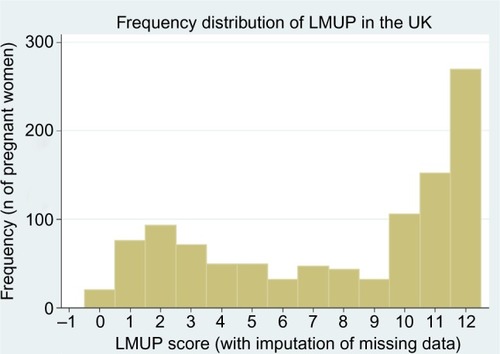
Figure 3 The distribution of LMUP scores in our Malawi data.
Abbreviation: LMUP, London Measure of Unplanned Pregnancy.
Beyond recommendations for the use of the full LMUP scale,Citation7 there is no published guidance on how to use the LMUP as an outcome measure in analyses. Ordinal logistic regression has been recommended on the LMUP website,Citation27 essentially the LMUP handbook, on the basis of unpublished PhD analyses (unpublished data, Barrett, 2002). Four studies using the LMUP to explore determinants of pregnancy intention to date have all used binary logistic regression, but have dichotomized the scale at different cut points.Citation22–Citation24,Citation28 There is thus a need for evidence-based guidance to provide a standardized methodology for multivariate analysis using the LMUP as a PROM and to enable comparison of results.
There are several reasons why the choice of regression method for the multivariate analysis of the LMUP as an outcome measure is not immediately apparent. These include the non-Normal distribution of pregnancy intention and the ordinal nature of the LMUP score. In addition to the recommended ordinal logistic regression with the full score range and the binary logistic regression used in publications to date, linear regression and ordinal logistic regression with LMUP scores grouped into categories are also possibilities.Citation7 Each model has its own advantages and disadvantages.
The linear model has the advantages of relative simplicity, use of the full range of LMUP scores, and ease of interpretation. However, using a linear model assumes that the relationship we are looking at is linear and that each interval on the scale is equivalent. This may not be the case for the LMUP, ie, the difference between pregnancies that score 3 and 4 may or may not be the same as the difference between pregnancies that score 10 and 11. In addition, for the model to be valid, the residuals should be Normally distributed and independent and the variance of the residuals should be constant. Treating the ordinal score as linear may violate the assumption that the variance of the LMUP score is homogeneous across the variables of interest, and while the parameter estimate may be unbiased, the estimates of variance may be biased and inconsistent.Citation29
Binary logistic models require conversion of the LMUP score from an ordinal to a binary outcome. Until recently, this was the most common approach in situations where the outcome is ordinal categorical. However, there are two main limitations to this approach. First, it results in a loss of information, as categories are collapsedCitation30 – and in the case of the LMUP, collapsing 13 categories to two results in the loss of a lot of information – and thus typically a loss of power to investigate relationships.Citation30 Second, the choice of cutoff is not always obvious, and the results can be sensitive to the choice.Citation31 Simulations have shown that the optimal cut point in terms of efficiency is considered to be where the cut creates two groups with equal numbers, ie, at the median, and that this model is asymptotically 75% efficient compared to an ordinal regression of a five-point scaleCitation31 (it will be less efficient for a 13-point scale like the LMUP). However, this is an arbitrary cut point, making the results difficult to interpret and of little practical use. An alternative would be to choose a cut point that is hypothesized to be relevant on the basis of theory, eg, a cut point at 9 for the LMUP, above which pregnancies would be described as “planned”.Citation7 Introducing a cut point in this way is arbitrary, and the high starting number of categories in the LMUP score exacerbates the arbitrariness for the LMUP, suggesting that ordinal regression might be preferable.Citation31
Ordinal logistic regression is a newer technique that has increasingly been used since the commands became available in common statistical packages. It was developed in recognition of the aforementioned limitations of collapsing ordinal scores to binary outcomes and of the growing amount of health data that were being collected on ordinal scales, eg, of pain or quality of life.Citation29 There are two main types of ordinal regression: the proportional odds model and the continuation ratio model. The proportional odds model is the model most commonly used, is available as standard in Stata, and is provisionally recommended for use in the multivariate analysis of the LMUP when it is used as the dependent variable (unpublished data, Barrett, 2002).
The theory behind the proportional odds model (also called the cumulative odds model) is an extension of the logistic model for binary data, and is based on the assumption that there is an underlying continuous variable from which the ordered categorical variable is created.Citation31 The proportional odds model calculates cut point-specific odds ratios at each cut point, using all observations in the data every time, but at a different level of dichotomization. As such, a five-point ordinal scale would have four cut points: comparing the first category to the last four categories, the first two categories to the last three categories, the first three categories to the last two categories, and finally the first four categories to the last category. From this, one summary odds ratio is calculated, based on the maximization of the likelihood function, which is valid over all cut points simultaneously.Citation29 This means that inferences can be made across the range of outcomes considered, whereas the results of the binary logistic regression are confined to one cut point. This model is based on the assumption of homogeneity of odds ratios across each cut point.
Though ordinal logistic regression can be applied, retaining all values of the LMUP, which has been recommended and retains all possible information, these values may also be aggregated for analysis. This may be because problems are found or expected with convergence or precision when fitting ordinal logistic regression models with all values of the LMUP score, due to small cell counts. We have been unable to find any guidance on how many cut points can be managed by an ordinal logistic regression and the pros and cons of this choice in terms of “power” or “sensitivity” to detect associations. Another reason to aggregate is for simplicity and to link the regression analysis to meaningful prevalence estimates. With this in mind, we explore the application of ordinal logistic regression retaining all values of the LMUP and also with LMUP scores aggregated into three categories that seem theoretically valid: a score of 0–3 is classed as “unplanned”, 4–9 as “ambivalent”, and ≥10 as “planned”.Citation7
The aim of this paper is to make recommendations for the analysis of future studies using the LMUP as an outcome variable. To do this, we used data from pregnant women in Malawi to compare different multivariate regression models for examining determinants of pregnancy intention with the LMUP score as the dependent variable. We also present a confirmatory analysis using LMUP data from a separate UK dataset: the original LMUP validation study.Citation7 The recommendations would apply equally where the LMUP is used as an outcome measure in an interventional trial, eg, of a preconception care intervention.
Materials and methods
The Malawi dataset comprised 4,244 pregnant women aged 15–49 years who were recruited in Mchinji District between March and December 2013. They were interviewed at their homes, and were two and nine months pregnant at the time of interview. The cohort has been described in more detail elsewhere.Citation32 The UK dataset, which has also been described in detail elsewhere,Citation7 comprised 1,039 women with a valid LMUP score, of whom 555 (53.4%) were currently pregnant and continuing their pregnancy to term, 221 (21.3%) were currently pregnant and opting for abortion, and 263 (25.3%) were postnatal. The UK dataset contained data on fewer of the potential determinants of pregnancy intention. The variables available were mother’s age, education level, birth order of the child, ethnicity, and whether she was living with her husband or partner. The stability of LMUP scores between pregnancy and the postnatal period was formally assessed and shown to be highly stable in the original UK psychometric analyses.Citation7 As expected, women who were opting for abortion were mainly in the first trimester and tended to have low LMUP scores. Among women who were currently pregnant and continuing their pregnancies to term, there was no correlation between gestation and LMUP score (r=−0.03, P=0.32).
In total, five different multivariate-regression models were compared on the Malawi data: linear regression, binary logistic regression with a cut point at the median “Log med” or at an LMUP score of nine “Log plan”, and ordinal logistic regression using the full LMUP scale “LMUP all” or using the LMUP grouped into three categories (“LMUP 3”). First, the univariate relationship of each potential determinant of pregnancy intention with LMUP score was considered using each type of regression analysis and the results compared across the models. The potential determinants of pregnancy intention were developed on the basis of the literature, and are shown in Box 1. In the Malawi dataset, “tribe” consisted of the majority Chewa tribe, used as the baseline, and Senga, Ngoni, Yao, and “other”, whereas the UK data used “white British” as the baseline compared to “white other”, “black British”, Asian, and “mixed/other”. Religion was grouped with non-Catholic Christian as the baseline and Catholic Christian, Muslim, and “other” as the comparison groups. Intimate partner violence was measured using the Abuse Assessment Screen.Citation33 Previous episodes of depression were assessed by asking women whether they had experienced low mood and/or anhedonia, and if so whether this lasted for more than 2 weeks.
Multivariate models were created using each type of regression and including all variables. The coefficients (or odds ratios) of each variable were compared across the five models and classified the “same” if the coefficients were consistent in their direction and also either consistently statistically significant or consistently not significant across all the models. Otherwise, the coefficients were classified as “different”. This fairly crude distinction is for illustrative purposes only in the comparison of the different models; even when coefficients are “different”, the differences are often qualitatively very small.
The assumptions underlying each model were then formally tested. For the linear regression this involved checking that the standardized residuals are Normally distributed and that there is homoscedasticity of the variance of the residuals, and that there was proportionality of odds across response categories for the ordinal logistic regression models. The validity of the proportional odds assumption for both ordinal logistic regression models was also formally tested. In our regression models, following the standard approach, categorical covariates are represented by a set of binary indicator variables. If there are n categories, then there will be n−1 indicator variables, each representing the difference between a category and the category that is chosen to be the baseline. When testing the proportional odds assumption for a categorical variable, it is difficult to conduct a single test, and thus we tested the assumption for each indicator variable in turn. These tests assess whether the odds ratios for a category relative to the baseline are common across the cut points in the regression model. Where assumptions were found to have been violated, ways to address this were considered. For linear regression, this was the calculation of robust standard errors, and for the ordinal regression it was the calculation of a partial proportional odds model.
As a confirmatory analysis, the same methods were subsequently followed for the analysis of the UK LMUP data, though the Log med model was omitted, as this had been dropped during the analysis of the Malawi data. Whichever model is chosen, continuous covariates may be included as simple linear terms or more complex forms, such as spline functions. In this work, linear terms are used, and the linearity of association between LMUP score and each covariate was checked graphically. All analyses were conducted in Stata 13.
Ethics approval and consent to participate
The UCL Research Ethics Committee and the College of Medicine Research Ethics Committee at the University of Malawi granted ethical approval for the research from which these data are drawn (3974/001 and P.03/12/1273, respectively). All participants gave written informed consent to take part in this research. Ethical approval for the original UK LMUP validation study was granted by a National Health Service multicenter research-ethics committee.
Results
Univariate analyses
A summary of univariate results is presented in . For most variables, there were no differences among types of regression, though there were some small variations in the size, but not direction, of the estimated effects. In general, the ordinal logistic models had the most precision (narrowest confidence intervals [CIs]), but the differences between the models were small and nonsignificant. For example, in the linear regression, each additional year of maternal education was associated with an increase in LMUP score of 0.15 (95% CI 0.11–0.18), indicating a more planned pregnancy. In the Log plan model, each additional year of maternal education increased the odds of a planned pregnancy by 1.06 (95% CI 1.04–1.09). The Log med model has a less intuitive interpretation, in that each additional year of maternal education increased the odds of having an LMUP score above the median by 1.07 (95% CI 1.04–1.09). In the ordinal regression models, the LMUP all model shows that each additional year of maternal education increased the odds of having an LMUP score above each point of the scale by 1.07 (95% CI 1.05–1.09). Finally, the LMUP 3 model tells us that the odds of having a planned pregnancy compared to an unplanned or ambivalent pregnancy, and also the odds of a planned or ambivalent pregnancy compared to an unplanned pregnancy, were 1.06 (95% CI 1.04–1.08) for each additional year of maternal education. These interpretations are the same for the multivariate models, except that the coefficients were then controlled for other variables in the model.
Table 1 Findings from the univariate analyses of our Malawi data for the five different regression models
Multivariate regression
The results of the five multivariate regressions are shown in . Values in bold were significant at P<0.05.
Table 2 Comparison of the five multivariate regression models using our Malawi data
Assessment of linear regression
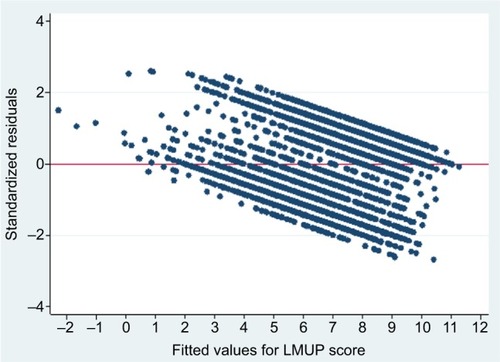
The standardized residuals were non-Normally distributed (), the variance of residuals was not constant across the values predicted by the model, and the mean of the residuals was positive for low predicted values and negative for high predicted values (), meaning that the assumptions were violated for the linear regression model. This is to be expected when applying linear regression to an outcome that is restricted to a range (here 0–12), and the problems are also evident in predicted values outside this range (). We note, however, that predicted values outside the range occurred only at the lower end, leading to negative values, and also these occurred only rarely (five of 4,244). Investigation of these five negative values revealed that these women were unusual in their clustering of a number of extreme values across several variables in an atypical combination (unmarried, short birth interval, large number of children, and previous depression). These women would thus have been expected to have highly unplanned pregnancies.
Figure 4 Standardized residuals from linear regression of our Malawi data.
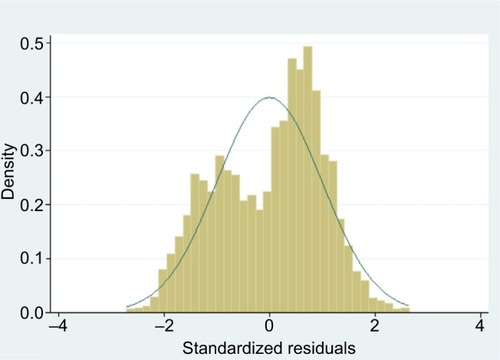
Figure 5 Scatterplot of standardized residuals against predicted values to show the variance of residuals from linear regression of our Malawi data.
Given a large sample size, it is possible to relax the assumptions slightlyCitation34 and, to help accommodate the non-Normal distribution of the residuals and the heteroscedasticity of the variance, robust (or Huber–White) standard errors can be calculated.Citation34 The calculation of these standard errors makes no assumptions about the underlying probability model, but instead estimates them from the variability in the data. This method tends to result in larger standard errors and wider CIs. The result of these violations is that while the model is suitable to assess the existence of associations, there may be some slight errors in the estimations of the coefficients and their standard errors. We found broadly linear associations between continuous factors and the LMUP when plots were examined, and thus retained simple linear terms in our models.
Assessment of logistic binary regression
Some differences were observed with regard to which factors were statistically significant between the two binary logistic models, underlining the impact of selecting the cut point and importance of selecting a cut point that is scientifically meaningful. However, the differences seen between odds ratios were generally modest. The cut point at the theoretically valid division of pregnancies into intended and unintended was more justifiable than the data-driven median cut point, and was taken forward for further consideration.
Assessment of ordinal logistic regression
There were some minor differences with regard to which factors were statistically significant in each model, such as no tribe being significantly different from Chewa in LMUP all but the Ngoni tribe being significantly different to Chewa in LMUP 3. Tests confirmed that both models violated the proportional odds assumption at P<0.001.
Development of partial proportional odds ordinal logistic regression model
Comparing models where all variables were constrained to the proportional odds assumption with models where no variables were constrained confirmed that the proportional odds assumption was invalid for at least one variable in both the LMUP all and LMUP 3 models. Therefore, partial proportional odds ordinal logistic regression, where the assumption of proportional odds is relaxed for some variables, was attempted for both the full LMUP scale and the LMUP in three groups. However, the LMUP all model could not be fitted without a large proportion of the women having a negative outcome probability, and was thus dropped.
Selection of type of multivariate regression model
We identified three potential regression models to investigate further: linear regression using robust standard errors, binary logistic regression at the “planned” pregnancy cut point, and a partial proportional odds ordinal logistic regression model using the LMUP score grouped into three. The coefficients and odds ratios for these models are shown in . The variables for which the proportional odds assumption had to be relaxed, of which there were six, are shown in italics. These variables had different odds ratios across the two cut points. By relaxing the assumption of proportional odds, we are able to see which variables are associated with pregnancy intention in each of the categorizations and how their effect size differs across these cut points (shown in italics in ), which is of interest in itself.
Table 3 Comparison of three multivariate regression models using our Malawi data
The findings are relatively consistent across the models, and for variables where the findings are labeled as different, these differences are generally modest. The partial proportional odds ordinal logistic regression model is the “best” model, as it is flexible and its assumptions have not been violated, but each model has different strengths and weaknesses.
Analysis of UK LMUP dataset
Univariate analysis, shown in , found very minimal differences with regard to which variables were statistically significant across the models. The results of the four multivariate regressions – linear, Log plan logistic regression, and the two ordinal regressions LMUP all and LMUP 3 – are shown in . Those shown in bold were significant at P<0.05. The findings were the same for all variables in every model, with the exception of ethnicity, where there were a few small differences.
Table 4 Findings from the univariate analyses of the original UK data for the four regression models
Table 5 Comparison of four multivariate regression models using the original UK data
For linear regression, while the distribution of the residuals was roughly Normal, the variance and mean were not constant across the range of predicted values, as was also seen in the Malawi data (data not shown). There were no predicted values outside the range of 0–12. The only difference between the two ordinal logistic models was that being of Asian ethnicity was statistically significantly associated with LMUP score in the LMUP all model, but not in the LMUP 3 model. The LMUP all model violated the proportional odds assumption, whereas there was some evidence that the LMUP 3 model violated the assumption (P=0.075). Again, a partial proportional odds model could not be fitted for the full LMUP score. For the LMUP 3 model, relaxing the assumption of proportionality of odds for one indicator variable (not living with husband or partner relative to living with husband) resulted in a model that did not violate the assumption of proportional odds for any other covariates (data not shown).
Discussion
While the assumptions of Normality of standardized residuals and constant variance were violated for the linear regression of the Malawian data, robust standard errors, which allows a model that contains heteroscedastic residuals to be fitted, can be used. We note also that predicted values outside the range 0–12 occurred rarely in this data and not at all in the UK data. The linear model has two significant advantages over the other models. First, it uses the full range of LMUP scores from 0 to 12, and second the results enable you to see how women vary across the LMUP scale. For example, using the linear regression on the Malawi data, we can say that on average an unmarried woman has an LMUP score that is 3.72 (95% CI 3.06–4.37) points lower than a married woman, having controlled for the other variables in the model ().
The main drawback of the binary logistic model, using nine as the cut point above which the pregnancy is considered “planned”, is the resultant loss of information and efficiency, having converted the ordinal 13-point scale to a binary outcome. It also only gives us an estimate of effect over one cut point.
It was not possible to calculate a stable partial proportional odds ordinal logistic regression model using the whole LMUP score in either dataset, meaning that the scores had to be collapsed to the three groups. This again resulted in a loss of information and efficiency; however, this gives estimates of effect across two cut points, as opposed to one, as in the binary logistic model. The interpretation of these odds ratios is arguably less intuitive. For example, in the Malawi data, for number of live children, which does not violate the proportional odds assumption and thus has the same odds ratios across both cut points, we can see that for every additional child, a woman in the unplanned or ambivalent group had 0.69 (95% CI 0.64–0.73) the odds of being in the ambivalent or planned group, respectively (). For mothers aged 15–17 relative to 18–29 years, a variable that does not have proportional odds, women had 0.45 (95% CI 0.33–0.61) the odds of being in the ambivalent or planned groups rather than in the unplanned group and 0.57 (95% CI 0.43–0.77) the odds of being in the planned group rather than the unplanned or ambivalent groups.
When the proportional odds assumption is violated, then this also raises some concerns over the validity of the linear regression. For example, our findings suggest that the effect of mother’s age is different when changing from unplanned to ambivalent compared to changing from ambivalent to planned. This calls into question the assumption in linear regression of a constant effect of mother’s age across all values of the LMUP.
There are few studies that have compared different types of regression or cut points on the same data. Norris et al compared linear, logistic, and ordinal regression models, using two different cut points for logistic regression and the proportional odds model, to analyze quality-of-life data.Citation35 They found that linear and ordinal regressions had “similar and smaller confidence end-point ratios [the upper CI divided by the lower CI, a measure of parameter stability] when compared to the binary logistic models”, indicating that these models were more precise. It should be remembered, though, that these two models are not strictly comparable, as in the logistic regressions the size of the CI depends in part on the magnitude of the odds ratio. They also noted that the interpretation of these models was simpler. However, no one model is de facto better than any other, and the choice of model should depend on the aim of the analysis and considerations of model goodness of fit.
Limitations
This paper has focused on statistical issues surrounding the use of the LMUP as an outcome measure. However, the models we considered do not allow a consideration of causality, which would require more sophisticated analyses. Nevertheless, the points raised here will be useful for researchers considering these analyses. Furthermore, this paper did not address the issues of using the LMUP as an independent variable, where similar difficulties with regard to the correct choice of analysis models may apply.
Conclusion
Our analysis has shown that there are no important differences in findings between different regression models using LMUP score as the outcome variable. This was true for two separate datasets. We recommend that linear regression is used as a first-line analysis, even though the assumptions of constant mean and variance of the residuals across fitted values were violated in both datasets, because the full range of the LMUP score is used and for ease of analysis and interpretation. Researchers may have discounted this approach, given the nature of the LMUP score; however, the use of robust standard errors where needed can help to account for the violation of some of the assumptions behind a linear regression model.
Researchers could explore ordinal logistic regression using the full range of LMUP scores with their own data, but they may find that violation of the assumptions of this model requires a partial proportional odds ordinal logistic model to be fitted instead. This may further require the LMUP score to be collapsed to three groups, resulting in loss of information. Binary logistic regression is the least-favored option, given the loss of information. Where this option is chosen, we recommend using the standard cut point of 9/10 to distinguish between unplanned and planned pregnancies.
Unplanned pregnancies may be associated with a range of adverse outcomes for the mother and baby,Citation36–Citation38 and their reduction is a common aim of public health programs. The growing number of studies using the LMUP to measure pregnancy intention is a testament to its increasing recognition as a more valid outcome measure than those used to date. The use of the LMUP score allows us to develop a more nuanced understanding of women’s pregnancy intention and the determinants of unplanned pregnancy, meaning that prevention programs can be better tailored and targeted to women’s needs. The recommendations made in this paper support the expanding use of the LMUP by providing guidance for analyses using the LMUP to improve standardization and comparability of results. This will facilitate the use of the LMUP as a PROM to evaluate family planning and preconception care programs.
Author contributions
JAH had the idea for the paper and conducted the analysis with input and advice from GB and AC. All authors contributed to drafting and critically revising the paper, gave final approval of the version to be published, and agree to be accountable for all aspects of the work.
Acknowledgments
We would like to thank the LMUP team field-workers who collected the data used in this analysis, as well as all the women who consented to take part in the study from which these data were drawn. This study was funded by a 3-year personal Research Training Fellowship from the Wellcome Trust to Dr JA Hall: award 097268/Z/11/Z. The funders had no role in the design, collection, analysis, or interpretation of data, in the writing of the manuscript, or in the decision to submit the manuscript for publication.
Disclosure
The authors report no conflicts of interest in this work.
References
- SedghGSinghSHussainRIntended and unintended pregnancies worldwide in 2012 and recent trendsStud Fam Plann201445330131425207494
- SinghSDarrochJAdding It Up: Costs and Benefits of Contraceptive ServicesNew YorkGuttmacher Institute2012
- ClelandJConde-AgudeloAPetersonHRossJTsuiAContraception and healthLancet2012380983714915622784533
- SantelliJRochatRHatfield-TimajchyKThe measurement and meaning of unintended pregnancyPerspect Sex Reprod Health20033529410112729139
- JoyceTKaestnerRKorenmanSOn the validity of retrospective assessments of pregnancy intentionDemography200239119921311852837
- BachrachCANewcomerSIntended pregnancies and unintended pregnancies: distinct categories or opposite ends of a continuum?Fam Plann Perspect199931525125210723654
- BarrettGSmithSWellingsKConceptualisation, development and evaluation of a measure of unplanned pregnancyJ Epidemiol Community Health200458542643315082745
- BarrettGWellingsKWhat is a ‘planned’ pregnancy? Empirical data from a British studySoc Sci Med200255454555712188462
- PetersenRMoosMDefining and measuring unintended pregnancy: issues and concernsWomens Health Issues1997742342409283277
- SantelliJSLindbergLDOrrMGFinerLBSpeizerIToward a multidimensional measure of pregnancy intentions: evidence from the United StatesStud Fam Plann20094028710019662801
- SpeizerISSantelliJSAfable-MunsuzAKendallCMeasuring factors underlying intendedness of women’s first and later pregnanciesPerspect Sex Reprod Health200436519820515519962
- StanfordJBHobbsRJamesonPDeWittMJFischerRCDefining dimensions of pregnancy intendednessMatern Child Health J20004318318911097506
- HallJBarrettGMbwanaNCopasAMalataAStephensonJUnderstanding pregnancy planning in a low-income country setting: validation of the London Measure of Unplanned Pregnancy in MalawiBMC Pregnancy Childbirth20131320024188251
- MorofDSteinauerJHaiderSLiuSDarneyPEvaluation of the London Measure of Unplanned Pregnancy in a United States population of womenPLoS One201277e3538122536377
- RoccaCHKrishnanSBarrettGWilsonMMeasuring pregnancy planning: an assessment of the London Measure of Unplanned Pregnancy among urban, south Indian womenDemogr Res20102329333421170147
- BorgesALBarrettGDos SantosOANascimentoNCCavalhieriFBFujimoriEEvaluation of the psychometric properties of the London Measure of Unplanned Pregnancy in Brazilian PortugueseBMC Pregnancy Childbirth20161624427557860
- RoshanaeiSShaghaghiAJafarabadiMAKoushaAMeasuring unintended pregnancies in postpartum Iranian women: validation of the London Measure of Unplanned PregnancyEast Mediterr Health J201521857257826446528
- RoccaCHKimportKGouldHFosterDGWomen’s emotions one week after receiving or being denied an abortion in the United StatesPerspect Sex Reprod Health201345312213124020773
- BiggsMAGouldHFosterDGUnderstanding why women seek abortions in the USBMC Womens Health2013132923829590
- LewisLNDohertyDAHickeyMSkinnerSRPredictors of sexual intercourse and rapid-repeat pregnancy among teenage mothers: an Australian prospective longitudinal studyMed J Aust2010193633834220854238
- LakhaFGlasierAUnintended pregnancy and use of emergency contraception among a large cohort of women attending for antenatal care or abortion in ScotlandLancet200636895491782178717113427
- WellingsKJonesKGMercerCHThe prevalence of unplanned pregnancy and associated factors in Britain: findings from the third National Survey of Sexual Attitudes and Lifestyles (Natsal-3)Lancet201338299071807181624286786
- RassiAWattimenaJBlackKPregnancy intention in an urban Australian antenatal populationAust N Z J Public Health201337656857324892156
- BackhausenMGEkstrandMTydénTPregnancy planning and lifestyle prior to conception and during early pregnancy among Danish womenEur J Contracept Reprod Health Care2014191576524229390
- The London Measure of Unplanned Pregnancy (LMUP) [homepage on the Internet]. Studies using the LMUP, 2017 [webpage on the Internet] Available from: http://www.lmup.com/studies.htmAccessed February 23, 2017
- FrayneDJVerbiestSChelmowDHealth care system measures to advance preconception wellness: consensus recommendations of the clinical workgroup of the National Preconception Health and Health Care InitiativeObstet Gynecol2016127586387227054935
- The London Measure of Unplanned Pregnancy (LMUP) [homepage on the Internet] Available from: http://www.lmup.com/Accessed February 23, 2017
- RahangdaleLStewartAStewartRDPregnancy intentions among women living with HIV in the United StatesJ Acquir Immune Defic Syndr201465330631124525467
- ScottSCGoldbergMSMayoNEStatistical assessment of ordinal outcomes in comparative studiesJ Clin Epidemiol199750145559048689
- AnanthCVKleinbaumDGRegression models for ordinal responses: a review of methods and applicationsInt J Epidemiol1997266132313339447413
- ArmstrongBGSloanMOrdinal regression models for epidemiologic dataAm J Epidemiol198912911912042910061
- HallJABarrettGPhiriTCopasAMalataAStephensonJPrevalence and determinants of unintended pregnancy in Mchinji District, Malawi; using a conceptual hierarchy to inform analysisPLoS One20161110e016562127798710
- RabinRFJenningsJMCampbellJCBair-MerrittMHIntimate partner violence screening tools: a systematic reviewAm J Prev Med2009365439445.e419362697
- KirkwoodBSterneJEssential Medical Statistics2nd edMalden, MABlackwell Science2003
- NorrisCMGhaliWASaundersLDOrdinal regression model and the linear regression model were superior to the logistic regression modelsJ Clin Epidemiol200659544845616632132
- GipsonJDKoenigMAHindinMJThe effects of unintended pregnancy on infant, child, and parental health: a review of the literatureStud Fam Plann2008391183818540521
- ShahPSBalkhairTOhlssonABeyeneJScottFFrickCIntention to become pregnant and low birth weight and preterm birth: a systematic reviewMatern Child Health J201115220521620012348
- TsuiAOMcDonald-MosleyRBurkeAEFamily planning and the burden of unintended pregnanciesEpidemiol Rev201032115217420570955
- The London Measure of Unplanned Pregnancy (LMUP) [homepage on the Internet]. Download the LMUP 2017 [webpage on the Internet] Available from: http://www.lmup.com/download.htmAccessed February 23, 2017