Abstract
Background:
The Oxford elbow score (OES) is a patient-rated, 12-item questionnaire that measures quality of life in relation to elbow disorders. This English questionnaire has been proven to be a reliable and valid instrument. Recently, the OES has been translated into Dutch and examined for its reliability, validity, and responsiveness in a group of Dutch patients with elbow pathology. The aim of this study was to analyze the Dutch version of the OES (OES-DV) in combination with Rasch analysis or the one-parameter item response theory to examine the structure of the questionnaire.
Methods:
The OES-DV was administered to 103 patients (68 female, 35 male). The mean age of the patients was 44.3 ± 14.7 (range 15–75) years. Rasch analysis was performed using the Winsteps® Rasch Measurement Version 3.70.1.1 and a rating scale parameterization.
Results:
The person separation index, which is a measure of person reliability, was excellent (2.30). All the items of the OES had a reasonable mean square infit or outfit value between 0.6 and 1.7. The threshold of items were ordered, so the categories can function as intended. Principal component analysis of the residuals partly confirmed the multidimensionality of the English version of the OES. The OES distinguished 3.4 strata, which indicates that about three ranges can be differentiated.
Conclusion:
Rasch analysis of the OES-DV showed that the data fit to the stringent Rasch model. The multidimensionality of the English version of the OES was partly confirmed, and the four items of the function and three items of the pain domain were recognized as separate domains. The category rating scale of the OES-DV works well. The OES can distinguish 3.4 strata. This conclusion can only be applied to elbow dislocations, which were the largest group of patients studied.
Introduction
The Oxford elbow score (OES) is a patient-rated 12-item questionnaire () that measures quality of life in relation to elbow disorders.Citation1 The development of this English questionnaire has involved Rasch analysis as well as analysis with classical test theory.Citation1 This English version comprises three domains, ie, elbow function, pain, and social-psychological factors. The answers are recorded on a five-point Likert scale. Every domain score is calculated for a final score that ranges from 0 (worst) to 100 (best). Another study reported responsiveness and minimal change for the OES following elbow surgery.Citation2 These studies showed that the OES questionnaire is a reliable and valid instrument. Recently, the 12 items of the OES were translated into Dutch according to the generally accepted rules for translation of non-Dutch questionnaires and examined for their reliability, validity, and responsiveness among a group of Dutch patients who had experienced elbow trauma.Citation3–Citation5 However, that study was performed with classical test theory (unpublished data). Modern test theory has many advantages, such as a thorough examination of dimensionality, analysis of the fit of the data to the Rasch model, and category function analysis.Citation6,Citation7 Therefore, the objective of this study was to analyze the Dutch version of the OES (OES-DV) with Rasch analysis or the one-parameter item response theory.
Table 1 The 12 items of the Oxford elbow score
Methods
The OES was translated into Dutch by four trauma surgeons. One clinician was also an epidemiologist with experience in clinimetrics. The four translated versions were compared, and the differences were resolved by discussion. The Dutch version of the OES was then back-translated to English by a certified English translator (and native English speaker). The four clinicians compared this back-translation with the original English version of the OES, and edited the Dutch translation to make it more accurate. After the translation process, mistakes were encountered in the tense of the Dutch version of questions seven and eight, which referred to pain during the past 4 weeks. These mistakes were found after the back-translation and were corrected.
The sample population consisted of 103 patients (68 female, 35 male). The mean age of the patients was 44.3 ± 14.7 (range 15–75) years. This group of patients consisted of 67 patients with elbow luxation, 24 patients with a recent fracture of the elbow region, seven patients with active epicondylitis, two patients who were undergoing arthrolysis of the elbow, and three patients with other elbow conditions (eg, bursitis).
Forty-three patients were randomly selected to complete a second OES following treatment for their elbow disorder after a mean follow-up of 52 ± 24.1 days; thus, 146 questionnaires were available for analysis. This group of 43 patients consisted of 19 patients with elbow luxation, 14 patients with a recent fracture of the elbow region, five patients with active epicondylitis, two patients who were undergoing arthrolysis of the elbow, and three patients with other elbow conditions (eg, bursitis).
Rasch analysis was performed with Winsteps measurement software (Winsteps® Rasch Measurement Version 3.70.1.1). The following analyses were performed: construction of the person and item or Wright map, testing of the (mis)fit between the data and the model, estimation of the person and item reliability and separation coefficient, testing of the ordering of the categories, and analysis of the dimensionality.
Results
Of the 146 observations collected, all were available for analysis, including 17 extreme scores. A rating scale parameterization was used because all the items had the same numbers of categories. The person and item map is shown in . The items on the right side are in order based on the logit scale. Natural logarithms of the odds are called logits and range from minus infinity to plus infinity. The default mean difficulty was set to zero. The OES covered about seven logits (range 5.08 to −1.60). The OES was coded with the highest values for the better patients and the lowest values for the bad cases. The item map also shows the hierarchy of the item difficulties on the right side. The items at the top are those items the patients easily endorsed. For example, item 1 (difficulty in lifting objects) was easier to confirm than item 12 (describing the pain usually experienced).
Figure 1 Person (n = 146) and item (12 items) or Wright map for the Oxford elbow score scale. Positive scores indicate better quality of life, whereas negative scores indicate poorer quality of life. Items from the scale are shown on the right side of the figure, and person measures are highlighted by “#” or “.”
Abbreviations: M, mean; S, one standard deviation from the mean; T, two standard deviations from the mean.
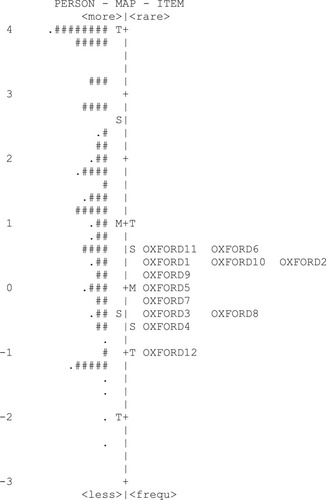
On the left of the Wright map the patient performances are represented by numbers. Most patients were located opposite and above the items (mean person estimate 1.04 ± 1.52), which was above the default mean item difficulty of zero; therefore, the items were moderately well targeted for this person group, meaning that the items represent the patients’ level of quality of life. Overall, the patient group had good OES scores, indicating few complaints concerning the affected elbow.
The item reliability coefficient was 0.95, and the item separation coefficient was 4.40. The person reliability was 0.84, and the person separation index was 2.30, so the reliability was good. Reliability coefficients have a ceiling of 1.0, but separation coefficients and indexes have no ceiling. The person separation was used to calculate the number of distinct levels of quality of life (strata) that the items could distinguish (Strata = [4 × person separation index + 1]/3) = 3.4.Citation8,Citation9 The strata that the OES distinguished was 3.4, which indicates that about three ranges could be differentiated.
The items are placed according to the hierarchy of the item difficulties in . The measures are the item difficulty estimates. Items 2, 6, 11, items 1, 2, 10, items 1, 8, 9, and items 3 and 8 had inter-item separations less than 0.15 logits, indicating overlap between these item difficulties.
Table 2 Item statistics, Oxford elbow score, Dutch version
The individual item fit statistics are presented in . To determine how well the empirical data fit the Rasch model, Chi-square fit statistics were calculated. These fit statistics are the infit mean square (Infit MNSQ) and the outfit mean square (Outfit MNSQ). The infit MNSQ represents the information-weighted mean square residual difference between observed and expected responses. The infit statistics are sensitive to unexpected responses near the person’s ability level. The outfit statistic is the usual unweighted mean square residual and is more sensitive to outliers. High infit and outfit reflect underfit, which means lack of predictability of an item. Low mean square infit and outfit reflect overfit, which means overpredictability of an item. Mean square infit or outfit values should range between 0.6 and 1.4 for rating scales or 0.5 to 1.7 for clinical observations.Citation7 All the items in the OES had reasonable mean square infit or outfit values between 0.6 and 1.7. Item 12 had the highest infit and outfit values of all the items, 1.70 and 1.53, respectively, indicating some under-fit, which means an unpredictable interpretation (ie, erratic response or noise).
presents the functioning of the five categories of the OES Dutch version. All categories were well represented except for the zero category, which had a low frequency of 109 observations. The zero category included the patients with the worst quality of life; therefore, the low frequency is consistent with the few cases with a bad or very bad outcome. The observed average measures increased in a smooth distribution from −0.99 to 2.39. The threshold of the categories increased monotonically (so were never decreasing). None of the categories showed a misfit. shows the category probability curves of the categories with a smooth distribution. The thresholds were ordered. In this Rasch-Andrich model (one of the polytomous models), the rating scale structure was defined to be equal for all items. The category rating scale worked well.
Figure 2 Category probability curve of the Dutch version of the Oxford elbow score scale showing the probability of assigning to any particular category (y axis) given the difference in estimates between any patient quality of life measurement and any item difficulty. The threshold estimates correspond to the intersection of rating scale categories.
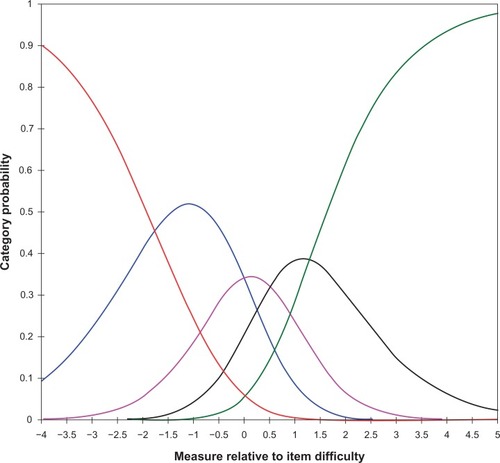
Table 3 Summary of the category structure of the Oxford elbow score, Dutch version
According to Rasch theory, when the data fit the Rasch model, the Rasch dimension is the only dimension in the data. Rasch factor analysis is a factor analysis of the residuals that remain after the linear Rasch measure has been extracted from the data set. A secondary dimension in the data must explain at least two items (also called 2.0 Eigenvalue units) worth of variance, ie, unless a component has the strength of at least two items it may merely be due to an idiosyncratic item. A Rasch principal component analysis (PCA) of the residuals of the OES-DV was performed. The raw variance of the OES explained by the Rasch measure was 36.2% (expected by the model 35.7%). The unexplained variance in the first contrast was 7.4% (2.4 Eigenvalue units), and in the second contrast was 6.0% (2.0 Eigenvalue units). The first contrast consisted of three of the four pain items. The second contrast consisted of the function items 1 to 4.
Discussion
Rasch analysis of the OES-DV showed that the data fit to the stringent Rasch model. The person separation index as a measure of reliability was high. Three statistically distinct levels of quality of life, ie, good, intermediate, and poor, could be differentiated by the OES-DV. The category rating scale of the OES-DV worked well. The patients could discriminate the five levels of the items.
Our factor analysis of the OES-DV with the classical test theory showed only one factor, which is in contrast with the original English version (unpublished data). Factor analysis of the English OES showed three domains, ie, function, pain, and socio-psychological.Citation1 In the Rasch analysis, the PCA was performed on the differences between the model and observed data, called residuals. The multidimensionality was partly confirmed by the PCA of the residuals of the OES-DV. The four items of the function and three items of the pain domain were recognized as separate domains. Two contrasts had a strength of two or more Eigenvalue units. This supports the idea that the OES-DV is a multidimensional instrument. The difference in dimensionality between the OES-DV and the original OES can be explained by differences in the composition of the study population, context, intervention, and timing of assessments. Our study population, which consisted mainly of elbow dislocations, was very different from the original developmental study.
This study had several limitations, including a small sample size and a homogeneous patient population (ie, patients with elbow trauma). Our conclusions can only be applied to elbow dislocations, which were the largest group of patients studied. A flaw in our study is that we did not ask the patients to predict the hierarchy of the Wright map and use these predictions to study the predictive validity of the OES-DV. We could have asked the patients to order the items according to how difficult they were to perform and endorse them positively or negatively. If the order of difficulty of the items was correctly predicted by the patients, this would have enhanced the validity of the OES. Another limitation was the poorly targeted population. Patients on the poor side of the quality of life spectrum were missing. Future studies with the OES-DV should examine patients with other types of elbow disorders in a larger population, because dimensionality examinations of questionnaires are influenced by the study population, and the greater the sample size, the greater the power in detecting misfit.
Conclusion
Rasch analysis of the OES-DV showed that the data fit the stringent Rasch model. The multidimensionality of the English version of the OES was partially confirmed. The four items of the function and three items of the pain domain were recognized as separate domains. The category rating scale of the OES-DV worked well. The OES distinguished 3.4 strata. This conclusion can only be applied to elbow dislocations, which were the largest group of patients studied.
Acknowledgements
Oxford and Isis Outcomes, a part of Isis Innovation Limited, are acknowledged for their kind support. Oxford Elbow Score © Isis Innovation Limited, 2008. All rights reserved. The authors, Professor Ray Fitzpatrick and Dr Jill Dawson, have asserted their moral rights.
Disclosure
The authors report no conflicts of interest in this work.
References
- DawsonJDollHBollerIThe development and validation of a patient-reported questionnaire to assess outcomes of elbow surgeryJ Bone Joint Surg Br20089046647318378921
- DawsonJDollHBollerIComparative responsiveness and minimal change for the Oxford Elbow Score following surgeryQual Life Res2008171257126718958582
- BeatonDEBombardierCGuilleminFFerrazMBGuidelines for the process of cross-cultural adaptation of self-report measuresSpine2000253186319111124735
- FloorSOverbekeAJQuestionnaires on the quality of life in other than the Dutch language used in the Nederlands Tijdschrift voor Geneeskunde (Dutch Journal of Medicine): the translation procedure and arguments for the choice of the questionnaireNed Tijdschr Geneeskd200615017241727 Dutch.16924945
- GuilleminFBombardierCBeatonDCross-cultural adaptation of health-related quality of life measures: literature review and proposed guidelinesJ Clin Epidemiol199346141714328263569
- BondTGFoxCMApplying the rasch model. Fundamental measurement in the human sciences2nd edMahwah, NJLawrence Erlbaum Associates2007
- TennantAConaghanPGThe Rasch measurement model in rheumatology: what is it and why use it? when should it be applied, and what should one look for in a Rasch paper?Arthritis Rheum2007571358136218050173
- FisherWPJrReliability statistics. Rasch measurement transactions1992 Available from: http://www.rasch.org/rmt/rmt63i.htm. Accessed May 3, 2011.
- WrightBDMastersGNumber of person or item strata. Rasch measurement transactions2002 Available from: http://www.rasch.org/rmt/rmt163f.htm. Accessed May 3, 2011.