
Abstract
Background
Geographical maldistribution has been a critical concern of health workforce planning in Thailand for years. This study aimed to assess the equity of health workforce distribution in public hospitals affiliated to the Office of Permanent Secretary (OPS) of the Ministry of Public Health (MOPH) through the application of “concentration index” (CI).
Methods
A cross sectional quantitative design was employed. The dataset comprised 1) health workforce data from the OPS, MOPH in 2016, 2) regional and provincial-level economic data from the National Economic and Social Development Board in 2015, and 3) population data from the Ministry of Interior in 2015. Descriptive statistics, Spearman’s rank correlation, and CI analysis were performed.
Results
Thailand had 2.04 health professionals working in public facilities per 1,000 population. Spearman’s correlation found positive relationship in all health professionals. Yet, statistical significance was not found in most health professionals but doctors (P<0.001). Positive correlation was observed in all health cadres at regional and provincial hospitals (rs=0.348, P=0.002). In the CI analysis, the distribution of health professionals across provincial income was relatively equitable in all cadres. Significant CIs were found in doctor density (CI =0.055, P=0.001), all professionals density at district hospitals (CI =–0.049, P=0.012), and all professionals density at provincial and regional hospitals (CI =0.078, P=0.003).
Conclusion
The positive CIs implied that the distribution of all health professionals, especially doctors, at provincial and regional hospitals slightly favored the richer provinces. In contrast, the distribution at district hospitals was slightly more concentrated in less well-off provinces. From a macro-view, the distribution of all health professionals in Thailand was relatively equitable across provincial economic status. This might be due to the extensive health infrastructure development and rural retention policies over the past four decades.
Introduction
A well-functioning health system requires an adequate number of capable, motivated, and well-supported health workers.Citation1 In recent years, health workforce planning has attracted increasing attention from policy makers, health care managers, and academics in many regions.Citation2 This is because health workforce is widely recognized as the rate-limiting step of every function of a health system.Citation2 In addition, today is an era where the world is progressing towards Universal Health Coverage (UHC). Several countries and international development agencies have pledged a full support on, and committed to achieve UHC by 2030. This global movement is also corroborated by the Sustainable Development Goals (SDGs), particularly SDG3.8.Citation3 To achieve UHC, a country needs a careful design in health workforce planning and development.
Yet, one of the most critical (but often neglected) aspects in health workforce planning is a fair distribution of human resources for health (HRH) to meet health needs of a population. Shortage of health workforce in rural or disadvantaged areas has been a vital problem that always hampers health system strengthening.Citation1,Citation4 The Word Health Organization (WHO) attempted to tackle HRH maldistribution by launching the “Global Policy Recommendations for Increasing Access to Health Workers in Remote and Rural Areas through Improved Retention” in 2010.Citation4 A number of measures were suggested, for instance, recruiting many more students from rural background, providing financial incentives for health workers in rural areas, and compulsory service in rural areas for new health professional graduates.Citation4
Thailand is an upper-middle-income country where health workforce has been in the spotlight of the policy dialogs for years. Note that the country has extensive experiences in health care system development, especially in terms of infrastructure and human resources investment. Between 1960 and 1975, according to the National Health Development Plan, the government agenda was geared towards speedy development of health and education.Citation5 Accordingly, the district health system development project was launched in 1977 to provide all districts with full geographical coverage of district hospitals and health centers. All district hospitals are mandated to be filled by doctors and nurses. The infrastructure improvements were followed by the engagement of a larger health workforce. The number of physicians grew tremendously, from 8,000 in 1985 to over 40,000 in 2013 – a five-fold increase in almost three decades and more than a three-fold increase in nurses during the same period.Citation6,Citation7 The establishment of medical and nursing schools, particularly those outside Bangkok, contributed to a considerable rise in the country’s capacity to produce physicians and nurses. With the long-term investment in health care infrastructure and human resources, Thailand achieved UHC in 2002 through the introduction of the Universal Coverage Scheme.Citation6
Despite a marked increase in health workforce production for the Thai health care system, maldistribution problem has yet to be solved adequately. This is evidenced by the marked difference in health workforce density between regions. Noree reported that physician density in the central region was 12-fold better than that in the Northeast, an area with the lowest economic growth in all Thai regions (1:1,000 in vs 1:12,000), and this gap has not been significantly reduced since 2001.Citation8 Such a difference was also observed in other professionals. Pagaiya and Hongthong highlighted that the corresponding figure was even worse in dentists.Citation9
Though, so far there have been some studies on HRH distribution in Thailand (the said studies are some instances), there exist some key knowledge gaps. Some examples of this notion are as follows. First, the monitoring of health workforce maldistribution is not frequently updated. Second, most recent analyses explored health workforce data at a regional level without delving into individual provincial data. Third, the interested workforce was mostly limited to physicians without adequate examination on other professionals. Last, most recent studies applied the difference in health workforce density between regions as the sole indicator for measuring maldistribution. At present, there is a growing trend in employing econometric tools in measuring health resource distribution. One of the most well-known tools in the econometric arena is concentration index (CI), proposed by the World Bank. A critical advantage of the CI is it can represent the “equity” in health resource distribution relative to economic disparity.Citation10 The benefits and downsides of the CI are discussed later in the “Discussion” section.
This study therefore aims to assess the equity of health workforce distribution in Thailand through the application of CI. It is hoped that findings from this research will help inform policy makers, health care managers, and academics in the field concerning the situation of the distribution of HRH in Thailand, and this may ultimately lead to a better health workforce planning in the long run.
Methods
Data sources and study design
This study applied a cross-sectional quantitative approach, using provincial-level data. The dataset comprised 1) health workforce data and 2) provincial-level economic and population data. We obtained health workforce data from the midyear national health professional annual survey conducted by the Office of Permanent Secretary (OPS) of the Ministry of Public Health (MOPH) which is publicly accessible through the official website of the Strategy and Planning Division.Citation11 Health professionals in this respect comprised doctors, nurses, dentists, and pharmacists working in district hospitals and provincial/regional hospitals affiliated to the OPS. We excluded health professionals working in Bangkok as none of the health facilities in Bangkok are managed by the OPS. The majority of health facilities in Bangkok are either privately run or affiliated to the Bangkok Metropolitan Administration. We used data of the four health professionals from year 2016. We retrieved regional- and provincial-level economic and population data from the official websites of the National Economic and Social Development Board and the Bureau of Registration Administration of the Ministry of Interior.Citation12,Citation13 The economic and population data were from year 2015, as at the time of writing the 2016 data was not yet published.
Note that we also planned to perform subgroup analysis by differentiating types of doctors (general practitioners [GP] vs specialists). We retrieved the latest numbers of GP and specialists from the website of the Strategy and Planning Division, the OPS.Citation11 However, we found that the complete data of specialists were aggregated at regional level, not provincial level. With this situation, the size of specialists data was too small (four data points, according to the four regions in Thailand), rendering difficulty in assessing CI. Accordingly, the comparison between GP and specialists was presented by descriptive statistics only; while the macro picture of the four professionals was analyzed by CI as planned.
Data analysis
The analysis was composed of three parts. First, we performed descriptive statistics to present the overview of the data. Second, we determined association between the density of health professionals (health professionals to population ratio) and the provincial economic level by Spearman’s rank correlation. In the last step, we assessed the equity in health professional distribution, relative to the provincial economy by CI. The CI can be acquired from regressing 2α2r(hi/μ) on ri, as proposed by the World Bank;Citation10 where the coefficient β represents point estimate of the CI, α2r denotes the variance of the fractional economic rank, hi is the health variable of interest (in this case, health professionals per population ratio), μ is the mean of hi, and ri is the rank of population unit. Statistical significance was determined at the 95% confidence level. We used STATA software v14 (serial license number: 401406358220) for all calculations. The CI will take positive value (from 0 to +1) when health variables are concentrated among the better-off groups (in this case, provinces). In contrast, it will take negative value (from 0 to −1) when health variables are concentrated among the poorer provinces. The results were also graphically displayed by concentration curve (CC). The CC will lie above the 45-degree equality line should the CI take negative value, but will lie below the equality line if otherwise.
Results
Overall, Thailand had 2.04 health professionals working in OPS-affiliated public facilities per 1,000 population on average with a range between 0.83 and 3.98. This figure could be broken down into 0.27 for doctors, 1.56 for nurses, 0.08 for dentists, and 0.12 for pharmacists. The health professionals density was generally higher in regional and provincial hospitals combined (1.11 per 1,000 population) than in district hospitals combined (0.93 per 1,000 population). Standard deviation (SD) of nurse density was far greater than that of other professionals ().
Table 1 Descriptive statistics of density of health professionals in public hospitals in Thailand
Focusing specifically on doctors, the density of GP and specialists per 1,000 population relative to gross regional product (GRP) per capita is presented in . District hospitals (in all regions) had greater proportion of GP to 1,000 population than provincial and regional hospitals, the higher level facilities. With respect to the GRP, the central region and the southern region were the most and the second most well-off areas, respectively, and were areas with the greatest specialist-to-population density for regional and provincial hospitals.
Table 2 Density of GP and specialists in comparison with GRP per capita
Spearman’s correlation coefficients (rs), which reflect the degree of correlation between ranks of provincial health professional density and gross provincial product (GPP), are shown in . The analysis found positive relationship in all health professionals, which meant that the workforce density and the GPP tended to increase or decrease together. Yet, statistical significance was not found in most health professionals but doctors (P<0.001) where moderate-degree correlation was observed (rs=0.412). Positive correlation was also noted in the density of all health cadres at provincial and regional hospitals (rs=0.348, P=0.002). The only parameter that saw negative coefficient was density of health professionals at district hospitals despite without statistical significance (rs=–0.225, P=0.051).
Table 3 Spearman’s correlation coefficients between GPP and health professional density
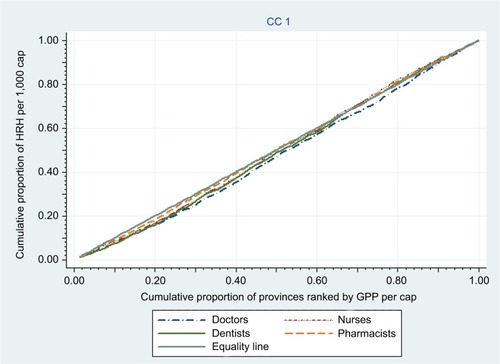
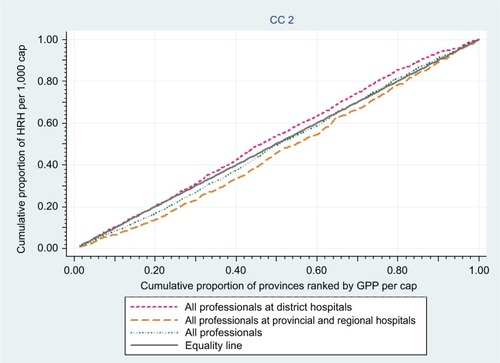
In the CI analysis, the distribution of health professionals across provincial income was relatively equitable in all cadres (). Significant CIs were found in certain variables, namely, doctor density (CI =0.055, P=0.001), all professionals density at district hospitals (CI =–0.049, P=0.012), and all professionals density at provincial and regional hospitals (CI =0.078, P=0.003). The positive CIs implied that the distribution of doctors and all health professionals at provincial and regional hospitals slightly favored the richer provinces while the negative CI suggested that health professionals at district hospitals were slightly more concentrated in provinces with less economic prosperity.
Table 4 CIs of health professionals in Thailand
The figures below demonstrate the equity in health workforce distribution with regards to perfect equality line. Consistent with the CIs, the CCs of all health professionals lie very close to the equality line. The curve for doctors concavely deviates furthest from the equality line, compared to other health cadres. It represented a relative concentration of doctors in the wealthier provinces. The curves for other health cadres minimally twigged across the equality line as they approached higher cumulative proportions, making the CIs for nurses, dentists, and pharmacists close to 0 ().
Figure 1 CCs of doctors, nurses, dentists, and pharmacists per 1,000 population.
compares the equity of health workforce distribution at two facility levels. The CC for district hospitals lying above the equality line suggested that health professionals in district hospitals tended to be concentrated in less better-off provinces. On the contrary, the curve for provincial and regional hospitals lies below the equality line, confirming a positive value of corresponding CI in .
Figure 2 CCs of health professionals by different facility levels.
Discussion
Overall, the above findings indicated that the distribution of HRH in OPS-affiliated hospitals across provincial economic status in Thailand was quite equitable, as evidenced by the close-to-zero CIs. Some possible explanations for this phenomenon are as follows.
First, the rural health infrastructure development policy during the 1970s–1990s ascribed this equitable distribution. The policy led to a full coverage of hospitals across geographical structure, ie, a district hospital in every district and a provincial hospital in every province, regardless of economic prosperity of the area.Citation14,Citation15 Staff positions were then allocated based on the size of population coverage.Citation16 By the late 1990s, the targeted coverage was achieved, resulting in the foundation of over 95 provincial hospitals, 725 district hospitals, and almost 9,800 subdistrict health centers throughout the entire country.Citation5,Citation17 In recent years, the number of health workforce in a public hospital is guided by full-time equivalent calculated from health demands, population ratio, and service target.Citation18 This means that the provincial economic level has not been taken into account as the priority in health workforce planning in Thailand. This factor might be one of many possible explanations for the (relatively) equitable distribution of health workforce in Thailand.
Second (and possibly the most important contributor) is the combined strategies to ensure the fulfilment of health workers in rural areas. The compulsory rural service policy instigated in 1972 required new medical graduates to spend at least 3 years in public facilities outside Bangkok. Later, dentists, pharmacists, and nurses trained in public schools were also enrolled in this program.Citation19 Rural recruitment, rural training, and hometown placement for medicine and nursing education were proved successful in retaining doctors and nurses in their hometowns.Citation20 Since 1970s, several forms of financial incentive have been implemented to attract doctors, dentists, pharmacists, and nurses to stay in rural areas. Such special allowances include remote hardship, non-private practice, non-official hour service, and long years of service.Citation21 Particularly for doctors, all allowances combined could make their total monthly income 5–10 times of their basic salaries.Citation20,Citation22 Other non-financial incentives, such as social recognition, career advancement, opportunities for higher education, and policy that requires experience of public service as a prerequisite for specialist training, also played crucial role.Citation20,Citation21
Although these strategies have collectively contributed to the equitable distribution of health workforce in Thailand, the success of each has varied across times. For example, compulsory rural service policy was the most successful in addressing external migration and rural shortage before the rapid economy growth in the 1990s;Citation23 but during the economic boom, private hospital mushrooming had siphoned out around one-thirds of doctors from public service in 1997. Additional strategies, ie, rural recruitment, rural training, and hometown placement were strengthened in early 2000s with an aim to reverse such situation.Citation23–Citation25 Financial incentives, despite some contributions, are not the only reason that retains health professionals in public sector. This is because private hospitals are almost always able to offer far higher salary than public facilities.Citation26 In recent years, the prerequisite public service for specialist training appears to play significant role in attracting medical graduates to rural hospitals (at least for certain years).Citation23 This means all policies require regular reviews to maintain their effectiveness and should be adaptive enough to the changing environments.
Despite quite a fair equitable distribution of health workforce at the entirety, there are some degrees of inequity across professionals working in different levels of health facilities. A couple of worth-noting points are as follows. First, looking closer in details, the distribution of all professionals at district hospitals showing pro-poor effect to some extent reflects the success of rural retention policy through several interventions as described above. The pro-rich effect among provincial and regional hospitals can be explained by the fact that most regional hospitals situate in more urbanized and populated cities where GPPs per capita are generally higher.Citation12,Citation27 With the capacity of 500–1,000 beds on average and more advanced technologies, these provincial and regional hospitals are generally staffed with higher number of health personnel especially specialists and sub-specialists than district hospitals.
Second, and linked to the aforementioned point, the doctor distribution was relatively more pro-rich than other health professionals. This is confirmed by the slight (but significant) pro-rich CI in doctors while the CIs in other professionals (despite showing a slight pro-rich effect) did not show a statistical significance. Both Spearman’s correlation and CI analyses also confirmed this observation. A potential explanation is that medical doctors generally have better opportunities to find additional income from dual practice. Some doctors serving as full time staff in public facilities may work part-time in private hospitals or open their private clinics, rendering a fair amount of income which is at times greater than the public salaries. This situation is more pronounced in richer provinces where people have more ability to pay. There was a study showing that public obstetricians’ earning from private practice could make 55% of their total incomes.Citation28 The openness of opportunities to perform private practice leads to concerns over several issues, such as quality of care between public and private patients, a siphoning of patients to private clinics, and public time corruption.Citation29–Citation32 Exemplary evidence from Ferrinho et al flagged this point by suggesting that private patients cared by dual-practice obstetricians had three-fold higher cesarean section rate than non-private patients.Citation33 Unfortunately, evidence from Thailand that explores the role of private sector in depth has not been widely published. Though the above discussion about how private sector affects health workforce distribution is slightly beyond the scope of this study, this issue undoubtedly has much policy importance, and of course, further studies on this issue are necessitated.
Apart from doctors, other professionals may also enjoy similar benefits should they stay in big cities but to a lesser extent. This point may lead to some policy implications, ie, promoting rural services by task-shifting policy. This is because, according to the findings above, nurses and pharmacists are more likely to remain the less well-off provinces compared to doctors (as their CIs were less pro-rich relative to doctors and dentists). Therefore, task-shifting policies targeting other professionals (aside from doctors) are likely to complement other rural retention policies in Thailand. A great amount of literature shows that task-shifting policy has been proven successful in equitably addressing population health needs in many countries, including Thailand.Citation34–Citation36
To our knowledge, this study is one of the very first pieces of research that applies CI in the HRH area, relative to socioeconomic status. Actually, there exists some literatures that use CI in the health systems field, but those studies mostly compare disparity of the populations’ health status with socioeconomic status or compare the distribution of health workforce with other variables such as population size, geographical areas, or health utilization data.Citation37–Citation44 It should be noted that there is a recently published study by Sun, which examines the inequity of health materials and health workforce in Guangxi, China.Citation45 However, it is difficult to compare health workforce inequality magnitude between Thailand and China due to some reasons. First, Sun’s study is confined to a single region of China whereas our study uses nationwide dataset, and second, the economic indicators used to construct CI are not consistent between studies. A seemingly lack of studies that apply CI in HRH area coincides with the WHO report which highlights that health worker is the “most critical factor” driving health system performance but is often “neglected” and “overlooked”.Citation46
Despite a thorough analysis, this study still faced some limitations. Here are some examples. First, the scope of the data is confined only in public hospitals within the OPS. However, public hospitals outside the OPS (such as medical schools under public universities, military hospitals, and mental health hospitals) and private hospitals, numbering around 36% of all hospitals in Thailand were not included into the study due to data unavailability and limited study period.Citation47 Private hospitals are mostly run for profit and sensitive to economic status of the people. These hospitals are concentrated in affluent areas of the country. The most recent hospital survey found that 30% of all private hospitals were located in Bangkok.Citation47 Previous and current statistics consistently highlighted stark imbalance of health professionals between Bangkok and the poorest provinces.Citation27,Citation48,Citation49 Should Bangkok and non-OPS hospitals be included in this research, the overall result would show more pro-rich estimate.
Second, this study used GRP and GPP as proxies for socioeconomic status. It captures economic aspect at provincial level which may not necessarily represent household’s socioeconomic status. For example, Rayong has the highest GPP per capita possibly because it is an industrial area where Map Ta Phut industrial port is located. In other words, the provincial GPP is mostly driven by industrial sector and may not perfectly represent economic prosperity of the residents.
Third, the sample size of this study is quite limited. That is, the researchers analyzed data at the provincial level only, rendering 76 data points included. The small number of samples might be a possible explanation for the lack of statistical significance in most results. Thus, future studies are recommended to delve into district- or subdistrict-level data, which will not only result in the larger number samples, but also enable the researchers to have a clearer insight on the micro-economy of the studied areas.
Fourth, data quality and data completeness are always an issue. This point is evidenced by our attempt to further investigate the distribution of subcategories of doctors (ie, GP and specialists) through the index. However, the index was not analyzed due to the incompleteness of medical specialists data at provincial level (actually the index could be analyzed but it would not show a meaningful interpretation given very small data points). This is quite unfortunate but on the other hand it can be viewed as opportunity for improvement of the public data source. Therefore, repeating similar kind of studies on a more completed dataset is recommended.
Fifth, the interpretation and the application of the above findings to the real world practice should be made with caution. When comparing CIs across studies, the assessors need to make sure that the unit used for constructing economic rank is comparable. Comparing CIs over time within a certain area is a more practical approach, but this necessitates well-established data collection process over time – a major hindrance found in many developing countries. For the sake of Thailand, it is hoped that the ongoing improvement of the OPS’ health workforce database will enable health systems researchers and academics in relevant fields to conduct more in-depth analyses on several inequity measurements (such as CI, Theil index, and Slope Index of Inequality) in the near future.Citation50,Citation51
Last but not least, the close-to-zero CIs as observed in all studied health professionals do not mean that the Thai health system does not experience health workforce shortage. The bottom line is the CI is just a tool for quantifying inequitable distribution of the variable of interest against economic gradient of the studied areas. If the degree of health workforce maldistribution is close to the disparity in economy of the studied areas, the CC may lie itself very close to the equality line (close-to-zero CI) despite the fact that the whole samples are encountering shortage of health workforce. This point is also a critical challenge for Thailand. As the urbanization trend is progressing and the Thai economy has just been upgraded to the upper-middle income level (combined with the expansion of aging populations),Citation15 there is a concern as to whether the existing health workforce is capable enough of addressing the populations’ health needs, not only in terms of quantity but also in the quality aspects. Future research on this area is recommended.
Conclusion
The distribution of health professionals in Thailand was relatively equitable across provincial economic status. In detail, a slight pro-poor effect was found at district hospitals whereas health workforce distribution at higher-level facilities seemed to be slightly pro-rich. Doctor distribution appeared to be more pro-rich than other health professionals with statistical significance. The fair equitable distribution of HRH in Thai-land might be caused by the extensive health infrastructure development and rural retention policies over the past four decades. However, this study faced some limitations such as the lack of economic data at sub-district levels and the restriction of the analysis only in health workers in public health facilities affiliated to the MOPH. Further research that delves into sub-district micro-economy and the inclusion of private facilities, especially those located in Bangkok, in the analysis, is recommended.
Author contributions
All authors contributed to data analysis, drafting and revising the article, gave final approval of the version to be published, and agree to be accountable for all aspects of the work.
Acknowledgments
The authors would like to thank to Vuthiphan Vongmongkol and IHPP staff involved in the study for their invaluable advice.
Disclosure
The authors report no conflicts of interest in this work.
References
- ReportWHWorking Together for HealthGenevaWorld Health Organization2006
- FreerJSustainable development goals and the human resources crisisInt Health2017911227815421
- TangcharoensathienVMillsAPaluTAccelerating health equity: the key role of universal health coverage in the Sustainable Development GoalsBMC Med201513110125925656
- World Health OrganizationIncreasing Access to Health Workers in Remote and Rural Areas through Improved Retention: Global Policy RecommendationsGenevaWorld Health Organization2010 Available from: http://www.searo.who.int/nepal/mediacentre/2010_increasing_access_to_health_workers_in_remote_and_rural_areas.pdfAccessed January 3, 2019
- PrakongsaiPThe Impact of the Universal Coverage Policy on Equity of the Thai Health Care SystemLondonUniversity of London2008
- TangcharoensathienVLimwattananonSSuphanchaimatRPatcharanarumolWSawaengdeeKPutthasriWHealth workforce contributions to health system development: a platform for universal health coverageBull World Health Organ2013911187488024347713
- SuphanchaimatRWisaijohnTThammathachareeNTangcharoensathienVProjecting Thailand physician supplies between 2012 and 2030: application of cohort approachesHum Resour Health2013111323374250
- NoreeTCrisis of Physician Shortage in Thailand: Direction and TrendNonthaburiInternational Health Policy Program, Ministry of Public Health2008
- PagaiyaNHongthongPSituation of health professionsPagaiyaNHongthongPHuman Resources for Health: History, Current Situation, and the Way Forward1st edNonthaburiHuman Resources for Health Research and Development Office2011
- O’DonnellOvan DoorslaerEWagstaffALindelowMAnalyzing Health Equity Using Household Survey Data: A Guide to Techniques and Their ImplementationWashington, DCWorld Bank200895108 Available from: http://hdl.handle.net/10986/6896Accessed January 3, 2019
- Strategy and Planning DivisionHealth data Available from: http://bps.moph.go.th/new_bps/healthdataAccessed October 16, 2018
- National Economic and Social Development BoardGross Regional and Provincial Product Chain Volume Measures 2015Bangkok2017 Available from: http://www.nesdb.go.th/nesdb_en/ewt_dl_link.php?nid=4317
- Bureau of Registration AdministrationThailand Population 2015Bangkok2016 Available from: http://stat.dopa.go.th/stat/y_stat58.htmAccessed January 3, 2019
- NitayarumphongSEvolution of primary health care in Thailand: what policies worked?Health Policy Plan199053246254
- JongudomsukPSrithamrongsawatSPatcharanarumolWPhysical and human resourcesTangcharoensathienVThe Kingdom of Thailand Health System ReviewGenevaWHO Press201586109
- SuksamranATurnerKJamjanLDevelopment of Universal Health Coverage in Thailand: an overviewTreerutkuarkulAUniversal Health Coverage: Case Studies from ThailandNonthaburiHealth Systems Research Institute (HSRI)2012520
- BalabanovaDMillsAContehLGood health at low cost 25 years on: lessons for the future of health systems strengtheningLancet201338198832118213323574803
- SirikharinSSawaengdeeKThe Office of Permanent Secretary’s Guideline for Health Workforce Demand EstimationNonthaburiPraboromarajchanok Institute for Health Workforce Development2015
- TangcharoensathienVPrakongsaiPLimwattananonSPatcharanarumolWJongudomsukPFrom targeting to universality: lessons from the health system in Thailand (Chapter 16) BTPeterTBuilding Decent Societies: Rethinking the Role of Social Security in DevelopmentBasingstoke, HampshirePalgrave Macmillan2009310322
- PagaiyaNNoreeTThailand’s Health Workforce: A Review of Challenges and ExperiencesWashington, DC2009 Available from: http://siteresources.worldbank.org/HEALTHNUTRITIONANDPOPULATION/Resources/281627-1095698140167/THLHealthWorkforce.pdf
- WibulpolprasertSPengpaibonPIntegrated strategies to tackle the inequitable distribution of doctors in Thailand: four decades of experienceHum Resour Health2003111214641940
- HendersonLNTullochJIncentives for retaining and motivating health workers in Pacific and Asian countriesHum Resour Health2008611818793436
- WiwanitkitVMandatory rural service for health care workers in ThailandRural Remote Health2011111158321348551
- NithiapinyasakulAAroraRChamnanPImpact of a 20-year collaborative approach to increasing the production of rural doctors in ThailandInt J Med Educ2016741441628008137
- TechakehakijWAroraRRural retention of new medical graduates from the Collaborative Project to Increase Production of Rural Doctors (CPIRD): a 12-year retrospective studyHealth Policy Plan201732680981528334994
- HongoroCNormandCHealth workers: building and motivating the workforceJamisonDTBremanJGMeashamARDisease Control Priorities in Developing Countries2nd edWorld Bank200613091322 Available from: https://www.dcp-3.org/sites/default/files/dcp2/DCP71.pdfAccessed January 3, 2019
- Bureau of Policies and StrategyThe Report on Public Health Resource 2015NonthaburiPermanent Secretary Offices, Ministry of Public Health2015
- HanvoravongchaiPLetiendumrongJTeerawattananonYTangcharoensathienVImplications of private practice in private hospitals on the caesarean section rate in ThailandHum Resour Heal Dev J200041111
- PrakongsaiPTangcharoensathienVPrivate Practice among Public Medical Doctor: The Thailand ExperienceBangkokNational Health Security Office2006
- McpakeBRussoGHipgraveDHortKCampbellJImplications of dual practice for universal health coverageBull World Health Organ201694214214626908963
- NooseisaiMWangY-FHongsranagonPMunisamyMMedical tourism within the medical hub policy: reviewing the need of a balanced strategy for health inequality reduction in a Thai contextJ Heal Res2016306445450
- HipgraveDBHortKDual practice by doctors working in South and East Asia: a review of its origins, scope and impact, and the options for regulationHealth Policy Plan201429670371624150504
- FerrinhoPvan LerbergheWFronteiraIHipólitoFBiscaiaADual practice in the health sector: review of the evidenceHum Resour Health2004211415509305
- LowSTunKTMhoteNPHuman resources for health: task shifting to promote basic health service delivery among internally displaced people in ethnic health program service areas in eastern Burma/MyanmarGlob Health Action2014712493725280737
- CampbellJBuchanJComettoGHuman resources for health and universal health coverage: fostering equity and effective coverageBull World Health Organ2013911185386324347710
- DellerBTripathiVStenderSOtolorinEJohnsonPCarrCTask shifting in maternal and newborn health care: key components from policy to implementationInt J Gynaecol Obstet2015130Suppl 2S25S3126115853
- RenZSongPChangXWangJAnLInequality of obstetric and gynaecological workforce distribution in ChinaInt J Equity Health2018171329304827
- ZhangTXuYRenJSunLLiuCInequality in the distribution of health resources and health services in China: hospitals versus primary care institutionsInt J Equity Health20171614228253876
- ChenRZhaoYduJWuTHuangYGuoAHealth workforce equity in urban community health service of ChinaPLoS One2014912e11598825551449
- MangaloreRKnappMJenkinsRIncome-related inequality in mental health in Britain: the concentration index approachPsychol Med20073771037104517202002
- MorasaeEKForouzanASMajdzadehRAsadi-LariMNoorbalaAAHosseinpoorARUnderstanding determinants of socioeconomic inequality in mental health in Iran’s capital, Tehran: a concentration index decomposition approachInt J Equity Health20121111822449237
- ZhangQWangYUsing concentration index to study changes in socioeconomic inequality of overweight among US adolescents between 1971 and 2002Int J Epidemiol200736491692517470489
- van DoorslaerEWagstaffABleichrodtHIncome-related inequalities in health: some international comparisonsJ Health Econ19971619311210167346
- LimwattananonSTangcharoensathienVPrakongsaiPEquity in maternal and child health in ThailandBull World Health Organ201088642042720539855
- SunJEquality in the distribution of health material and human resources in Guangxi: evidence from Southern ChinaBMC Res Notes201710142928851453
- Joint Learning InitiativeHuman Resources for Health: Overcoming the CrisisWashington, DCThe President and Fellows of Harvard College2004 Available from: http://www.who.int/hrh/documents/JLi_hrh_report.pdfAccessed January 3, 2019
- Division S and PGeographic Information System for Public Health Resource2017 Available from: http://gishealth.moph.go.th/healthmap/gmap.phpAccessed December 14, 2017
- BundhamcharoenKPatcharanarumolWPagaiyaNTangcharoensathienVDemographic and Health Transition: health systems challenges and future directionJonesGIm-emWImpact of Demographic Changes in ThailandBangkokUnited Nations Population Fund20116584
- WibulpolprasertSThailand Health Profile 2001–2004BangkokExpress Transportation Organization2008
- World Bank InstituteInequality measuresntroduction to Poverty Analysis200595105 Available from: http://siteresources.worldbank.org/PGLP/Resources/PovertyManual.pdfAccessed January 3, 2019
- RegidorEMeasures of health inequalities: part 2J Epidemiol Community Health2004581190090315483304