
Abstract
Background
Caveolin (Cav)-1 and Cav-2 are cell membrane proteins, which are structural proteins of caveolae and are reported to be positive regulators of cell survival and metastasis in prostate cancer (PC). In a previous study, we reported that elevated levels of Cav-1 and Cav-2 were significantly associated with PC progression. However, their functions in PC have not yet been clarified. In this study, we examined the function of Cav-1 and Cav-2 in PC cell invasiveness and motility.
Materials and methods
We introduced Cav-1- and Cav-2-specific small interfering into PC3 cells to knock-down (KD) both molecules. We also performed cell proliferation assay, wound healing assay, migration assay, and invasion assay using PC3 cells and compared the results between Cav-1-KD, Cav-2-KD, and negative control PC3 cells. In addition, we performed real-time quantitative PCR (RT-qPCR) and RTCitation2 Profiler PCR Array analysis to identify factors influencing migration.
Results
We observed no significant difference in the proliferative and invasive activities of Cav-1-KD and Cav-2-KD PC3 cells; however, the cell motility was significantly decreased compared with negative control PC3 cells. RT-qPCR revealed that the expression of vimentin and N-cadherin was downregulated in Cav-1-KD PC3 cells. In addition, PCR array revealed a decreased expression of MGAT5, MMP13, and MYCL in Cav-1-KD PC3 and ETV4, FGFR4, and SRC in Cav-2-KD PC3.
Conclusion
Cav-1 and Cav-2 may positively contribute to the upregulation of castration-resistant PC cell migration. Cav-induced regulation of several molecules including vimentin, N-cadherin, MGAT5, MMP13, MYCL, ETV4, FGFR4, and SRC may have an important role in PC3 cell motility. However, further examination will be required.
Keywords:
Introduction
Prostate cancer (PC) is the most commonly diagnosed cancer in men and is the second leading cause of death due to cancer in men in developed countries.Citation1 Localized PCs are usually treated by radical prostatectomy or radiation. In Japan, 21% of PC patients present with distant metastases and 19% of PC patients present with locally advanced disease at diagnosis.Citation2 Androgen deprivation therapy (ADT) is a mainstay of treatment for locally advanced and metastatic PC. ADT is reported to be effective for 3–5 years,Citation3,Citation4 although medically or surgically castrated PC eventually transforms into castration-resistant PC (CRPC), and the prognosis of the patients in the CRPC stage is poor. Advanced CRPC is a multifaceted problem and needs many approach. CRPC is associated with several factors, including downregulation of performance status and presence of bone pain. Bone metastases will develop in 90% of men with CRPC and can produce significant morbidity, including pain, pathologic fractures, spinal cord compression, and bone marrow failure. Biological effects are also common, including anemia, weight loss, fatigue, hypercoagulability, and infection.Citation5 Supportive care and maintenance of the quality of life remain the priority. We must build on what is currently available to further improve the outcome in these poor prognosis patients.
Caveolins (Cavs) are well-known principal components of caveolae, which are involved in cellular process including endocytosis, lipid homeostasis, and signal transduction as physiological functions.Citation6,Citation7 Caveolae are mainly expressed in fibroblasts, vascular endothelial cells, adipocytes, and epithelial cells.Citation6–Citation8 The Cav family is composed of three iso-forms, namely, Cav-1, Cav-2, and Cav-3.Citation6–Citation8 Although Cav-1 and Cav-2 are expressed in various tissues, Cav-3 has been reported to be expressed in skeletal tissue, cardiac myocytes, and smooth muscle cells.Citation6–Citation9 All three Cavs show basic structural motif of N-terminal Cav-1 scaffolding domain (CSD), transmembrane domain, and C-terminal domain.Citation6–Citation8 Cav-1 is a 22 kDa protein composed of 178 amino acids and has been most sufficiently investigated in Cav family.Citation6,Citation7,Citation9 Cav-1 reported to be expressed predominantly in terminally differentiated cells including adipocytes, endothelial cells, and smooth muscle cells.Citation6–Citation9 The role of Cav-1 in cholesterol trafficking and homeostasis is reported to be one of the major physiological functions.Citation6–Citation9
The function of Cavs in cancer is controversial because the activity is reported to differ by cancer cell types.Citation10,Citation11 Downregulation of Cav-1 was reported in the carcinomas of breast,Citation12 colon,Citation13 ovary,Citation14 and sarcoma;Citation15 the locus encoding Caveolin-1 and Caveolin-2 genes is reported to be deleted in several cancer cells.Citation16 In contrast, overexpression of Cav-1 was observed in prostate,Citation17–Citation20 pancreas,Citation21,Citation22 colon,Citation23 breast,Citation24 and esophagus carcinomaCitation25 and increased expression of Cav-2 was observed in esophageal carcinoma,Citation26,Citation27 urothelial carcinoma,Citation28 and several cancer cell lines including glioma, cervical cancer, lung adenocarcinoma, and breast cancer.Citation7 In addition, promotion of chemoresistance in gastric cancer and lymph nodes metastasis in non-small-cell lung cancer by Cav-1 was also reported.Citation29,Citation30 Interestingly, downregulation of Cav-1 led to the conversion of androgen-insensitive metastatic mouse PC cells (malignant phenotype) to androgen-sensitive phenotype.Citation31
In the previous work, we reported that plasma concentration of Cav-1 and Cav-2 was increased in CRPC patients compared with androgen-sensitive PC patients.Citation17 According to the results, we analyzed the function of Cav-1 and Cav-2 in CRPC cell line PC3.
Materials and methods
Cell culture
Three androgen-independent PC cell lines (PC3, DU145, and 22Rv1), a androgen-dependent PC cell line (LNCaP), and Hela cell line were obtained from American Type Culture Collection (ATCC) (Manassas, VA, USA), cultured in 10 cm in diameter cell culture dishes with DMEM (Thermo Fisher Scientific, Waltham, MA, USA) containing 10% (v/v) FBS (Thermo Fisher Scientific) at 37°C in a humidified atmosphere of 5% CO2.
RNA extraction and real-time qRT-PCR analysis
Total cellular RNA was extracted from cells using an RNA Mini kit (Ambion, Paisley, OR, USA). For qRT-PCR, 3 µg of total RNA was reverse transcribed with a mixture of oligo(dT) and random primers and processed for each PCR reaction as described previously.Citation17 The primers used for real-time qRT-PCR were as follows:
Cav-1 forward, 5′-TTCTGGGCTTCATCTG GCAAC-3′; reverse, 5′-GCTCAGCCCTATTGGTCCACTTTA-3′ (93 bp);
Cav-2 forward, 5′-CACCCTCAGCTGTCTGCACAT-3′; reverse, 5′-GGCAGAACCATTAGGCAGGTCTT-3′ (66 bp);
Glyceraldehyde-3-phosphate dehydrogenase (GAPDH) forward, 5′-GCACCGTCAAGGCTGAGAAC-3′; reverse, 5′-TGGTGAAGACGCCAGTGGA-3′ (138 bp);
Androgen receptor (AR) forward, 5′-TCCATT-GCCCACCAAAGACTA-3′; reverse, 5′-GCAAATCTG-GCCTGTCACCTC-3′ (150 bp);
E-cadherin forward, 5′-AAGTGCTGCAGCCAAAGA-CAGA-3′; reverse, 5′-AAATTGCCAGGCTCAAT-GACAAG-3′ (84 bp);
N-cadherin forward, 5′-CGAATGGATGAAA GACCCATCC-3′; reverse, 5′-GCCACTGCCTTCATAGT-CAAACACT-3′ (171 bp);
Vimentin forward, 5′-AACCTGGCCGAGGA-CATCA-3′; reverse, 5′-TCAAGGTCAAGACGTGC-CAGA-3′ (134 bp);
Hepatocyte growth factor activator inhibitor type 1 (HAI1) forward, 5′-GGTGACACGGATGTCAGGGTA-3′; reverse 5′-CACTGTCAGCTGGAACAGGTAGG-3′ (93 bp);
Hepatocyte growth factor activator inhibitor type 2 (HAI2) forward, 5′-GACGGAAACAGCAATAAT-TACCTGA-3′; reverse, 5′-TTGAACATATCGCTG-GAGTGGTC-3′ (170 bp);
EGFR forward, 5′-TTGCCAAGGCACGAGTAA-CAAG-3′; reverse, 5′-CCACTGTGTTGAGGGCAATGA- 3′ (200 bp);
SNAIL forward, 5′-GACCACTATGCCGCGCTCTT-3′; reverse, 5′-TCGCTGTAGTTAGGCTTCCGATT-3′ (69 bp);
SNAIL2 forward, 5′-TTTCCAGACCCTGGTT-GCTTC-3′; reverse, 5′-CTCAGATTTGACCTGTCTGC AAATG-3′.
Real-time qRT-PCRs were performed using a Thermal Cycler Dice Real-Time System II (Takara Bio, Shiga, Japan). Reaction mixtures (25 µL) containing 2 µL of cDNA template, 1 µL of each sense and antisense primers, and 1× SYBR Premix Ex Taq II (Takara Bio) were amplified as follows: 95°C for 30 seconds and 40 cycles at 95°C for 5 seconds, 60°C for 30 seconds, and a final dissociation stage (95°C for 15 seconds, 60°C for 30 seconds, and 95°C for 15 seconds). GAPDH was used as an internal control. The results were evaluated using the Thermal Cycler Dice Real-Time System software program. The ΔΔ−Ct algorithm was used to analyze the relative changes in gene expression.
Protein extraction immunoblot analysis
The cells were washed twice with ice-cold PBS followed by the addition of 1.5 mL of 10% trichloroacetic acid on ice. The degenerated cells were scraped and collected into micro-centrifuge tubes and centrifuged at 14,000 rpm at 4°C for 3 minutes. The pellet was dissolved in an extraction solution consisting of 7 M urea, 2% Triton-X-100, and 5% 2-mercap-toethanol. The extracted protein was analyzed by immunoblot analyses. The reaction samples were mixed with SDS-PAGE sample buffer and heated for 15 minutes at 75°C. SDS-PAGE was performed under reducing conditions using 4–12% gradient gels. After electrophoresis, the sample proteins were transferred electrophoretically to Immobilon membranes (EMD Millipore, Billerica, MA, USA). After blocking the nonspecific binding site with 5% nonfat dry milk in 50 mM Tris-HCl (pH 7.5), 150 mM NaCl, and 0.05% Tween 20, the membranes were incubated with primary antibody in buffer containing 1% BSA at 4°C overnight followed by four washes with the buffer and incubation with peroxidase-conjugated secondary antibody diluted in the buffer with 1% BSA for 1 hour at room temperature. The labeled proteins were visualized with chemiluminescence reagent (PerkinElmer Inc., Waltham, MA, USA).
Knock-down (KD) of Cav-1 and Cav-2 in PC3 cells
Twenty-four hours before siRNA transfection, PC3 cells in the logarithmic phase were inoculated in six-well plates at 5×10⁴ cells/well. siRNA (20 nM final concentration) was mixed with Lipofectamine RNAiMAX (Thermo Fisher Scientific) in serum-free medium (Opti-MEM; Thermo Fisher Scientific), then incubated for 20 minutes at room temperature, and added to the cells. Transfection was carried out for 48 hours using the Cav-1-specific siRNA (Silencer Select siRNA Lot # AS00RPF7; Thermo Fisher Scientific), Cav-2-specific siRNA (Silencer Select siRNA Lot # AS00RPF6; Thermo Fisher Scientific), and negative control (NC) siRNA (Silencer Select siRNA Lot # AS000AAR; Thermo Fisher Scientific). Then, we prepared Cav-1-KD PC3, Cav-2-KD PC3, and si-Negative PC3 cell lines.
Invasion and migration assay
Twenty-four hours from transfection, Cav-1-KD PC3, Cav-2-KD PC3, and si-Negative PC3 cell lines were used for both cell migration and cell invasion assay. Cell migration assay was performed utilizing Culturex 96 well Cell Migration Assay Kit including boyden chamber consisting of polyethylene terephthalate membrane with 8 µm pores (Trevigen Inc., Gaithersburg, MD, USA), according to manufacturer’s instructions. Briefly, each cell was serum starved for 20 hours and 25,000 cells were seeded to top chamber. After 72 hours culture, cell dissociation solution and Calcein-AM (fluorescent dye) were added and incubated for 1 hour at 37°C in CO2 incubator. Then, the top chamber was removed and the plate was read at 485 nm excitation and 520 nm emission.
Cell invasion was estimated using a 96-well BME (basement membrane extract) Cell Invasion Assay Kit (Trevigen Inc.) in accordance with the manufacturer’s protocol. In brief, each cell was serum starved for 20 hours and 25,000 cells were seeded to top invasion chamber, which was coated by BME solution. The chamber was incubated at 37°C in CO2 incubator for 72 hours. Next, cell dissociation solution and Calcein-AM were added. After incubation for 1 hour, the top chamber was removed and the plate was read at 485 nm excitation and 520 nm emission.
Using standard curves, measured relative fluorescence units were converted in to cell number to determine the percentage of migration or invasion cells.
Wound healing assay
Twenty-four hours after transfection, Cav-1-KD PC3, Cav-2-KD PC3, and si-Negative PC3 cell lines were used for wound healing assay. Cells were harvested at 80% confluency and resuspended at 5×10⁵ cells/mL. A total of 500 µL of cell suspension was added to a 24-well plate, into which a wound field insert was placed (CytoSelect 24-Well Wound Healing Assay; Cell Biolabs, Inc., San Diego, CA, USA). After 24 hours incubation, wound field insert was carefully removed and the wound field area was measured at start and 4 hours. The percent closure was determined as follows: percentage of closure (%) = migrated cell surface area/total surface area ×100. The closure rate of each cell line was compared using Mann–Whitney U test.
MTS assay
Twenty-four hours after transfection, Cav-1-KD PC3, Cav-2-KD PC3, and si-Negative PC3 cell lines were incubated, after which cell proliferation was measured by MTS assay (Promega Corporation, Fitchburg, WI, USA). Cell proliferation was measured at 0 hours, 24 hours, 48 hours, and 72 hours. Responses to all treatments were assayed in triplicate, and results were expressed as the mean of three separate experiments.
PCR array
To determine the molecules affected by Cav-1 and Cav-2 expressions, which promotes PC3 cell motility, RTCitation2 Profiler PCR Array system (Catalog No PAHS-028Z; Qiagen NV, Venlo, the Netherlands) was used. According to the manufacturer’s protocol, cDNA from Cav-1-KD PC3, Cav-2-KD PC3, and si-Negative PC3 was mixed with RTCitation2 SYBR® Green qPCR Master Mix (Catalog No 330529; Qiagen NV) and H2O. Subsequently, 25 µL of the mixture was placed into each well of the PCR array (96-well plate was used). The three steps of the cycling program were 96°C for 15 seconds, 55°C for 40 seconds, and 72°C for 30 seconds. The process was repeated for 40 cycles. The threshold cycle changes (delta Ct) denote the difference in Ct for the gene of interest based on the Ct level of β-actin within the sample. Relative expression intensity was obtained by calculating 2-delta Ct for each sample from both stroke and normal participants for further Student’s t-test analysis. Changes in mRNA expression were compared between each cell line, and the results were reported as fold change: twofold or greater change was considered significant change.
Statistical analysis
Statistical analysis was performed using SPSS statistics, Version 22 (IBM Corporation, Armonk, NY, USA). Significance was set at P<0.05.
Results
Expression of Cav-1 and Cav-2 in PC cell lines
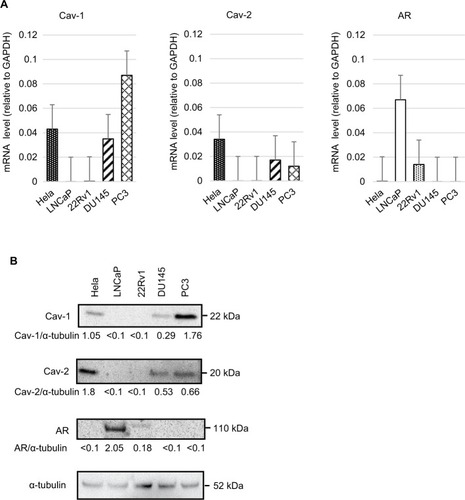
We investigated the expression of Cavs’ mRNA and protein in human PC cell lines by real-time real-time quantitative PCR (RT-qPCR) and immunoblot analysis. High expression of Cav-1 was observed in PC3; however, LNCap and 22Rv1 were not expressed (). Expression of Cav-2 was confirmed in DU145 and PC3, whereas Cav-2 was not expressed in LNCap and 22RV1 (). Increased expression of AR was observed in LNCap. 22RV1 is an androgen-independent PC cell line; however, weakly expressed AR (). These results suggested that Cav-1 and Cav-2 were expressed androgen-independent CRPC cells and may correlate with the downregulation of AR.
Figure 1 (A) RT-qPCR analyses of Cav-1, Cav-2, and AR in four PC cell lines (LNCaP, 22Rv1, DU145, and PC3) and cervical cancer cell line (Hela, as a positive control of Cav-1 and Cav-2). The relative abundance of Cav-1, Cav-2, and AR was shown as ratios with corresponding GAPDH. (B) Immunoblot analyses of the same cell lines. Ratios to the corresponding α-tubulin (Cav-1/α-tubulin, Cav-2/α-tubulin, and AR/α-tubulin) were shown.
Biological role of Cav-1 and Cav-2 in PC3 cell line
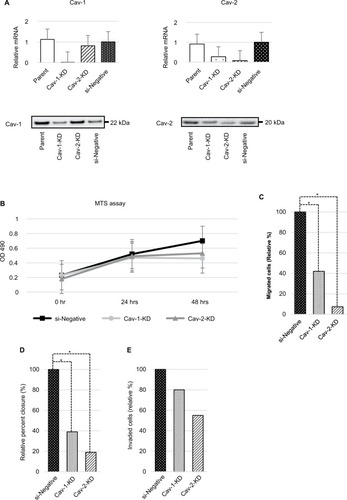
In response to the previous result of increased Cav-1–2 expression in PC3 cell line, we performed transient KD of Cav-1 and Cav-2 for the cells and we analyzed the biological activity. Twenty-four hours after transfection, decreased expression of Cav-1 and Cav-2 mRNA and proteins was confirmed by RT-qPCR (). Of interest, expression of Cav-1 was slightly downregulated in Cav-2-KD PC3 cells. Similar phenomenon was observed in our previous study;Citation17 however, we could not clarify the exact mechanism with this study. We also confirmed that the absence of homologous sequence between Cav-1 and Cav-2-siRNA. The cells were then submitted to MTS assay, cell migration, wound healing assay, and cell invasion assay. No significant difference in cell growth was observed in any cell line (); however, cellular migratory activity was significantly decreased in both Cav-1-KD PC3 and Cav-2-KD PC3 cell lines compared with si-Negative PC3 (). In addition as shown in , significant downregulation of cell motility was observed in Cav-1-KD PC3 and Cav-2-KD PC3 cell lines by wound healing assay. In contrast, downregulation for invasive capability was faint in both cell lines without statistical significance ().
Figure 2 (A) Expression of Cav-1 and Cav-2 was confirmed by RT-qPCR and immunoblot analyses in wild-type PC3 (parent), Cav-1-KD PC3, Cav-2-KD PC3, and si-Negative-transfected PC3 cell lines. (B) Effect of Cav-1 and Cav-2 expressions on the growth of PC3 cells is analyzed. The cell viability was examined by MTS assay. Each point represents mean ± SD for six wells. These assays were repeated two times with different batches of transfected cells, and each sample was performed in triplicate. Cell growth of Cav-1-KD and Cav-2-KD PC3 cells was faintly downregulated at 48 hours; however, there is no statistical significance compared with si-Negative PC3 cells. (C) Result of cell migration assay is shown. PC3 cell motility was significantly downregulated by KD of Cav-1 and Cav-2. Values are means ± SD of triplicate experiments. *P<0.05, Mann–Whitney U test. (D) The result of wound healing assay reveals downregulation of cell motility of PC3 cells by KD of Cav-1 and Cav-2. Values are mean ± SD of triplicate experiments. *P<0.05, Mann–Whitney U-test. (E) The result of invasion assay is shown. Invasive activity of PC3 cells was slightly downregulated in both Cav-1-KD and Cav-2-KD PC3 cells; however, statistical significance was not observed.
Downregulation of CAVs for cell motility
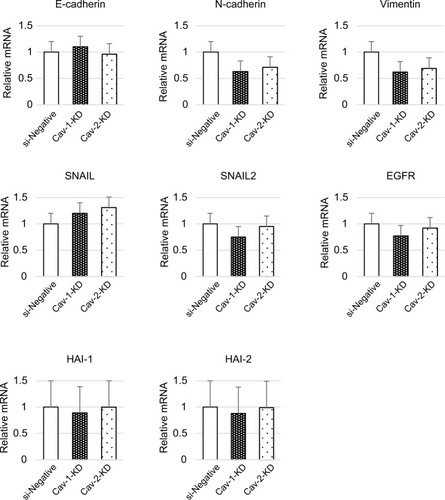
The downregulation of cell motility in Cav-1-KD and Cav-2-KD PC3 suggested that these cells had undergone a mesenchymal–epithelial transition (MET) in vitro. To better understand this change, we assessed the expression of MET-related molecules in these cells. Following siRNA-mediated loss of Cav-1, the level of vimentin mRNA was downregulated (). In addition, expression of N-cadherin was slightly decreased. However, no significant difference of E-cadherin, SNAIL, SNAIL2, HAI1, and HAI2 expressions was observed ().
Figure 3 RNA expression of EMT-related molecules was analyzed by RT-qPCR.
Abbreviations: Cav, caveolin; EMT, epithelial-to-mesenchymal transition; HAI1, hepatocyte growth factor activator inhibitor type 1; HAI2, hepatocyte growth factor activator inhibitor type 2; KD, knock-down; PC, prostate cancer; RT-qPCR, real-time quantitative PCR; si-Negative, negative control siRNA.
Next, we examined the expression of 84 molecules related to cancer metastasis using the RTCitation2 Profiler PCR Array system. As a result, significant downregulation of mannosyl (alpha-1,6)-glycoprotein beta-1,6-N-acetyl-glucosaminyl-transferase (MGAT) 5, matrix metallopeptidase 13 (MMP13), and V-myc myelocytomatosis viral oncogene homolog 1, lung carcinoma derived (MYCL) was observed in Cav-1-KD PC3 cells (). In contrast, the expression of MYCL and ETV4 (Ets variant 4) was significantly downregulated in Cav-2-KD PC3 cells compared with control. In addition, fibroblast growth factor receptor 4 (FGFR4) and V-src sarcoma viral oncogene homolog (SRC) were downregulated in Cav-2-KD PC3 cells; however, statistical significance was not achieved. In spite of the downregulation of MYCL, upregulation of MYC was observed in both Cav-1-KD and Cav-2-KD PC3 cells.
Table 1 Expression of molecules related to cancer metastasis in Cav-1-KD and Cav-2-KD PC3 cells, identified by RTCitation2 Profiler PCR Array system
Discussion
In this study, we demonstrated that KD of Cav-1 or Cav-2 caused decreased cell migration and decreased vimentin expression in Cav-1-KD PC3 cells, which may suggest the involvement of cells in the process of MET. Contrary to MET, a shift of epithelial feature toward mesenchymal phenotype may be observed during the progression of cancer. This process is referred to as the epithelial-to-mesenchymal transition (EMT). EMT enhances the motility of cancer cells, and this is considered necessary for cancer invasion.Citation32 A number of molecular mechanisms of EMT have been reported.Citation32 These mechanisms usually involve growth factors, cytokines with their specific receptors, and downstream signaling molecules. Cav-1 is also reported to be implicated in EMT in the progression of prostate,Citation33 bladder,Citation34 hepatocellular,Citation35 and pancreatic cancer.Citation36 Liang et alCitation34 demonstrated that elevated Cav-1 expression in bladder cancer was tightly correlated with cancer cell migration and invasion. In this study, the author also revealed that the KD of Cav-1 reduced the expression of Slug and the ectopic expression of Cav-1-promoted EMT by upregulating Slug expression. In another study, Cav-1 protein expression in pancreatic cancer was analyzed by IHC.Citation36 As a result, expression of Cav-1 protein was significantly increased in pancreatic cancer compared with normal tissue.Citation36 In addition, cancer cell migration and metastasis were increased in pancreatic cancer cells with elevated expression of Cav-1. The cancer cells show typical morphological changes in EMT with decreased E-cadherin expression. In colorectal cancer, overexpression of Cav-1 was correlated with a decreased expression of E-cadherin, which may indicate that Cav-1 was a negative regulator of E-cadherin in the progression of colorectal cancer.Citation37 Vimentin is recognized as a canonical mesenchymal marker, which is a member of the type III intermediate filament protein family.Citation38,Citation39 Vimentin is an important component of cellular cytoskeleton and is reported to play a significant role in maintaining cell-shape, integrity, cell adhesion, and migration.Citation38,Citation39 Increased expression of vimentin has been reported in the invasive phenotype of several malignant tumors, including prostate, gastrointestinal, breast, lung, cervical cancer, and renal cell carcinoma,Citation38,Citation39 and to be associated with increased capacity for cell motility and invasiveness in the process of EMT.Citation38,Citation39 Our results suggested that KD of Cav-1 may contribute to the suppression of cell migration through the downregulation of vimentin, which suggests that the cells may be involved in the initial process of MET; however, we could not confirm increased expression of E-cadherin in this study.
In contrast, the result of PCR array revealed the downregulation of MGAT5, MMP13, and MYCL in cav-1-KD PC3 cells. MGAT5, which belongs to the glycosyltransferase family, is reported to be a major enzyme involved in the regulation of glycoprotein oligosaccharide biosynthesis.Citation40,Citation41 It has been reported that overexpression of MGAT5 resulted in the loss of contact inhibition, increased cell motility and morphological transformation in epithelial cells, and enhanced metastasis in breast cancer cells.Citation40,Citation41 MMP13 is well known as a member of the collagenase subfamily of MMPs with the potential to degrade extracellular matrix components.Citation42 In cancer, MMP13 is reported to be positively associated with local invasion, cell migration, vascular infiltration, and metastasis.Citation42 MYC is a major cell regulator in many processes including cell cycle entry, ribosome biogenesis, and metabolism.Citation43,Citation44 Deregulation of MYC associated with tumor aggressiveness, metastatic potential, therapeutic resistance, and poor patient outcome has been reported in various cancers.Citation43,Citation44 MYCL was reported to correlate with the progression of small cell lung cancer.Citation45 With the exception of increased MYC expression, these data support our migration assay results; however, further examination will be required to clarify the exact functional mechanism of Cav-1 in the progression of PC.
Cav-2 was discovered as a 20 kDa protein co-purified with adipocyte-derived caveolar membranes.Citation7 Cav-2-encoded gene is located on human chromosome 7q31.1.Citation7 Cav-2 can form a stable hetero-oligomeric complex of 14–16 molecules into a large macromolecular complex, which defines caveolar architecture at the plasma membrane.Citation6,Citation7 In the physiological condition, Cav-2 is reported to express and play with Cav-1.Citation6,Citation7 In cancer, increased Cav-2 expression has been documented in esophageal carcinoma and urothelial carcinoma, as well as in the cell lines of glioma, cervical cancer, lung adenocarcinoma, and breast cancer.Citation7 Its function in cancer progression varies by cancer cell line.Citation7 We were unable to identify the exact focus of this phenomenon by RT-qPCR of EMT-related molecules in Cav-2-KD PC3 cells. However, several candidate molecules were detected in PCR array. ETV4 is a transcription factor belonging to the ETS-oncogene family.Citation46 Overexpression of ETV4 was reported to be associated with advanced and more aggressive forms of tumor with worse prognosis.Citation46 In addition, ETV4 positively correlates with cancer cell motility, invasiveness, EMT, and tumorigenesis.Citation46 Activated SRC and FGFR4 are also reported to influence cancer cell proliferation, migration, and invasion through the specific signaling axis.Citation47,Citation48 From the above, downregulated cell motility in Cav-2-KD PC3 cells may be caused by decreased expression of ETV4, SRC, or FGFR4.Citation46–Citation48 Therefore, we are considering additional analysis to clarify the mechanism.
In PC, it has been reported that ADT directory induces EMTCitation49 and that decreased E-cadherin expression is observed in CRPC.Citation50 These data suggested that EMT would be upregulated in CRPC. In contrast, increased expression of Cav-1 in CRPC has been reported and several reports indicate Cav-1-induced progression of EMT.Citation33 Therefore, inverse expression of AR and Cav-1 may have an important role in CRPC progression through EMT.
Conclusion
KD of Cav-1 and Cav-2 downregulates the cell motility of PC3 cells. Expression of vimentin was decreased in Cav-1-KD PC3 cells. In addition, analysis of PCR array revealed decreased expression of MGAT5, MMP13, and MYCL in Cav-1-KD PC3 and ETV4, FGFR4, and SRC in Cav-2-KD PC3. Cav-induced regulation of these molecules may have an important role in PC3 cell motility. Cav-1 and Cav-2 may positively contribute to the upregulation of CRPC cell migration.
Disclosure
The authors report no conflicts of interest in this work.
References
- SiegelRLMillerKDJemalACancer statistics, 2015CA Cancer J Clin201565152925559415
- Cancer Registration Committee of the Japanese Urological Association Clinicopathological statistics on registered prostate cancer patients in JapanReport from the Japanese Urological AssociationInt J Urol20002005124661
- HinotsuSAkazaHUsamiMCurrent status of endocrine therapy for prostate cancer in Japan—analysis of primary androgen deprivation therapy on the basis of data collected by J-CaPJpn J Clin Oncol20073777578117965423
- CooperbergMRHinotsuSNamikiMRisk assessment among prostate cancer patients receiving primary androgen deprivation therapyJ Clin Oncol200927264306431319667269
- HotteSJSaadFCurrent management of castrate-resistant prostate cancerCurr Oncol201017Suppl 27279
- FridolfssonHNRothDMInselPAPatelHHRegulation of intracellular signaling and function by caveolinFaseb J20142893823383124858278
- GuptaRToufailyCAnnabiBCaveolin and cavin family members: dual roles in cancerBiochimie2014107Pt B18820225241255
- SonninoSPrinettiASphingolipids and membrane environments for caveolinFEBS Lett2009583459760619167383
- ChenDCheGValue of caveolin-1 in cancer progression and prognosis: Emphasis on cancer-associated fibroblasts, human cancer cells and mechanism of caveolin-1 expression (Review)Oncol Lett2014841409142125202343
- BurgermeisterELiscovitchMRöckenCSchmidRMEbertMPCaveats of caveolin-1 in cancer progressionCancer Lett2008268218720118482795
- AndoTIshiguroHKimuraMThe overexpression of caveolin-1 and caveolin-2 correlates with a poor prognosis and tumor progression in esophageal squamous cell carcinomaOncol Rep200718360160917671707
- SagaraYMimoriKYoshinagaKClinical significance of Caveo-lin-1, Caveolin-2 and HER2/neu mRNA expression in human breast cancerBr J Cancer200491595996515305200
- NimriLBarakHGraeveLSchwartzBRestoration of caveolin-1 expression suppresses growth, membrane-type-4 metalloproteinase expression and metastasis-associated activities in colon cancer cellsMol Carcinog2013521185987022674854
- DavidsonBNeslandJMGoldbergICaveolin-1 expression in advanced-stage ovarian carcinoma--a clinicopathologic studyGynecol Oncol200181216617111330944
- WiechenKSersCAgoulnikADown-regulation of caveolin-1, a candidate tumor suppressor gene, in sarcomasAm J Pathol2001158383383911238032
- KaruppiahKDruhanLJChenCASuppression of eNOS-derived superoxide by caveolin-1: a biopterin-dependent mechanismAm J Physiol Heart Circ Physiol20113013H903H91121724868
- SugieSMukaiSYamasakiKKamibeppuTTsukinoHKamotoTSignificant association of caveolin-1 and caveolin-2 with prostate cancer progressionCancer Genomics Proteomics201512639139626543085
- YangGGoltsovAARenCCaveolin-1 upregulation contributes to c-Myc-induced high-grade prostatic intraepithelial neoplasia and prostate cancerMol Cancer Res201210221822922144662
- WilliamsTMHassanGSLiJCaveolin-1 promotes tumor progression in an autochthonous mouse model of prostate cancer: genetic ablation of Cav-1 delays advanced prostate tumor development in tramp miceJ Biol Chem200528026251342514515802273
- SugieSMukaiSTsukinoHIncreased plasma caveolin-1 levels are associated with progression of prostate cancer among Japanese menAnticancer Res20133351893189723645736
- SuzuokiMMiyamotoMKatoKImpact of caveolin-1 expression on prognosis of pancreatic ductal adenocarcinomaBr J Cancer200287101140114412402154
- ChatterjeeMBen-JosefEThomasDGcaveolin-1 is associated with tumor progression and confers a multi-modality resistance phenotype in pancreatic cancerSci Rep20155121086726065715
- BenderFCReymondMABronCQuestAFCaveolin-1 levels are down-regulated in human colon tumors, and ectopic expression of caveolin-1 in colon carcinoma cell lines reduces cell tumorigenicityCancer Res200060205870587811059785
- van den EyndenGGvan LaereSJvan der AuweraIOverexpression of caveolin-1 and -2 in cell lines and in human samples of inflammatory breast cancerBreast Cancer Res Treat200695321922816244790
- KatoKHidaYMiyamotoMOverexpression of caveolin-1 in esophageal squamous cell carcinoma correlates with lymph node metastasis and pathologic stageCancer200294492993311920460
- AndoTIshiguroHKimuraMThe overexpression of caveolin-1 and caveolin-2 correlates with a poor prognosis and tumor progression in esophageal squamous cell carcinomaOncol Rep200718360160917671707
- HuYCLamKYLawSWongJSrivastavaGProfiling of differentially expressed cancer-related genes in esophageal squamous cell carcinoma (ESCC) using human cancer cDNA arrays: overexpression of oncogene MET correlates with tumor differentiation in ESCCClin Cancer Res20017113519352511705871
- FongAGarciaEGwynnLLisantiMPFazzariMJLiMExpression of caveolin-1 and caveolin-2 in urothelial carcinoma of the urinary bladder correlates with tumor grade and squamous differentiationAm J Clin Pathol200312019310012866378
- YuanGRegelILianFWNT6 is a novel target gene of caveolin-1 promoting chemoresistance to epirubicin in human gastric cancer cellsOncogene201332337538722370641
- LiMChenHDiaoLZhangYXiaCYangFCaveolin-1 and VEGF-C promote lymph node metastasis in the absence of intratumoral lymphangiogenesis in non-small cell lung cancerTumori201096573474321302621
- NasuYTimmeTLYangGSuppression of caveolin expression induces androgen sensitivity in metastatic androgen-insensitive mouse prostate cancer cellsNat Med199849106210649734401
- ChengHFukushimaTTakahashiNTanakaHKataokaHHepatocyte growth factor activator inhibitor type 1 regulates epithelial to mesenchymal transition through membrane-bound serine proteinasesCancer Res20096951828183519223533
- ZhangXLingMTWangQIdentification of a novel inhibitor of differentiation-1 (ID-1) binding partner, caveolin-1, and its role in epithelial-mesenchymal transition and resistance to apoptosis in prostate cancer cellsJ Biol Chem200728246332843329417855368
- LiangWHaoZHanJLZhuDJJinZFXieWLCAV-1 contributes to bladder cancer progression by inducing epithelial-to-mesenchymal transitionUrol Oncol201432685586324968949
- MeyerCDzieranJLiuYDistinct dedifferentiation processes affect caveolin-1 expression in hepatocytesCell Commun Signal2013111623339737
- HuangCQiuZWangLA novel FoxM1-caveolin signaling pathway promotes pancreatic cancer invasion and metastasisCancer Res201272365566522194465
- ZhangJZhangKZhouLExpression and potential correlation among Forkhead box protein M1, Caveolin-1 and E-cadherin in colorectal cancerOncol Lett20161242381238827698803
- SatelliALiSVimentin as a potential molecular target in cancer therapy Or Vimentin, an overview and its potential as a molecular target for cancer therapyCell Mol Life Sci201168183033304621637948
- XuZBianHZhangFURI promotes the migration and invasion of human cervical cancer cells potentially via upregulation of vimentin expressionAm J Transl Res201796303728670391
- WangXHeHZhangHClinical and prognostic implications of β1, 6-N-acetylglucosaminyltransferase V in patients with gastric cancerCancer Sci2013104218519323107376
- GranovskyMFataJPawlingJMullerWJKhokhaRDennisJWSuppression of tumor growth and metastasis in Mgat5-deficient miceNat Med20006330631210700233
- OsakoYSekiNKitaYRegulation of MMP13 by antitumor microRNA-375 markedly inhibits cancer cell migration and invasion in esophageal squamous cell carcinomaInt J Oncol20164962255226427779648
- SchickMHabringerSNilssonJAKellerUPathogenesis and therapeutic targeting of aberrant MYC expression in haematological cancersBr J Haematol2017179572473829171017
- KalkatMde MeloJHickmanKAMYC Deregulation in Primary Human CancersGenes201786151
- KatoFFiorentinoFPAlibésAMYCL is a target of a BET bromodomain inhibitor, JQ1, on growth suppression efficacy in small cell lung cancer cellsOncotarget201774777378
- TyagiNDeshmukhSKSrivastavaSKETV4 Facilitates Cell-Cycle Progression in Pancreatic Cells through Transcriptional Regulation of Cyclin D1Mol Cancer Res201816218719629117940
- WangSDingZFibroblast growth factor receptors in breast cancerTumor Biol20173951010428317698370
- AnbalaganMMorozKAliACarrierLGlodowskiSRowanBGSubcellular localization of total and activated Src kinase in African American and Caucasian breast cancerPLoS One201273e3301722457730
- SunYWangBELeongKGAndrogen deprivation causes epithelial-mesenchymal transition in the prostate: implications for androgen-deprivation therapyCancer Res201272252753622108827
- ielSVasseurCBruyereFRozetFMaheoKFromontGClinical significance of epithelial-mesenchymal transition markers in prostate cancerHum Pathol201761263227818287