Abstract
We compared the genetic and clinical profile of men who lower and do not lower blood pressure (BP) after acute aerobic exercise. Volunteers were 45 men (Mean ± SEM, 43.5 ± 1.5 yr) with high BP (145.7 ± 1.5/85.7 ± 1.1 mmHg). They completed three experiments: nonexercise control and two cycle exercise sessions at 40% and 60% peak oxygen consumption, and were then instrumented to an ambulatory BP monitor. Logistic regression determined the genetic and clinical profile of men who lowered BP after exercise (responders [ExR n = 36]); and those who did not (nonresponders [ExNR n = 9]). ExR had higher C-reactive protein (CRP), high-density lipoprotein (HDL), the metabolic syndrome, family history of hypertension, more renin-angiotensin system (RAS) common alleles, and α-adducin Trp460 and endothelial nitric oxide synthase (ENOS) C786 risk alleles. ExNR had lower CRP and HDL, did not have the metabolic syndrome and a family history of hypertension, had more RAS risk alleles, and had the α-adducin Gly460Gly and ENOS T786T genotypes. This model had a sensitivity of 97.1%, specificity of 75.0%, and accounted for 46.3%–74.4% of the BP response. These results suggest genetic and clinical information may eventually be used to characterize people who do and do not respond to exercise as antihypertensive therapy.
Introduction
Hypertension is a significant public health problem (CitationAHA 2008; CitationOng et al 2007). Approximately two thirds of adults in the United States have above optimal blood pressure (BP) (systolic BP [SBP] ≥ 120 and/or diastolic BP [DBP] ≥ 80 mmHg) (CitationWang and Wang 2004); and nearly all Americans will acquire hypertension if they live into old age (CitationChobanian et al 2003). Hypertension is the most common primary diagnosis in America and a major risk factor for heart disease, stroke, congestive heart failure, chronic kidney disease, and peripheral arterial disease. The current costs attributed to hypertension are US $63.5 billion annually, with antihypertensive medications accounting for 38% of this amount (CitationAHA 2008). These expenditures underscore the substantial social and economic strain hypertension places upon the health care system.
Aerobic exercise training decreases BP an average of 5–7 mm Hg (CitationPescatello et al 2004a). Physical activity is recommended as nonpharmacologic therapy to prevent, treat, and control hypertension (CitationPescatello et al 2004a). Some, if not all, of the BP lowering effects of aerobic exercise training programs are the result of the acute or immediate BP benefits that result from a single exercise session, termed postexercise hypotension (PEH) (CitationThompson et al 2001). In a systematic review, we reported that PEH does not occur in about 25% of the people with hypertension (CitationPescatello and Kulikowich 2001). The heterogeneity of the individual response to the antihypertensive effects of exercise is attributed to interactions among genetic and environmental factors that are poorly understood (CitationArnett et al 2007).
There is great promise for the use of exercise genomics in the practice of personalized medicine approaches to exercise prescription (CitationRoth 2007; CitationTurner et al 2007). Yet, work related to identifying genetic and clinical determinants of the antihypertensive effects of exercise has gone slowly. The most recent installment of the human gene map for performance and health-related fitness phenotypes indicates that there have been nine published reports of candidate gene association studies examining the BP response to acute exercise (CitationRankinen et al 2006a). Collectively, these studies show that: 1) there is a significant genetic component in the acute BP response to exercise with heritability estimates of 45%–55%; 2) baseline BP is a major determinant of the BP response to exercise; and 3) polymorphisms in the renin-angiotensin system (RAS), sympathetic nervous system, and the endothelial L-arginine-nitric oxide synthase pathway associate with the BP response to acute exercise. These reports have primarily involved people with normal BP studied while exercising. Baseline BP is a major determinant of the BP response to exercise. Thus, findings may differ among people with hypertension that are followed in the postexercise period with ambulatory BP monitoring.
We are one of the few research groups that have conducted PEH candidate gene association studies among people with pre- to stage 1 hypertension using ambulatory BP monitoring (CitationBlanchard et al 2006; CitationPescatello et al 2007a, Citation2007b). Our findings from these studies show genetic variants in the major BP regulatory pathways explain some of the variability in the BP response to acute aerobic exercise. Furthermore, exercise intensity interacted with genotype to exert differential post exercise BP effects. Other than baseline BP, the genetic and clinical characteristics of people who do and do not lower BP following exercise are largely unknown. The purpose of this study was to compare the genetic and clinical profile of men who do and do not respond to exercise as antihypertensive therapy.
Methods
Subjects
The methods have been published and are described here in abbreviated fashion (CitationBlanchard et al 2006; CitationPescatello et al 2004b, Citation2007a, Citation2007b). Subjects signed an informed consent approved by the Institutional Review Boards of the University of Connecticut and Hartford Hospital. Volunteers were 45 men from 18 to 55 yr with pre- to stage 1 hypertension. They were sedentary, had no physical limitations to perform exercise, and did not smoke. Subjects were not enrolled if they had a SBP ≥ 160 mmHg and/or DBP ≥ 100 mmHg, symptomatic atherosclerotic cardiovascular disease, diabetes mellitus, asthma, thyroid dysfunction, pancreatitis, acute illness, and/or were on medication for depression. Any medications potentially influencing the BP response to exercise including antihypertensives, antilipemics, aspirin, nonsteroidal antiinflammatories, nutritional supplements with the exception of a 1-a-day vitamin, cold medications, and herbal supplements were stopped at least 4 wk before testing occurred. When antihypertensives were withdrawn, investigators regularly monitored participants’ BP. Men in whom the cessation of antihypertensive medication resulted in resting SBP ≥ 160 and/or DBP ≥ 100 mmHg were excluded and resumed their medication.
Procedures
Subjects completed an orientation session to acquaint them with the study and determine if their BP met the inclusion criteria. BP was measured three times, 5 min apart in both arms by auscultation and averaged according to the methods of the Joint National Committee (CitationChobanian et al 2003). Waist circumference was measured at the height of the iliac crest with a Gulick tape measure (Sammons Preston, Chicago, IL), and height and weight were taken on a standard balance beam scale (Model 339, Detecto, Webb City, MO) to calculate body mass index (kg/m2). During the orientation session, subjects were asked to self disclose a family history of hypertension among first degree relatives as a yes or no. Participants were instructed not to ingest any caffeinated beverage the morning of the testing sessions, and throughout the study to drink caffeinated (≤480 ml [2 cups]) and alcoholic (≤2 drinks/d) beverages in moderation. Otherwise, subjects were asked to maintain their usual diet. Weight maintenance was defined as ± 2.25 kg (5.0 lb) of orientation weight and used as an indication that subjects were adhering to their normal dietary patterns during the study. Men were weighed prior to the exercise test and three experiments to ensure weight maintenance.
At the end of the orientation session an ambulatory BP monitor (Accutracker II automatic noninvasive ambulatory BP monitor, Suntech Medical Instruments Inc., Raleigh, NC) was connected to each subject to acquaint them with the equipment and ensure their BP met the study inclusion criteria. The same investigator attached the ambulatory BP monitor to all subjects. A calibration check was performed with a mercury sphygmomanometer using a t-tubule according to the manufacturer’s guidelines. The calibration check consisted of three test runs to ensure that three successive ambulatory BP measurements were within 5 mmHg of the auscultatory BP determinations. The monitor was programmed to record BP about every 20 min. BP was taken three times per hour until 2300 hr. All subjects exited the laboratory with instructions to proceed with their usual activities, not to exercise for the remainder of the day, let their arm remain still while the monitor was recording, note any usual emotional or physical events in a diary, and return the monitor and diary the next day. The computerized ambulatory BP recordings were considered acceptable if at least 80% of the BP readings were obtained.
Participants then completed a peak graded cardiopulmonary exercise stress test that was used to determine the workload of the two experimental exercise sessions. The graded exercise stress test was performed on a cycle ergometer (Monark Ergomedic 818E, Stockholm, Sweden). The protocol consisted of 2 min incremental stages of continuous cycling at a constant cadence of 60 rev•min−1 with the resistance increased each stage by 0.5 kp (30 W) until volitional exhaustion. VO2 peak was determined with breath by breath analysis of expired gases (Sensormedics Vmax 29 Metabolic Chart, SensorMedics Corp., Yorba Linda, CA). HR was recorded continuously with a 12 lead electrocardiogram (ECG) system. The same investigator measured BP by auscultation 30s prior to the end of each 2 min stage. At the conclusion of the graded cardiopulmonary exercise stress test, subjects were again attached to an ambulatory BP monitor to further familiarize them with the unit.
Subjects completed three, 40 min experiments in random order on three separate days that were at least 48 hr apart to avoid acute exercise effects on BP. Each experiment began with a 20 min baseline period of seated rest during which BP and HR were recorded every 2 min. HR was obtained with a HR monitor (Model # 1902750, Polar Electro Inc, Woodbury, NY), and BP by auscultation in the nondominant arm (ie, hand with which the subject did not write). The same study investigator made all BP determinations during every experiment for all subjects. The BP measurements taken during the baseline period were averaged and denoted as baseline BP. The subjects were blinded to the experiments until the conclusion of the baseline period. They then performed either a 40 min nonexercise control session of seated rest; or a 30 min cycle bout on an upright ergometer at light (40% VO2 peak, LIGHT) or moderate intensity (60% VO2 peak, MODERATE) with a 5 min warm up and cool down of free wheeling to total 40 min of exercise. Subjects left the laboratory wearing an ambulatory monitor until 2300 hr with a mean attachment time of 12:30 pm. The total duration of study involvement for a given study volunteer was four to eight weeks, with most completing the study within six weeks.
Blood sampling and analysis
Blood samples were taken in advance of the experiments for the purposes of genotyping and fasting blood lipid-lipoprotein, glucose and insulin determinations. Blood samples were also obtained during the experiments for high sensitivity-CRP as follows: at the end of the baseline period, at 30 min of each 40 min experiment, and at the conclusion of the experiments while still in the laboratory but prior to attachment to the ambulatory BP monitor. Samples were drawn into anticoagulated EDTA tubes and centrifuged at 2500 g and 23 °C for 6 min. Plasma samples were transferred to storage tubes and frozen at −80 °C until analysis. Blood lipids and lipoproteins were determined by oxidase assays using colorimetric enzymatic methods (Cobras® Integra™, Roche Diagnostics, Mannheim, Germany). The intra- and inter-assay CV for the triglyceride assays were 1.6% and 1.9%, respectively. Low density lipoprotein was calculated with the Friedwald equation (CitationFriedwald et al 1972). Plasma concentrations of insulin were measured in duplicate by radioimmunoassay using a solid phase, single antibody assay (Coat-a-Count Insulin, TKIN2, Diagnostic Products Corporation, Los Angeles, CA) with an intra-assay CV of 7.0% and inter-assay CV of 7.8%. A multi-level control (CON6 Multivalent Control Module, Diagnostic Procedures Corporation) was analyzed during each insulin test run. Plasma glucose concentrations were determined in duplicate by an automated glucose oxidase method (Yellow Springs Instruments, Model 2003, Yellow Springs, OH). The intra- and inter-assay CV for the plasma glucose determinations were 2.8% and 3.6%, respectively, at 4.7 mmol·L−1. The homeostasis model assessment (HOMA) of insulin resistance was calculated with the formula: [fasting glucose (mg·dL−1) × insulin (ulU·mL−1)]•22.5−1 (CitationMatthews et al 1985). High sensitivity CRP concentrations were measured via particle enhanced immunoturbidimetry on the COBAS INTEGRA analyzer (CRP latex cassette, Roche Diagnostic Corporation, Indianapolis, IN) with low-, normal-and high-quality control values. The inter-assay CRP CV was 3.22%, 3.85%, and 3.66%, respectively.
Genotype methods
Genomic DNA was isolated from EDTA containing vacutainer tubes using Puregene kits (Gentra Systems, Inc, MN). Polymerase chain reaction based restriction fragment length analysis was performed using separate primers described previously to determine mutations in the angiotensin-converting enzyme insertion/deletion polymorphism (ACE DIP) (rs4646994) (CitationShanmugam et al 1993), angiotensin II type 1 receptor (AT1R) 1166 A > C single nucleotide polymorphism (SNP) (rs5186) (CitationBerg and Berg 1998), intron-2 conversion of the aldosterone synthase gene (CYP11B2) (CitationNicod et al 2003), α-adducin Gly460Trp SNP (rs4961) (CitationPescatello et al 2007a), α-subunit of guanine nucleotide-binding system (GNAS) 393 T > C SNP (rs7121) (CitationYang et al 2004), and endothelial nitric oxide synthase (ENOS) 786 T > C SNP (rs20270744) (CitationMetzer et al 2007). Negative and positive controls (known genotypes) and random duplicates were used as quality control. In the event of discordant results, genotyping was repeated. All polymorphisms were in Hardy-Weinberg equilibrium.
Statistical analyses
Descriptive statistics were obtained on all study parameters. The BP difference from baseline was averaged at hourly intervals after the experimental sessions over the course of 9 hr; the time period over which PEH was noted when the men were awake and ambulating (CitationPescatello et al 2004b). The statistical analyses for the BP data used a two-pronged approach. The first approach involved repeated measures ANOVA to test if BP differed over time among experimental conditions (nonexercise control, LIGHT, MODERATE) and EXERCISE, LIGHT, and MODERATE responders and nonresponders. Small reductions in BP yield significant public health benefits in terms of reducing risks from coronary artery disease and stroke (Whelton et al 2002). We used the cohort and data from our previous work (CitationBlanchard et al 2006; CitationPescatello et al 2004b, Citation2007a, Citation2007b) to define ExR as men with an average BP change from baseline that was reduced ≥1 mmHg after LIGHT and/or MODERATE exercise compared to nonexercise control over 9 hr. Men with an average BP change from baseline that was reduced ≥1 mmHg after LIGHT and/or MODERATE compared to nonexercise control over 9 hr were defined as an ExNR. Similarly, LIGHT responders were defined as men with an average BP change from baseline that was reduced ≥1 mmHg after LIGHT compared to nonexercise control over 9 hr; and all else were classified as LIGHT nonresponders. MODERATE responders were defined as men with an average BP change from baseline that was reduced <1 mmHg after MODERATE compared to nonexercise control over 9 hr; and all else were classified as MODERATE nonresponders.
The second approach used the BP response to exercise as a dichotomous dependent variable (ExR and ExNR), and genetic and clinical markers of the cardiometabolic profile as independent predictors of ExR and ExNR. Independent t-tests determined if there were differences in subject clinical characteristics among ExR and ExNR. Genetic and clinical predictors of EXERCISE, LIGHT and MODERATE responders and nonresponders were tested using binary logistic regression models. For RAS genetic variants (ie, ACE DIP, AT1R 1166 A > C SNP, and CYP11B2) a genotype combination score of “at risk” alleles was calculated as 0–2 and ≥3 RAS risk alleles (CitationBlanchard et al 2006), and this score was the dichotomous variable used to reflect RAS epistatic effects in the logistic regression analyses. Due to the low prevalence of the α-adducin Trp460 risk allele in the general population, no man was found to have the α-adducin TrpTrp genotype so that two α-adducin genotypes (GlyGly and GlyTrp) were used in the logistic regression analyses (CitationPescatello et al 2007a). Clinical markers entered into these models included: VO2 peak; waist circumference; fasting blood lipid-lipoproteins, glucose and insulin; CRP, and family history. Pseudo R2 values from the full logistic regression models (models containing genotype and clinical markers) were compared to constrained models (models containing only clinical markers) to estimate the proportion of variance in the BP response to exercise that was attributed to genetic variation. The total sample of ExR and ExNR consisted of 45 men; however, the sample size of EXERCISE (n = 42), LIGHT (n = 43), and MODERATE (n = 44) responders and nonresponders differed slightly due to genetic and clinical markers not being obtained on all 45 men in each of these three statistical models.
The final models displayed in – were selected because: 1) they provided the best goodness of fit of the estimates fit to the actual outcomes; 2) the likelihood ratio test was not significant indicating the logistic regression model was more effective than the null model; and 3) the Cox and Snell and Nagelkerke pseudo R2, two additional descriptive measures of goodness of fit that are similar to the r2 concept of linear regression, explained a large proportion of the variability in the BP response to exercise. All statistical analyses were performed with Statistical Package for the Social Sciences for Windows version 14.0 (SPSS Inc., Chicago, IL) with p < 0.05 established as the level of significance.
Table 3 Logistic regression model of genetic and clinical correlates of exercise responders (n = 34) and nonresponders (n = 8) to the immediate antihypertensive effects of aerobic exerciseTable Footnotea
Table 5 Logistic regression model of genetic and clinical correlates of MODERATE responders (n = 31) and ronresponders (n = 13) to the immediate antihypertensive effects of aerobic exerciseTable Footnotea
Results
Subjects
Subjects were 45 overweight, middle-aged Caucasian men who had pre- to stage 1 hypertension, borderline dyslipidemia (CitationNCEP 2002), and low cardiovascular fitness (CitationACSM 2006) (). Of these men, 40.0% had the Msyn (CitationNCEP 2002), 51.1% reported a family history of hypertension, and 80.0% were classified as ExR. Clinical characteristics were not different between ExR and ExNR (p ≥ 0.05).
Table 1 Mean (± SEM) fasting clinical characteristics of the total sample and among exercise responders and nonrespondersTable Footnotea
Blood pressure response
displays the average BP difference from baseline after exercise versus nonexercise control over 9 hr among the men classified as EXERCISE, LIGHT, and MODERATE responders and nonresponders. In addition, the average BP change from baseline after exercise and nonexercise control at hourly intervals over 9 hr among ExR and ExNR is displayed in and , respectively. Among EXERCISE (), LIGHT, and MODERATE responders, BP was lower after LIGHT and MODERATE compared to nonexercise control () (p < 0.01). Among ExNR (), BP was higher after LIGHT and MODERATE versus nonexercise control (p < 0.05). Among LIGHT nonresponders, BP was higher after LIGHT (p < 0.01) but not after MODERATE than nonexercise control (p ≥ 0.05). Among MODERATE nonresponders, SBP was higher after MODERATE (p < 0.01) but not LIGHT (p ≥ 0.05); and DBP was higher after LIGHT and MODERATE compared to nonexercise control (p < 0.05). Under these conditions, the postexercise BP response differed in all instances between EXERCISE, LIGHT and MODERATE responders versus nonresponders () (p < 0.05). In addition, 84.4% of the men classified as LIGHT responders were deemed MODERATE responders; and 69.2% of LIGHT nonresponders were classified as MODERATE nonresponders.
Figure 1 The average adjusted systolic blood pressure change from baseline after LIGHT and MODERATE compared to nonexercise control at hourly intervals over 9 hr among exercise respondersa.
Abbreviations: LIGHT, 40% VO2 peak; MODERATE, 60% VO2 peak.
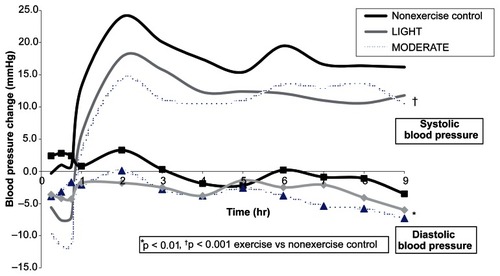
Figure 2 The average adjusted diastolic blood pressure change from baseline after LIGHT and MODERATE compared to nonexercise control at hourly intervals over 9 hr among exercise nonrespondersa.
Abbreviations: LIGHT, 40% VO2 peak; MODERATE, 60% VO2 peak.
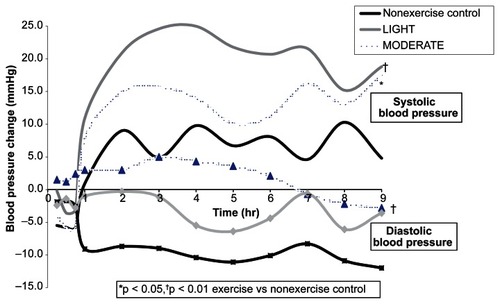
Table 2 Blood pressure difference {mean ± SEM (95% confidence interval)} from baseline after exercise versus nonexercise control over 9 hr among EXERCISE, LIGHT, and MODERATE responders and nonrespondersTable Footnotea
Genetic and clinical cardiometabolic profile
Exercise responders and nonresponders
The genetic and clinical features of the cardiometabolic profile that emerged from the logistic regression analyses of ExR (n = 34, 81.0%) and ExNR (n = 8, 19.0%) were obtained on 42 of the 45 men enrolled in this study and is shown in . Based upon the designation of ExR as the reference category and the β in , ExR had: higher CRP and high density lipoprotein (HDL); the Msyn; a self-disclosed family history of hypertension; and more RAS common alleles (0–2); and were carriers of the risk allele of the α-adducin Gly460Trp (GlyTrp genotype) and ENOS 786 T > C (TC/CC genotypes) SNPs compared to ExNR. In contrast, ExNR: had lower CRP and HDL; did not have the Msyn and a family history of hypertension; had more RAS risk alleles (3+); and were homozygous for the common alleles of the α-adducin Gly460Trp (GlyGly genotype) and ENOS 786 T > C (TT genotype) SNPs compared to ExR. The logistic regression model displayed in : 1) correctly classified 33 out of 34 ExR for a sensitivity of 97.1%, and six out of eight ExNR for a specificity of 75.0%; and 2) explained 46.3% (Cox and Snell R2) to 74.4% (Nagelkerke R2) of the variability in the BP response to exercise. When the pseudo R2 of the full logistic regression model was compared to the pseudo R2 of the constrained logistic regression model, the genetic component accounted for 40.5% to 43.0% of the variability in the BP response to exercise.
LIGHT responders and nonresponders
The genetic and clinical components of the cardiometabolic profile that emerged from the logistic regression analyses of LIGHT responders (n = 30, 69.8%) and nonresponders (n = 13, 30.2%) were obtained on 43 of the 45 men (). Based upon the designation of LIGHT responders as the reference category and the β in , LIGHT responders: had higher CRP and HDL; did not have the Msyn; had a family history of hypertension; had more RAS common alleles (0–2); and were carriers of the risk allele of the α-adducin Gly460Trp (GlyTrp genotype) and GNAS 393 T > C (TT/TC) SNPs compared to LIGHT nonresponders. In contrast, LIGHT nonresponders: had lower CRP and HDL; had the Msyn; did not have a family history of hypertension; had more RAS risk alleles (3+); were homozygous for the common alleles of the α-adducin Gly460Trp (GlyGly genotype) SNP and GNAS 393 T > C (CC genotype) SNPs compared to LIGHT responders. The logistic regression model displayed in : 1) correctly classified 28 out of 30 LIGHT responders for a sensitivity of 93.3%, and nine out of 12 LIGHT nonresponders for a specificity of 75.0%; and 2) explained 41.0% (Cox and Snell R2) to 58.0% (Nagelkerke R2) of the variability in the BP response to exercise. When the pseudo R2 of the full logistic regression model was compared to the pseudo R2 of the constrained logistic regression model, the genetic component accounted for 40.7% of the variability in the BP response to exercise.
Table 4 Logistic regression model of genetic and clinical correlates of LIGHT responders (n = 30) and nonresponders (n = 13) to the immediate antihypertensive effects of aerobic exerciseTable Footnotea
MODERATE responders and nonresponders
The genetic and clinical components of the cardiometabolic profile that emerged from the logistic regression analyses of MODERATE responders (n = 31, 70.5%) and nonresponders (n = 13, 29.5%) were obtained on 44 of the 45 men (). Based upon the designation of MODERATE responders as the reference category and the β in , MODERATE responders: had higher baseline BP and HDL; the Msyn; a family history of hypertension; more RAS common alleles (0–2); and were homozygous for the common allele of the α-adducin Gly460Trp (GlyGly genotype) SNP; and carriers of the risk allele of the ENOS 786 T > C (TC/CC genotypes) SNP compared to MODERATE nonresponders. In contrast, MODERATE nonresponders: had lower baseline BP and HDL; did not have the Msyn and a family history of hypertension; had more RAS risk alleles (3+); were carriers of the risk allele of the α-adducin Gly460Trp (GlyTrp genotype) SNP; and were homozygous for the common allele of the ENOS 786 T > C (TT genotype) SNP compared to MODERATE responders. The logistic regression model displayed in : 1) correctly classifi ed 27 out of 31 MODERATE responders for a sensitivity of 87.1%, and nine out of 13 MODERATE nonresponders for a specificity of 69.2%; and 2) explained 41.4% (Cox and Snell R2) to 58.9% (Nagelkerke R2) of the variability in the BP response to exercise. When the pseudo R2 of the full logistic regression model was compared to the pseudo R2 of the constrained logistic regression model, the genetic component accounted for 65.9% to 66.2% of the variability in the BP response to exercise.
Discussion
The purpose of this study was to compare the genetic and clinical profile of men with pre- to stage 1 hypertension who did and did not respond to aerobic exercise as antihypertensive therapy. We found ExR had: higher CRP and HDL; the Msyn; a self-disclosed family history of hypertension; and more RAS common alleles (0–2); and were carriers of the risk allele of the α-adducin Gly460Trp (GlyTrp genotype) and ENOS 786 T > C (TC/CC genotypes) SNPs (). ExNR: had lower CRP and HDL; did not have the metabolic syndrome and a family history of hypertension; had more RAS risk alleles; and were homozygous for the common alleles of the α-adducin Gly460Trp and ENOS 786 T > C SNP. This model accounted for up to 75% of the variability in the BP response, with over 40% of this variability due to genetic factors. In addition, the model had a high sensitivity (97.1% of ExR correctly classified) and adequate specificity (75.0% of ExNR correctly classified). These findings indicate that genetic and clinical information may eventually be used to characterize people who do and do not respond to exercise as antihypertensive therapy. Such information will ultimately enable clinicians and sports medicine professionals to personalize exercise prescriptions to maximize the effectiveness of exercise as a therapeutic option to prevent, treat and control hypertension.
Most men classified as LIGHT responders were MODERATE responders (ie, 84.4%). Despite the adequate repeatability of the BP phenotype, the cardiometabolic profile of LIGHT and MODERATE responders differed. LIGHT responders: had higher CRP and HDL; did not have the Msyn; had a family history of hypertension; more RAS common alleles (0–2); the α-adducin GlyTrp genotype; and were carriers of the GNAS T393 risk allele (TT/TC genotypes) (). The genetic component of this model accounted for just over 40% of the variability in the BP response. MODERATE responders: had higher baseline BP and HDL; the Msyn; a family history of hypertension; more RAS common alleles (0–2); and the α-adducin GlyGly genotype; and were carriers of the ENOS C786 risk allele (TC/CC genotypes) (). The genetic component of this model accounted for nearly two thirds of the variability in the BP response. Thus, CRP, baseline BP, and the presence or absence of the Msyn are the clinical determinants that appeared to differentiate between men who responded to LIGHT and MODERATE as antihypertensive therapy. Furthermore, the genetic makeup of men who lowered BP after LIGHT differed from those who lowered BP after MODERATE, and genetic factors accounted for more of the variability in the BP response after MODERATE than LIGHT. These clinical and genetic differences in the cardiometabolic profile of LIGHT and MODERATE responders may ultimately offer explanations for the differential exercise intensity of BP-lowering effects we (CitationBlanchard et al 2006; CitationPescatello et al 2004b, Citation2007a, Citation2007b) and others (CitationQuinn 2000; CitationSmelker et al 2004) have reported; and suggest the mechanisms for the BP-lowering effects of exercise may differ by the intensity or level of physical exertion of the exercise bout.
In this study we examined a limited number of polymorphisms in a small sample of Caucasian, middle-aged men raising the possibility of finding false positive results. We preselected the polymorphisms examined in this study based upon literature evidence of their associations with hypertension and the exercise-induced BP response and location in major BP and metabolic regulatory pathways reducing the likelihood of false positive statistical results (CitationRankinen et al 2000, Citation2006a, Citation2006b; CitationRankinen 2007). We used simple clinical measures of overall adiposity and insulin sensitivity. It remains possible that more sensitive measures of adiposity than the body mass index and waist circumference and of insulin sensitivity than HOMA may have shown significant associations with the postexercise BP response which we did not find in this study.
Nonetheless, our study has important strengths that increased our likelihood of finding associations among genetic and clinical determinants of the postexercise BP response (CitationCardon and Palmer 2003; CitationArnett et al 2007). These strengths included: 1) a randomized control design; 2) stringent assessment of the BP phenotype with ambulatory BP monitoring to minimize variability in the BP measurement; 3) purposeful inclusion of middle-aged Caucasian men to minimize genetic admixture; 4) a priori selection of polymorphisms; and 5) a functional approach with two different doses of exercise to isolate complex gene-gene and gene-environment interactions with the BP response to exercise. It is also important to note that our results confirm reports of others that there is a significant genetic component to the acute BP response to exercise (CitationBouchard and Rankinen 2001); and polymorphisms from the RAS, sympathetic nervous system, and ENOS pathway associate with the BP response to acute aerobic exercise (CitationRankinen et al 2000, Citation2006a; CitationRankinen 2007). Furthermore, finding family history to be an important component of the cardiometabolic profile suggests that other genetic factors contribute to the antihypertensive effects of exercise that remain to be found.
In conclusion, we have constructed models that profile the genetic and clinical characteristics of men who did and did not respond to exercise as antihypertensive therapy. Due to the small sample size and limited number of polymorphisms examined, these findings should be regarded as preliminary and hypothesis generating rather than hypothesis testing. Nonetheless, they illustrate the promise of the use of exercise genomics in personalized medicine. Genetic and clinical information may eventually be used by clinicians to individualize exercise prescriptions for subgroups of people that will maximize the effectiveness of exercise as antihypertensive therapy. The eventual translation of this information into clinical practice will enable exercise to take on increased importance in the prevention, treatment, and control of hypertension.
Disclosure
The authors report no conflicts of interest in this work.
References
- [ACSM] American College of Sports Medicine2006ACSM’s Guidelines for Exercise Testing and Prescription6th edBaltimore, MLLippincott Williams and Wilkins10910
- [AHA] American Heart Association2008Heart disease and stroke statistics-2008 update: A report from the American Heart Association Statistics Committee and Stroke Statistics SubcommitteeCirculation11385151
- ArnettDKBairdAEBarkleyRA2007Relevance of genetics and genomics for prevention and treatment of cardiovascular disease: A scientific statement from the American Heart AssociationCouncil on Epidemiology and Prevention, the Stroke Council, and the Functional Genomics and Translational Biology Interdisciplinary Working GroupCirculation115287890117515457
- BergeKEBergK1998Polymorphisms at the angiotensinogen (AGT) and angiotensin II type 1 receptor (AT1R) loci and normal blood pressureClin Genet5321499630078
- BlanchardBETsongalisGJGuidryMA2006RAAS polymorphisms alter the acute blood pressure response to aerobic exercise among men with hypertensionEur J Appl Physiol97263316468060
- BouchardCRankinenT2001Individual differences in response to regular physical activityMed Sci Sports Exerc33S4465111427769
- CardonLRPalmerLJ2003Population stratification and spurious allelic associationLancet36159860412598158
- ChobanianAVBakrisGLBlackHRthe National High Blood Pressure Education Program Coordinating Committee2003Seventh Report of the Joint National Committee on Prevention, Detection, Evaluation, and Treatment of High Blood Pressure. JNC 7-Complete VersionHypertension4212065214656957
- FreidwaldWTLevyRIFredricksonDS1972Estimation of the concentration of low density lipoproteins by a simple precipitation procedureClin Chem184995024337382
- MatthewsDRHoskerJPRudenskiAS1985Homeostasis model assessment: insulin resistance and β-cell function from fasting plasma glucose and insulin concentrations in manDiabetologia2841293899825
- MetzgerIFSertorioJTCTanus-SantosJE2007Modulation of nitric oxide formation by endothelial nitric oxide synthase gene haplotypesFree Rad Bio Med439879217697943
- [NCEP] National Cholesterol Education Program2002Third Report of the National Cholesterol Education Program (NCEP) Expert Panel on the Detection, Evaluation, and Treatment of High Blood Cholesterol in Adults (Adult Treatment Panel III)NIH Publication No. 02-5215
- NicodJBruhinDAuerL2003A biallelic gene polymorphism of CYP11B2 predicts increased aldosterone to renin ratio in selected hypertensive patientsJ Clin Endocrinol Metab88249550012788845
- OngKLCheungBMYManYB2007Prevalence, awareness, treatment, and control of hypertension among United States adults 1999–2004Hypertension49697517159087
- PescatelloLSBlanchardBETsongalisGJ2007aAlpha adducin Gly460Trp polymorphism interacts with exercise intensity to alter the blood pressure response following endurance exerciseClin Sci1132518
- PescatelloLSFranklinBAFagardR2004aAmerican College of Sports Medicine position stand. Exercise and hypertensionMed Sci Sports Exerc2553353
- PescatelloLSGuidryMABlanchardBE2004bExercise intensity alters postexercise hypotensionJ Hypertens221881815361758
- PescatelloLSKulikowichJM2001The aftereffects of dynamic exercise on ambulatory blood pressureMed Sci Sports Exerc3318556111689735
- PescatelloLSTurnerDRodriguezN2007bDietary calcium intake and renin angiotensin system polymorphisms alter the blood pressure response to aerobic exercise: a randomized control designNutr Metabol41
- QuinnTJ2000Twenty-four hour, ambulatory blood pressure responses following exercise: impact of exercise intensityJ Hum Hypertens145475310980585
- RankinenTChurchTRiceT2007Effect of endothelin 1 genotype on blood pressure is dependent on physical activity or physical fitnessHypertension501617470720
- RankinenTGagnonJPerusseL2000AGT M235T and ACE ID polymorphisms and exercise blood pressure in the HERITAGE Family StudyAm J Physiol Heart Circ Physiol279H37386
- RankinenTBrayMSHagbergJM2006aThe human gene map for performance and health-related fitness phenotypes: The 2005 updateMed Sci Sports Exerc3818638817095919
- RankinenTZuberiAChagnonYC2006bThe human obesity gene map: the 2005 updateObesity1452964416741264
- RothSM2007Perspective on the future use of genomics in exercise prescriptionJ Appl Physiol10412434518048588
- SmelkerCLFosterCMaherMA2004Effect of exercise intensity on postexercise hypotensionJ Cardiopulmonary Rehab2426973
- ShanmugamVSellKWSahaBK1993Mistyping ACE heterozygotesPCR Methods Appl312018268786
- ThompsonPDCrouseSFGoodpastureB2001The acute versus chronic response to exerciseMed Sci Sports Exerc33S4384511427768
- TurnerSTSchwartzGLBoerwinkleE2007Personalized medicine for high blood pressureHypertension501517470720
- WangYWangQJ2004The prevalence of prehypertension and hypertension among US adults according to the new joint national committee guidelinesArch Intern Med16421263415505126
- YangWWhiteBSpicerEK2004Complex haplotype structure of the human GNAS gene identifies a recombination hotspot centered on a single nucleotide polymorphism widely used in association studiesPharmacogenetics,14741715564881