
Abstract
Patients undergoing hemodialysis (HD) have significantly higher mean blood lead levels (BLLs) than those in healthy individuals. Because elementary lead can be found in particulate matter with a diameter of <2.5 μm (PM2.5), this cross-sectional study was conducted to assess the effect of environmental PM2.5 exposure and other clinical variables on BLLs in patients receiving HD. We recruited 921 patients on maintenance HD (MHD) who had undergone HD for at least 6 months and who had previously participated in a BLL study. Mean PM2.5 concentrations in living environments in the previous 12 and 24 months were analyzed using a blood lead test. From a multivariate analysis, after adjustment for related factors, the mean PM2.5 concentrations in the previous 12 and 24 months were positively associated with log BLLs. In addition, days with PM2.5 levels exceeding the standard level during the previous 12 and 24 months were positively associated with log BLLs. Patients exposed to higher PM2.5 concentrations and more days with PM2.5 levels exceeding the standard level exhibited a higher prevalence of high and high-normal BLLs and a lower prevalence of low-normal BLLs. After adjustment for related variables, the BLLs exhibited a significantly positive association with environmental PM2.5 in patients undergoing MHD.
Introduction
Patients undergoing hemodialysis (HD) have significantly higher mean blood lead levels (BLLs) than those in healthy individuals.Citation1–Citation3 In such patients, BLLs were associated with mortality.Citation4,Citation5 The sources of lead absorption are categorized as food, beverages, drinking water, paint, factory emissions, and automobile exhausts.Citation6 Therefore, patients undergoing HD are advised to avoid ingesting foods containing lead, such as deep-sea fish, deep-sea food, lead-related Chinese herbs, and soup boiled with the pig or cattle bones, as well as to avoid contact with lead-related factories or painting. However, inspiration of elemental lead from air tends to be neglected. Recently, air pollution, especially particulate matter with a diameter of <2.5 μm (PM2.5), has become a crucial problem because of its chronic effect on human health. Zereini et alCitation7 measured heavy metal concentrations in airborne dust and revealed that the main fraction of lead was found in fine particles with a diameter of <2.1 μm. According to our review of the relevant literature, studies on the relationship between environmental PM2.5 and BLL in patients undergoing HD are limited, and this relationship remains obscure. Therefore, the aim of the current cross-sectional study was to assess the effect of environmental PM2.5 exposure and other clinical variables on BLLs in patients undergoing HD.
Methods
The study protocol was approved by the institutional review board of Chang Gung Memorial Hospital. Because this was a retrospective cross-sectional study, no informed consent was required. All patient information was protected and was available only to the investigators, and all medical records, including medical history, laboratory data, and inclusion and exclusion criteria, were reviewed by senior nephrologists during the study period. All primary data were collected according to the Strengthening the Reporting of Observational Studies in Epidemiology guidelines.
Patients
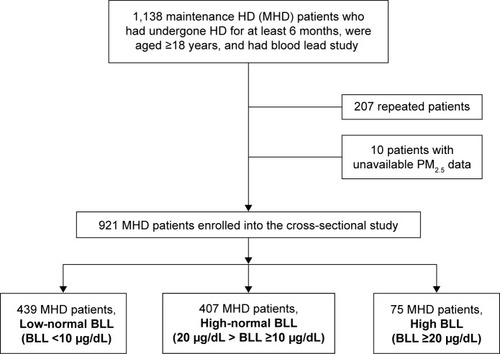
Patients were recruited from the HD centers of the Chang Gung Memorial Hospital branches in Linkou, Taipei, and Taoyuan. Only patients on maintenance HD (MHD) who had undergone HD for at least 6 months, were aged ≥18 years, and had previous blood lead studiesCitation4,Citation8 were enrolled (). A questionnaire was arranged to survey patients to identify and exclude those who had a history of occupational exposure to lead or previous lead intoxication or those who lived in lead-contaminated areas. In addition, patients with malignancies or infectious diseases or those who had been hospitalized or had undergone surgery within the previous 3 months were excluded. Diabetes mellitus (DM) was identified according to either a physician’s diagnosis, antidiabetic drug treatment, or 2 consecutive analyses demonstrating fasting blood glucose levels of >126 mg/dL. Most patients underwent 4 h of HD 3 times a week. HD was performed using single-use hollow-fiber dialyzers equipped with modified cellulose, polyamide, or polysulfone membranes. The dialysate used in all cases had a standard ionic composition with a bicarbonate-based buffer. Patients who had undergone hemodiafiltration (HDF) 3 times a week for ≥3 months were enrolled. We evaluated the prevalence of cardiovascular diseases (CVDs), including cerebrovascular disease, coronary artery disease, congestive heart failure, and peripheral vascular disease, in the patients. Hypertension was defined as the regular use of antihypertensive drugs for controlling blood pressure or at least 2 blood pressure measurements of >140/90 mmHg. In addition, smoking behavior (with smokers being defined as those who smoked in the past 30 days) was analyzed.
Figure 1 Flowchart of patient enrollment.
Laboratory, nutritional, and inflammatory parameters
All blood samples were obtained from the arterial end of the vascular access immediately after the initial 2-day interval for HD and were then centrifuged and stored at −80°C until use. Serum creatinine levels, normalized protein catabolic rates (nPCRs), and serum albumin levels were assayed and recorded as nutritional markers. High-sensitivity C-reactive protein (hsCRP) levels were measured as the indices of inflammation. Serum hsCRP levels were measured using immunonephelometry (Nanopia CRP; Daiichi Inc, Tokyo, Japan). The lowest detection limit was <0.15 mg/L. All other biochemical parameters were measured using the standard laboratory approach with an automatic analyzer. In patients on HD, the dialyzer clearance of urea was measured using the method described by DaugirdasCitation9 and was expressed as Kt/Vurea. The nPCR of the patients on HD was calculated using validated equations and was normalized to their body weight.Citation10 The serum calcium level was corrected using the serum albumin level with the following formula: corrected calcium level (mg/dL) = serum calcium level +0.8× (4.0 − serum albumin level). Nonanuria was defined as a daily urine output of ≥100 mL.
Measurement of blood lead levels
BLLs were measured using a previously described method.Citation4,Citation8,Citation11 To exclude the possibility that patients on MHD were exposed to lead through the contamination of water or dialysate during HD, we collected at least 2 samples of water and dialysate from outlets of reverse osmosis systems and inlets of dialysate of dialyzers in lead-free plastic bottles from each HD center.Citation4 Lead levels were measured using an electrothermal atomic absorption spectrometer (SpectrAA-200Z; Varian, Lexington, MA, USA) with Zeeman background correction and an L’vov platform. A certified commercially prepared product (Seronorm Trace Elements; Sero AS, Billingstad, Norway) was used to determine intrabatch accuracy and confirm interbatch standardization. The coefficient of variation for lead measurement was ≤5.0%. External quality control was maintained through patient participation in the National Quality Control Program conducted by the government. BLLs of each patient were measured 2 times with a 3-month interval. The BLL grade was defined as follows: low-normal BLL, BLL <10 μg/dL; high-normal BLL, 20 μg/dL > BLL ≥10 μg/dL; high BLL, and BLL ≥20 μg/dL.Citation2,Citation8
Environmental particulate matter – PM2.5
Data from the Taiwan Air Quality Monitoring Network, including the database on the air quality status in Taiwan, were analyzed.Citation12 Individual exposure to air pollution was estimated using a geographic information system with the mean concentrations of air pollutants in the previous 12 and 24 months.Citation13–Citation17 Because no previous studies have focused on this issue, the mean concentrations of PM2.5 in the previous 12 and 24 months were considered for each participant. A mean 24 h PM2.5 concentration level of <35 μg/m3 is defined as normal.Citation12
Statistical analysis
Data were analyzed using SPSS version 12.0 for Windows 95 (SPSS Inc, Chicago, IL, USA). The normal distribution of variables was analyzed using the Kolmogorov–Smirnov test. A P-value of >0.05 was considered to indicate normal distribution. Data are expressed in terms of median and interquartile range in nonnormal distribution variables and as mean ± standard deviation in normal distribution variables, and categorical variables are expressed as numbers or percentages. Chi-squared test or Fisher’s exact test was used for analyzing the correlation between categorical variables. One-way analysis of variance was performed to compare the clinical variables among the 3 groups. Linear trends were used to analyze the correlation between ordinal variables. The data on hsCRP, intact parathyroid hormone (iPTH), BLL, and ferritin levels were log transformed for analysis. To evaluate the variables related to BLL, univariate and multivariate (stepwise method) linear regression analyses were performed to assess the standardized coefficients (β) and 95% confidence intervals (CIs) for the baseline variables, including age, male sex, body mass index (BMI), smoking status, DM, hypertension, previous CVD, hepatitis B virus (HBV) infection, hepatitis C virus (HCV) infection, HD duration, use of erythropoietin (EPO), KT/Vurea, nPCR, nonanuria status, hemoglobin levels, serum albumin levels, serum creatinine levels, corrected-calcium (C-Ca) levels, inorganic phosphate levels, log ferritin levels, log iPTH levels, log hsCRP levels, cholesterol levels, triglyceride levels, and environmental PM2.5 levels/the number of days with PM2.5 exceeding the standard level (variables with P<0.1 in the univariate linear regression were selected for multivariate linear regression). All the nominal variables in the logistic regression were transformed into dummy codes. Missing data were removed using listwise deletion. The level of significance was set at P<0.05.
Results
This study comprised a total of 921 patients on MHD (469 men and 452 women), with a mean MHD duration of 6.68±5.33 years. Moreover, PM2.5 data of 36 monitoring stations from the Taiwan Air Quality Monitoring Network, which is operated by the Environmental Protection Administration, including the database and report on the air quality status in the previous 12 and 24 months, were analyzed. lists the patient characteristics including age, sex, and BMI, in addition to biological, hematological, and HD data. Of all the patients on HD, 50.9% were men, 22% had a medical history of DM, 4.6% had CVDs, 2.7% had lupus, 17.8% were habitual tobacco users, 80.2% had an arteriovenous fistula, 11.3% had HBV infection, 18% had HCV infection, 8.1% had high blood lead concentrations, 44.2% had high-normal blood lead concentrations, and 47.7% had low-normal blood lead concentrations. Patients who were exposed to higher PM2.5 concentration levels and more days with PM2.5 exceeding the standard level had a higher prevalence of high and high-normal BLL and lower prevalence of low-normal BLLs ( and ).
Figure 2 Comparison of patients with low-normal, high-normal, and high BLLs in terms of mean PM2.5 concentrations in the previous 12 and 24 months.
Abbreviations: BLL, blood lead level; PM2.5, particulate matter with diameter <2.5 μm; SD, standard deviation.
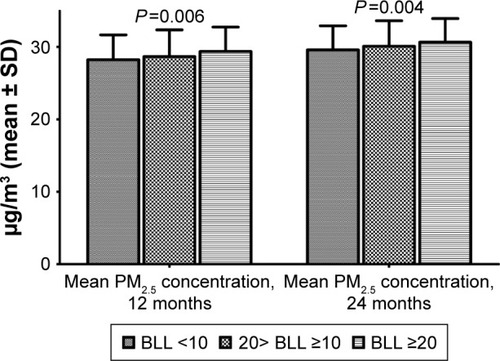
Figure 3 Comparison of patients with low-normal, high-normal, and high BLLs in terms of the number of days with a daily mean PM2.5 concentration of >35 μg/m3 in the previous 12 and 24 months.
Abbreviations: BLL, blood lead level; PM2.5, particulate matter with diameter <2.5 μm; SD, standard deviation.
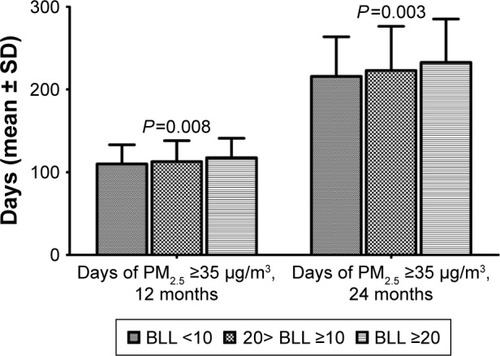
Table 1 Characteristics of 921 study patients on MHD
To further clarify the factors associated with log lead levels in our study patients, we used univariate and multivariate linear regression “stepwise” methods for analyses. presents the univariate linear regression analysis of the clinical variables on BLL. HCV (standardized coefficients [β]: 0.114, 95% CI [0.025, 0.089]), HD duration (β: 0.295, 95% CI [0.008, 0.013]), fistula as blood access (β: 0.069, 95% CI [0.002, 0.065]), HDF (β: 0.166, 95% CI [0.048, 0.109]), Kt/Vurea (β: 0.176, 95% CI [0.068, 0.145]), Hb level (β: 0.111, 95% CI [0.007, 0.025]), C-Ca level (β: 0.073, 95% CI [0.002, 0.029]), log iPTH (β: 0.161, 95% CI [0.031, 0.072]), and environmental PM2.5 concentration (β: 0.107, 95% CI [0.002, 0.009]) were positively associated with log BLLs. In contrast, BMI (β: 0.116, 95% CI [−0.011, −0.003]), DM (β: 0.236, 95% CI [−0.139, −0.081]), EPO use (β: 0.143, 95% CI [−0.148, −0.057]), log ferritin (β: 0.09, 95% CI [−0.062, −0.01]), and log hsCRP (β: 0.067, 95% CI [−0.05, −0.001]) were negatively associated with log BLLs.
Table 2 Univariate linear regression analysis between log Pb and clinical variables in patients on MHD
An advanced multivariate linear regression analysis () indicated that after adjustment for the studied variables, the mean PM2.5 concentration in the previous 12 months (β: 0.158, 95% CI [0.004, 0.013]) was significantly positively correlated with log BLLs. After adjustment for the studied variables, the number of days with PM2.5 exceeding the standard level in the previous 12 months (β: 0.087, 95% CI [0.0001, 0.001]) was positively associated with log BLLs (). We also observed that after adjustment for related factors, the mean environmental PM2.5 concentration (β: 0.191, 95% CI [0.006, 0.016]; ) and the number of days with PM2.5 exceeding the standard level (β: 0.098, 95% CI [0.0001, 0.001]; ) during the 24 months were positively associated with log BLLs.
Table 3 Multivariate linear regression analysis (stepwise method) between log Pb and clinical variables (including PM2.5 concentration)
Table 4 Multivariate linear regression analysis (stepwise method) between log Pb and clinical variables (including days with high PM2.5)
Table 5 Multivariate linear regression analysis (stepwise method) between log Pb and clinical variables (including PM2.5 concentration)
Table 6 Multivariate linear regression analysis (stepwise method) between log Pb and clinical variables (including days with high PM2.5)
Discussion
The results of this study demonstrate that after adjustment for related variables, BLLs exhibited a significantly positive association with environmental PM2.5 in patients on MHD.
In general, the sources of body lead include ingestion and inhalation.Citation18 Educating individuals on the ingestion of lead and avoiding contact with lead-containing appliances should help reduce the BLLs in adults and children. In an analysis of the effect of air lead on BLLs, Hammond et alCitation19 observed a curvilinear relationship between the level of lead in air and that of lead in blood. During 1976–1980, in the US, when the lead level in gasoline was reduced by >50%, the observed blood lead decreased, on average, by 37%.Citation20 Coincidentally, Elinder et alCitation21 reported that in Sweden, from 1980 to 1948, an average decrease in blood lead of ~34% was observed due to the decreased use of lead in gasoline. In addition, factors such as age, sex, and change in residence during the observation period did not influence the result.Citation21 In Taiwan, the use of gasoline without lead had been implemented gradually since 1986 until 2000, when the use of lead-containing gasoline was completely banned. In a 2012 cross-sectional study of 934 children, Lin et alCitation22 demonstrated that the average BLL in children was 1.86±1.55 μg/dL, which is lower than the upper limit value of 5 μg/dL recommended by the Centers for Disease Control, with only 16 children (1.8%) having BLLs exceeding 5 μg/dL and 2 children (0.21%) having BLLs exceeding 10 μg/dL. In addition, a study of 230 cord blood samplesCitation23 demonstrated that the average lead level was 1.14 μg/dL (range: 0.016–4.32 μg/dL). These results evidence that exposure to lead in Taiwan’s environment has improved.
Whether the effect of airborne lead on BLLs ceased after the use of unleaded gasoline warrants discussion. Recently, air pollution, particularly the PM2.5 type, has become the focus of considerable attention. Although the disadvantages of airborne PM2.5 are well known, this is the first study to investigate the effect of airborne PM2.5 on BLLs in patients on MHD. The composition of airborne PM2.5 is complex, and lead was found to be its main component.Citation7 Of the sources of PM2.5 in Taiwan, 23% were vehicles and exposed dust, 22.7% were road transport, 13.5% were agriculture, 8.5% were catering, 7.2% were construction industry and mines, 4.5% were basic steel industries, 4% were electric power industries, 2.8% were chemical materials manufacturing, 2.3% were cement and ready-mixed concrete, and 11.4% were others.Citation24 In Taiwan, secondary aerosols (NH4+, NO3−, and SO42−) constituted ~50%–60% of the chemical composition of PM2.5 mass.Citation25 The mass percentage of lead in PM2.5 was different in different sources (~15% in industrial emissions, 0% in secondary aerosols, 7.5% in soil dust, 5% in sea salt, and 85% in vehicle emissions).Citation26 Chen et alCitation27 found that the lead component in PM2.5 mainly existed in an insoluble form, accounting for 78.9% of the total amount of lead, whereas water-soluble and liposoluble lead constituted 20.6% and 0.3% of the total amount of lead, respectively. In addition, the authors indicated that water-soluble lead, rather than insoluble lead, in PM2.5 may be a potential source of blood lead in adults. The results of these studies are consistent with our findings of the positive correlation between BLLs and PM2.5 concentrations or the duration of PM2.5 exceeding normal values. Several studies have clearly demonstrated the cardiovascular, pulmonary, carcinogenic, and mortality risks of airborne PM2.5.Citation28–Citation33 Moreover, BLLs have been related to iPTH levels, hemoglobin levels, blood pressure, and mortality in patients on MHD.Citation1,Citation4,Citation34,Citation35 Whether BLL is an intermediate medium between airborne PM2.5 and cardio vascular events or mortality in patients on MHD requires clarification in future studies.
The pharmacokinetics of lead in humans is complex. Most of the lead absorbed in the body is excreted through either renal clearance or biliary clearance in feces. Generally, in healthy people, significant drops in BLLs may occur over several months, or sometimes years, even after complete elimination of exposure to the lead sources.Citation36 Blood lead is excreted in both the urine and feces in healthy individuals, and the dose of exposure could affect the excretion volume.Citation37,Citation38 However, in patients with renal failure, blood lead excretion is aggravated because of the loss of renal clearance. Therefore, patients on HD have significantly higher mean BLLs than healthy individuals.Citation1–Citation3 According to our review of the relevant literature, studies on particulate matter in terms of BLLs are limited. Enkhbat et alCitation39 and Batterman et alCitation40 have revealed no significant correlation between particulate matter concentrations and BLLs in children and middle-aged women. However, in a study involving nonhuman primates, O’Flaherty et alCitation41 indicated that the urinary clearance of absorbed lead in these animals was 14%–24% of the estimated glomerular filtration rate and that fecal clearance was 78%–85% of the urinary clearance; however, fecal clearance was anomalous and appeared to be an artifact of a very high dose. Two studiesCitation37,Citation41 have demonstrated the importance of blood lead excretion in urine. However, the participants in the studies of Enkhbat et alCitation39 and Batterman et alCitation40 were healthy without renal insufficiency or dialysis receipt, which suggests that both normal urinary and fecal excretion of blood lead can maintain stable BLLs during chronic exposure to environmental PM2.5. The loss of renal function in our study patients was possibly the reason for obtaining accumulative BLLs during the chronic exposure to environmental PM2.5 in our patients on HD.
A linear regression analysis revealed that within the previous 12 and 24 months, both the mean PM2.5 concentrations and the number of days with PM2.5 exceeding the standard level were positively correlated with BLLs in our study patients; this finding indicates the probability of chronic accumulation of blood lead from inspired PM2.5. In , the mean concentration difference between the 3 groups did not exceed 35 μg/m3. However, illustrates that the higher the number of days exceeding the standard PM2.5 exposure level, the higher the BLLs. The odds ratio of the number of days with PM2.5 exceeding the standard level during 24 months (0.098) was higher than that during 12 months (0.087; and ). Exposure is characterized by the magnitude, frequency, and duration of contact with an agent. Therefore, the number of days exceeding the standard value (≥35 μg/m3) is an important factor in our chronic PM2.5 exposure assessment.
This study has some limitations. First, data on whether there was a daily intake of lead through food were unavailable. However, in our dialysis centers, diet/nutrition education (including the importance of avoiding heavy metals) is routinely provided to patients. In addition, in our unpublished study, we found that deep-sea fish ingestion is not a factor for elevated BLLs in patients on HD. Second, the present study applied a cross-sectional design, and we determined only the correlation between environmental PM2.5 and BLLs and not the cause–effect relationship. However, we used the mean PM2.5 levels in the previous 12 and 24 months for our analysis of BLLs, which appears to be similar to a semicohort-designed study. Our study suggests that chronic environmental PM2.5 exposure might be associated with the accumulation of blood lead in patients on MHD who have lost the normal ability of urinary excretion of lead. Third, exposure misclassification could not be avoided, which indicates that we may have underestimated or overestimated the correlation between environmental PM2.5 and BLLs by using short-term air pollutant levels. To reduce the study error, we used the mean PM2.5 levels in the previous 12 and 24 months for analysis.
Conclusion
After adjustment for related factors, we found that chronic exposure to PM2.5 in living environments was positively associated with BLLs in patients on MHD. Therefore, the study findings suggest the existence of a possible correlation between environmental air quality and heavy metal levels in the blood of patients on MHD.
Author contributions
All authors contributed toward data analysis, drafting and critically revising the paper and agree to be accountable for all aspects of the work.
Acknowledgments
We thank the members of the Statistical Center of Chang Gung Memorial Hospital and Hemodialysis Center in Chang Gung Memorial Hospital for their invaluable and dedicated assistance. We also acknowledge Wallace Academic Editing for editing this manuscript. Wen-Hung Huang and Tzung-Hai Yen received research grants from Chang Gung Memorial Hospital, Linkou (CMRPG3D0323).
Disclosure
The authors report no conflicts of interest in this work.
References
- ColleoniNArrigoGGandiniECoriglianoCD’AmicoGBlood lead in hemodialysis patientsAm J Nephrol19931331982028213931
- DavenportAMurcuttGWhitingSCross-sectional audit of blood lead levels in regular outpatient haemodialysis patients dialysing in north LondonNephrology (Carlton)200914547648119674316
- LeeSHHuangJWHungKYTrace metals’ abnormalities in hemodialysis patients: relationship with medicationsArtif Organs2000241184184411119069
- LinJLLin-TanDTHsuCWAssociation of blood lead levels with mortality in patients on maintenance hemodialysisAm J Med2011124435035821435426
- LinJLLin-TanDTChenKHBlood lead levels association with 18-month all-cause mortality in patients with chronic peritoneal dialysisNephrol Dial Transplant20102551627163320031932
- SharmaRPervezSEnrichment and exposure of particulate lead in a traffic environment in IndiaEnviron Geochem Health200325329730612971251
- ZereiniFAltFMesserschmidtJConcentration and distribution of heavy metals in urban airborne particulate matter in Frankfurt am Main, GermanyEnviron Sci Technol20053992983298915926542
- LinJLLin-TanDTYenTHBlood lead levels, malnutrition, inflammation, and mortality in patients with diabetes treated by long-term hemodialysisAm J Kidney Dis200851110711518155539
- DaugirdasJTThe post: pre-dialysis plasma urea nitrogen ratio to estimate K.t/V and NPCR: mathematical modelingInt J Artif Organs19891274114192767786
- SargentJAControl of dialysis by a single-pool urea model: the National Cooperative Dialysis StudyKidney Int Suppl198313S19S25
- LinJLTanDTHoHHYuCCEnvironmental lead exposure and urate excretion in the general populationAm J Med2002113756356812459402
- Taiwan Air Quality Monitoring Network (TAQMN) [webpage on the Internet]Taiwan Air Quality Monitoring Network (TAQMN) Operated by the Environmental Protection Administration (EPA 2016)2016 Available from: http://taqm.epa.gov.tw/taqm/zh-tw/default.aspxAccessed September 6, 2016
- HuangWHLinJLLin-TanDTChenKHHsuCWYenTHImpact of living environment on 2-year mortality in elderly maintenance hemodialysis patientsPLoS One201389e7435824058552
- HuangWHYenTHChanMJSuYJEnvironmental carbon monoxide level is associated with the level of high-sensitivity C-reactive protein in peritoneal dialysis patientsMedicine (Baltimore)20149326e18125474434
- HuangWHYenTHChanMJSuYJImpact of environmental particulate matter and peritoneal dialysis-related infection in patients undergoing peritoneal dialysisMedicine (Baltimore)20149325e14925437027
- LinJHYenTHWengCHHuangWHEnvironmental NO2 level is associated with 2-year mortality in patients undergoing peritoneal dialysisMedicine (Baltimore)2015941e36825569659
- WengCHHuCCYenTHHuangWHAssociation between environmental particulate matter and arterial stiffness in patients undergoing hemodialysisBMC Cardiovasc Disord20151511526445316
- BarryPSThe current lead pollution problemPostgrad Med J19755160178378754912
- HammondPBO’FlahertyEJGartsidePSThe impact of air-lead on blood-lead in man – a critique of the recent literatureFood Cosmet Toxicol19811956316387030888
- AnnestJLPirkleJLMakucDNeeseJWBayseDDKovarMGChronological trend in blood lead levels between 1976 and 1980N Engl J Med198330823137313776188954
- ElinderCGFribergLLindBNilssonBSvartengrenMOvermarkIDecreased blood lead levels in residents of Stockholm for the period 1980–1984Scand J Work Environ Health19861221141203726492
- LinYHLinCYWangIJHuangYHSurvey on blood lead levels of the preschool children in Taiwan, 2011Taiwan J Public Health201231285298
- LinCCChenYCSuFCIn utero exposure to environmental lead and manganese and neurodevelopment at 2 years of ageEnviron Res2013123525723578827
- Environmental Protection Administration [webpage on the Internet]Environmental Protection Agency Announced all Kinds of Pollution Sources PM2.5 Operated by the Environmental Protection Administration (EPA 2015)2015 Available from: http://enews.epa.gov.tw/enews/fact_Newsdetail.asp?InputTime=1040428103015Accessed February 28, 2017
- LuHYLinSLMwangiJKWangLCLinHYCharacteristics and source apportionment of atmospheric PM2.5 at a coastal city in Southern TaiwanAerosol Air Qual Res20161610221034
- GugamsettyBWeiHLiuCNSource characterization and apportionment of PM10, PM2.5 and PM0.1 by using positive matrix factorizationAerosol Air Qual Res201212476491
- ChenXWangXYLiuYSpeciation analysis of lead and its isotopes in fine particulate matters in Beijing by ICP-MSGuang Pu Xue Yu Guang Pu Fen Xi200929251551819445241
- Raaschou-NielsenOAndersenZJBeelenRAir pollution and lung cancer incidence in 17 European cohorts: prospective analyses from the European Study of Cohorts for Air Pollution Effects (ESCAPE)Lancet Oncol201314981382223849838
- CohenAJRoss AndersonHOstroBThe global burden of disease due to outdoor air pollutionJ Toxicol Environ Health A20056813–141301130716024504
- PopeCA3rdBurnettRTThunMJLung cancer, cardiopulmonary mortality, and long-term exposure to fine particulate air pollutionJAMA200228791132114111879110
- CesaroniGForastiereFStafoggiaMLong term exposure to ambient air pollution and incidence of acute coronary events: prospective cohort study and meta-analysis in 11 European cohorts from the ESCAPE ProjectBMJ2014348f741224452269
- NawrotTSPerezLKunzliNMuntersENemeryBPublic health importance of triggers of myocardial infarction: a comparative risk assessmentLancet2011377976773274021353301
- LadenFSchwartzJSpeizerFEDockeryDWReduction in fine particulate air pollution and mortality: extended follow-up of the Harvard Six Cities StudyAm J Respir Crit Care Med2006173666767216424447
- KrachlerMWirnsbergerGHLong-term changes of plasma trace element concentrations in chronic hemodialysis patientsBlood Purif200018213814310838473
- KesslerMDurandPYHuuTCMobilization of lead from bone in end-stage renal failure patients with secondary hyperparathyroidismNephrol Dial Transplant199914112731273310534522
- ChristopherPHolstegeM webpage on the InternetPathophysiology and Etiology of Lead Toxicity2016 Available from: http://emedicine.medscape.com/article/2060369-overviewAccessed May, 2016
- MilletHThe excretion of lead in urineJ Biol Chem192983265268
- KehoeRAThamannFThe excretion of leadJAMA19299214181421
- EnkhbatURuleAMResnickCOchirCOlkhanudPWilliamsDLExposure to PM2.5 and blood lead level in two populations in Ulaanbaatar, MongoliaInt J Environ Res Public Health201613221426891308
- BattermanSSuFCJiaCNaidooRNRobinsTNaikIManganese and lead in children’s blood and airborne particulate matter in Durban, South AfricaSci Total Environ201140961058106821211823
- O’FlahertyEJInskipMJYagminasAPFranklinCAPlasma and blood lead concentrations, lead absorption, and lead excretion in nonhuman primatesToxicol Appl Pharmacol199613811211308658501