
Abstract
Background and purpose
To investigate the effects of vitamin D supplementation on glucose homeostasis and lipid profile in type 2 diabetic patients who have vitamin D deficiency.
Patients and methods
One hundred twenty-five type 2 diabetic patients taking oral hypoglycemic agents as mono- or combination therapy were recruited from the diabetes and endocrinology clinic. Subject demographics, duration of diabetes, antidiabetic medication, body mass index (BMI), pulse, and blood pressure (BP) were assessed. Laboratory measurements of serum vitamin D3 level, hemoglobin A1c (HbA1c), fasting plasma glucose (FPG), and lipid profile were measured. Homeostatic model assessment-insulin resistance (HOMA-IR) was calculated whenever fasting insulin (FI) was available. Forty-one patients (27 males and 14 females) were started on cholecalciferol replacement–45,000 units once weekly for 8 weeks and then 22,500 units once weekly for 16 weeks. Calcium carbonate tablets 500 mg once daily were also prescribed for the initial 2 months of treatment. Measured variables were reassessed after 6 months of replacement therapy. During the trial, subjects were instructed not to change their diabetes drugs or lifestyle.
Results
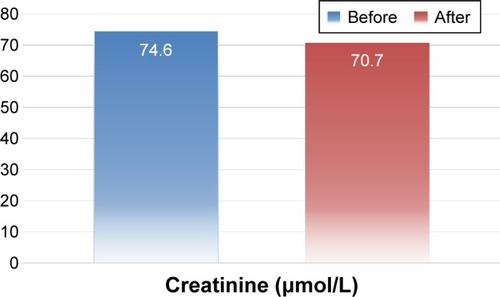
No significant association was found between vitamin D3 level and any of the measured variables apart from a significant positive correlation with blood urea nitrogen. Vitamin D3 replacement was associated with a significant increase in its level (14.0±4.0 vs 31.0 vs 7.9 ng/mL, P<0.001). This was associated with a significant reduction of HbA1c (7.9±1.7 vs 7.4%±1.2%, P=0.001) and FPG (9.1±4.3 vs 7.9±2.4 mmol/L, P=0.034). Mean reduction of HbA1c was 0.54% and that of FPG was 1.22 mmol/L. FI, c-peptide and insulin resistance (IR) were reduced but this was statistically insignificant (P=0.069, 0.376, 0.058, respectively). FI decreased by 22%, HOMA-IR by 27.6%, and c-peptide by 1.83%. Total cholesterol, low-density lipoprotein cholesterol, parathyroid hormone, alkaline phosphatase, serum creatinine, and pulse rate significantly decreased (4.3±0.9 vs 4.0±0.9 mmol/L, P=0.036; 2.5±0.8 vs 2.2±0.8 mmol/L, P=0.018; 4.6±2.1 vs 3.5±1.8 pmol/L, P=0.001; 82.1±26.2 vs 66.2±19.5 U/L, P<0.001; 74.6±15.6 vs 70.7±14.7 μmol/L, P=0.047; and 81.6±11.9 vs 77.5±12.0 bpm, P=0.045, respectively). Triglycerides and high-density lipoprotein cholesterol, both systolic and diastolic BP, and BMI did not show significant change.
Conclusion
Cholecalciferol helps improve blood glucose control and cholesterol profile in vitamin D3-deficient type 2 diabetic patients.
Introduction
Recently, type 2 diabetes mellitus (T2DM) is considered as one of the nonskeletal diseases associated with vitamin D deficiency.Citation1 Both T2DM and vitamin D deficiency have similar risk factors, such as obesity, aging, and sedentary lifestyle.Citation2 Cardiovascular diseases (CVDs) and metabolic syndrome disorders are also associated with vitamin D deficiency.Citation3
Vitamin D plays a functional role in glucose homeostasis through its effects on insulin secretion and sensitivity.Citation4 It may reduce insulin resistance (IR) indirectly through its effect on calcium and phosphate metabolism and through upregulation of the insulin receptor gene.Citation5
There are several postulated mechanisms to explain the association between vitamin D deficiency and CVD, such as IR, secondary hyperparathyroidism, and inflammation.Citation6 Regulation of the lipid profile is also one of the proposed mechanisms.Citation7
Dyslipidemia is a well-described independent risk factor for CVD. High 25-hydroxyvitamin D levels are associated with a favorable lipid profile, whereas low levels are associated with atherogenic serum lipids, as shown in some observational studies.Citation8,Citation9 However, intervention studies showed controversial results.Citation8
The objective of this study was to determine the effect of vitamin D replacement on fasting plasma glucose (FPG), hemoglobin A1c (HbA1c), and lipid profile in vitamin D-deficient type 2 diabetic patients.
Patients and methods
One hundred twenty-five adults with a mean age of 52.7±10.3 years, a T2DM duration of 6.7±6.1 years taking oral hypoglycemic agents (sulfonylurea, metformin, dipeptidyl-peptidase inhibitors, and pioglitazone) as mono- or combination therapy were recruited from the diabetes and endocrinology clinic from March to September, 2015. The study was already approved by Medical Ethics and Research Committee of King Fahd Hospital, Asir province, Saudi Arabia, and written informed consent was obtained from all participants.
Exclusion criteria included pregnancy, lactation, use of drugs affecting the lipid profile or calcium and bone metabolism, endocrinology disorders, such as hypo- or hyperthyroidism and hyperparathyroidism, smoking, insulin injection, use of antiepileptic drugs, and vitamin D or calcium supplementation. Known sarcoidosis, tuberculosis, potential terminal illness, inflammatory bowel disease, liver or kidney disease and malignancy were also excluded.
Subject demographics, such as age, sex, duration of diabetes, and current antidiabetic medication, were recorded. Body mass index (BMI) was calculated as per the standard equation (mass [kg]/height [m2]). Weight was measured with a digital scale (Seca 701, Seca, Hamburg, Germany) with a calibrated stadiometer. Both the height and the weight were taken at baseline and follow-up. Blood pressure (BP) was assessed using an automated BP device (Dinamap pro 100v2, GE Medical Systems, Freiburg, Germany) with an appropriate cuff size. Two measurements of systolic BP (SBP) and diastolic BP (DBP) were made 5 minutes apart with the lower reading recorded.
Only 41 patients (27 males and 14 females) were followed until the end of the study (some of the patients preferred to continue with their primary health care center nearby, some had some changes in their medicine, others missed follow-up in our clinic). They received cholecalciferol 45,000 units once weekly for 8 weeks, then 22,500 units once weekly for 16 weeks. Calcium carbonate tablets 500 mg once daily were also prescribed for the first 2 months of treatment.
All variables were measured before and after cholecalciferol supplementation. During the study time, all patients were followed and interviewed to confirm that no change in their medicine or lifestyle was made and that they did not develop side effects of treatment and to check adherence as well.
We measured vitamin D3 level, HbA1c, FPG, and lipid profile for all patients. Other laboratory parameters such as alkaline phosphatase, serum creatinine, blood urea nitrogen (BUN), serum calcium, phosphorus, and fasting insulin (FI) were measured whenever possible (because of availability in the laboratory and financial reasons). IR was calculated by homeostatic model assessment-insulin resistance (HOMA-IR) when FI was available. Measurements were performed in the beginning and at the end of the study.
Blood samples were collected from all participants, after an overnight fasting and left to clot. Sera were separated by centrifuging blood at 3,000 rpm for 15 minutes and stored at −20°C until analysis. Sera for lipids were centrifuged for 10 minutes at 3,000 rpm, for collection of the aqueous phase.
Vitamin D3 was measured using the 25(OH) vitamin D3 ELISA Kit (Immundiagnostik, Bensheim and Biomedica, Vienna, Austria) according to the manufacturer’s instruction using a sunrise plate reader at 450 nm against 620 nm as a reference.Citation10
Total cholesterol (TC), high-density lipoprotein cholesterol (HDL-C), and TG were measured by BioMerieux Laboratory, Marcy l’Etoile, France.Citation11,Citation12 Low-density lipoprotein cholesterol (LDL-C) was calculated according to the Friedewald formula.Citation13 Serum glucose was determined colorimetrically according to the method of Trinder.Citation14 HbA1c was measured immunoturbidimetrically (using COBAS INTEGTRA 400 machine; Roche Diagnostics, Indianapolis, IN, USA). The final result was expressed as HbA1c percent and is calculated from the HbA1c/Hb ratio, including a conversion equation to match a high performance liquid chromatography reference method. HbA1c (%) = HbA1c/Hb ×175.8+1.73.Citation15
Calcium, phosphate, and alkaline phosphatase were assessed colorimetrically using calcium detection kit (product number ab102505), phosphate assay kit (product number ab65622), and alkaline phosphatase kit (product number ab83369) purchased from Abcam (Cambridge, UK). Gamma glutamyl transferase was measured using Reflotron Plus Analyzer and Roche kits (Roche Diagnostics GmbH, Mannheim, Germany).
The ELISA machine was used to read the absorbance in the samples. Vitamin D deficiency was defined as a serum level of 25(OH)D <20 ng/mL and insufficiency for a level of 20–29 ng/mL.Citation16 HOMA-IR was calculated based on the formula: HOMA-IR = FPG (mmol/L) × insulin (μIu/mL)/22.5.Citation17
Statistical analysis
Data were analyzed using the Statistical Package for Social Sciences (IBM SPSS, version 20). Descriptive statistics for variables were calculated (ie, frequency, mean, and standard deviation). Tests of significance were applied, for example, paired t-test and Pearson’s correlation coefficient. P-values <0.5 were considered as statistically significant.
Results
The study included 125 diabetic patients (57 women and 68 men) aged 52.7±10.3 years, with a BMI of 33.0±6.1 kg/m2 and a diabetes duration of 6.7±6.1 years ().
Table 1 Personal characteristics and baseline laboratory para meters of the study sample
Eighteen patients (14.4%) had vitamin D insufficiency (20–30 ng/mL) and 107 patients (85.6%) had vitamin D deficiency (level <20 ng/mL). No significant association was found between vitamin D level and any measured variables apart from the significant positive correlation with BUN ().
Table 2 Correlation between initial serum levels of vitamin D3 and measured laboratory variables
Vitamin D3 replacement was associated with a significant increase in its level (14.0±4.0 vs 31.0±7.9, P<0.001) with all 41 cases achieving a level >20 ng/mL and 63% of patients achieving a level >30 ng/mL. This was associated with a significant reduction of HbA1c (7.9±1.7 vs 7.4±1.2, P=0.001) and FPG (9.1±4.3 vs 7.9±2.4, P=0.034). Mean reduction of HbA1c was 0.54% and that of FPG was 1.2 mmol/L. FI, c-peptide, and IR decreased, but this was statistically insignificant (P=0.069, 0.376, and 0.058, respectively). FI was reduced by 22%, IR by 27.6%, and c-peptide by 1.8% (; ).
Figure 1 Change in hemoglobin A1c (HbA1c) after vitamin D intake.
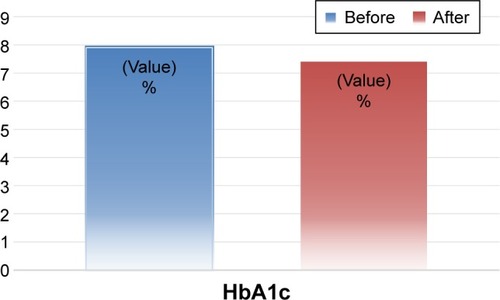
Table 3 Changes in different variables with vitamin D3 replacement
Both TC and LDL-C significantly decreased (4.3±0.9 vs 4.0±0.9, P=0.036 and 2.5±0.8 vs 2.2±0.8, P=0.018, respectively). Triglycerides and HDL-C did not show significant changes (P=0.874 and 0.444, respectively).
Parathyroid hormone (PTH) and alkaline phosphatase significantly decreased with cholecalciferol therapy (4.6±2.1 vs 3.5±1.8, P=0.001 and 82.1±26.2 vs 66.2±19.5, P<0.001, respectively). There was no change in serum calcium level, but serum phosphate level significantly increased (P=0.75, 0.02, respectively). Interestingly, serum creatinine significantly decreased (74.6±15.6 vs 70.7±14.7, P=0.047). Pulse rate was significantly reduced (81.6±11.9 vs 77.5±12.0, P=0.045). There was a trend toward the reduction of SBP, but this did not reach a statistical significance (P=0.081). No significant change in DBP or BMI was noticed (; ).
Figure 2 Change of serum creatinine after vitamin D intake.
It was also found that the higher the initial vitamin D3 level, the more the change of FI, HOMA-IR, and c-peptide. There was no significant association between basal vitamin D3 and the change in FPG, HbA1c, TC, and LDL-C after replacement. Also the higher the baseline values of FPG, HbA1c, FI, creatinine, LDL-C, and TC, the smaller the reduction of vitamin D intake. We could not find a significant correlation between the reduction in PTH and the change in FPG, HbA1c, FI, HOMA-IR, c-peptide, TC, or LDL-C. A significant and direct association between the reduction of alkaline phosphatase and the decrease in both FPG and HbA1c was noticed (P=0.001 and 0.001, respectively). There was a negative correlation between the change in PTH level and the reduction in serum creatinine; the more the decrease in PTH, the less the decrease in creatinine (P=0.049) (–; ).
Figure 3 Change in hemoglobin A1c (HbA1c) in relation with its initial level before treatment.
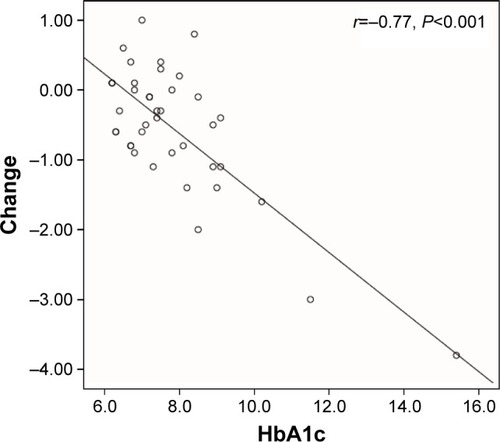
Table 4 Correlation coefficients between changes in laboratory variables with their initial levels before treatment
Table 5 Mean percent changes for different laboratory variables
Table 6 Mean changes for different laboratory variables
Table 8 The correlation coefficients between parathyroid hormone, alkaline phosphatase and phosphate levels with different laboratory variables
Discussion
Similar to our study in Saudi type 2 diabetic subjects, Al-Daghri et al found a positive effect of vitamin D intake on HbA1c and insulin sensitivity based on HOMA-IR and HOMA-β.Citation18 There was also a significant decrease in LDL-C and TC without changes in TG or HDL-C, although only a mean increase of serum vitamin D3 was 8 ng/mL with suboptimal final level.Citation18 Our study supports the positive effect of vitamin D supplementation on glycemic control in T2DM and associated dyslipidemia in Saudi patients, although the duration of therapy and regimen of vitamin D supplementation and its mean increase are different.
In the retrospective study conducted by Sabherwal et al on South Asians with established T2DM, patients were treated with combined oral vitamin D3 and calcium for 3 months. Post treatment, a significant decrease in HbA1c was achieved in the deficiency and insufficiency groups (0.70%±0.77%, P<0.001 and 0.21%±0.28%, P=0.001, respectively). The change in weight was only significant in the vitamin D-deficient group. There were also negative correlations between the changes in HbA1c and weight with the change in vitamin D (P<0.05).Citation19
In our study, the significant reduction in pulse rate may be explained by the presence of vitamin D receptors in the t-tubules in the heart which are ideally positioned to exert an immediate effect on signal transduction mediators and ion channelsCitation20 ( and ).
Table 7 Correlation between initial levels of vitamin D and changes in different laboratory variables
In Soric et al’s study, patients with higher baseline HbA1c had a significantly greater reduction in HbA1c on receiving vitamin D for 12 weeks. This reduction was only significant when baseline HbA1c was >9%.Citation21 In our study, the higher the baseline values of FPG, HbA1c, FI, HOMA-IR, c-peptide, TC, LDL-C, the smaller the reduction of each.
von Hurst et al, in their study, showed improved insulin sensitivity.Citation22 However, Talaei et al showed that the effect of vitamin D3 on IR was significant only when its concentration was 40–60 ng/mL, and in lower and upper concentrations, it had no effect.Citation23 Thus, the insignificant change in FI and IR in our study may be attributed to the final vitamin D3 level (31 ng/mL) or to the small number of patients for whom these variables were available.
In our study, HOMA-IR decreased by 27.6% with a mean increase of vitamin D3 of 17 ng/mL, whereas in the study by Sugden et al, HOMA-IR significantly improved with an increase of ≥11 nmol/L. However, they did not show a significant change in HbA1c.Citation24
In Shab-Bidar et al’s study, there was also a significant improvement in FPG, the Quantitative Insulin Check Index, and HbA1c.Citation25 Tabesh et al found that the effect of vitamin D on glucose homeostasis was evident and significant only when it was administered in combination with calcium and not as monotherapy.Citation26 In our study, oral calcium carbonate 500 mg was given once daily for the first 2 months of treatment.
In contrary to Chiu et al’s report,Citation27 we could not find a significant association between the initial vitamin D3 level and FPG, A1c, FI, HOMA-IR, or lipid profile. Vitamin D effects on insulin sensitivity and diabetes may be explained by the presence of vitamin D receptors on pancreatic β cellsCitation1 and skeletal muscle,Citation28 and by the presence of vitamin D response in the insulin gene.Citation5,Citation29 Vitamin D attenuates the expression of proinflammatory cytokines involved in IR.Citation5,Citation30 It also increases intracellular calcium, thus increasing glucose transport into the cells.Citation31 It regulates nuclear peroxisome proliferative-activated receptor that plays a great role in insulin sensitivity.Citation32 Correction of secondary hyperparathyroidism is another suggested mechanism of action.Citation33 In our study, there was a significant reduction in PTH and alkaline phosphatase with an increase in phosphate level.
In the randomized controlled trials that were published until 2015, Jafari et al found that vitamin D significantly reduced serum TC and LDL-C in patients with T2DM, but serum TG and HDL-C did not show significant changes. Baseline vitamin D3, its dosage, intervention duration, and the method of its intake influence the effect on lipid markers.Citation34 Our study results are in complete concordance with the results of this meta-analysis.
Shab-Bidar et al also observed a positive effect of vitamin D-fortified yogurt on serum lipids (TG and HDL-C) compared with plain yogurt.Citation25 Similarly, the effect of vitamin D on LDL-C and TC/HDL-C was evident and significant in combined vitamin D and calcium administration in Tabesh et al’s trial.Citation26
In Ramiro-Lozano and Calvo-Romero’s study,Citation35 vitamin D was given to 41 diabetic patients with vitamin D deficiency and insufficiency. All patients achieved a serum level of 25(OH)D >20 ng/mL and 25 patients (89.3%) >30 ng/mL. There was a significant reduction in TC, a trend but not a statistically significant reduction in LDL-C (P=0.05) and non-HDL-C (P=0.09). No change in HDL-C was obtained. Similar to our study, there was no significant change in serum calcium level.
Some authors suggest that possible extraskeletal effects of vitamin D require concentrations >28–32 ng/mL.Citation36 Studies conducted by Breslavsky et al and Patel et al indicate that vitamin D treatment improving but not optimizing its level does not improve glycemia, insulin sensitivity, or lipid profile.Citation37,Citation38 Other studies about vitamin D replacement in diabetic patients in the absence of deficiency showed no significant effect on serum lipids.Citation23
Reduction of serum creatinine in our study indicates a positive effect of vitamin D on kidney function in diabetic patients even with normal baseline. In support of our study, de Boer et al found a strong association between low serum vitamin D and the risk of loss of kidney function, as calculated by estimated glomerular filtration rate (eGFR) in people with normal kidney. Over 4 years of follow-up, each 10 ng/mL lower 25(OH)D was associated with a 25% greater risk of rapid eGFR loss. When compared with 25(OH)D concentration of $30 ng/mL, 25(OH)D concentration <15 ng/mL was associated with a 68% greater adjusted risk of rapid eGFR loss. The association of lower 25(OH)D concentration with eGFR loss was strongest among participants with diabetes.Citation39
Renin–angiotensin–aldosterone system (RAAS) activation and hyperfiltration characterize diabetic kidney disease.Citation40 In animal models, vitamin D suppresses the RAAS, especially in hyper-reninemic states such as treatment with angiotensin receptor blockers, which are in common use in diabetic patients.Citation41 Clinical trials also indicate that paricalcitol lowers albuminuria in diabetic kidney disease.Citation42
Conclusion
Our study is the second of its type in the Saudi population with results indicating that vitamin D replenishment can improve glucose homeostasis and cholesterol profile in diabetic patients. It also indicates the high prevalence of this vitamin deficiency in both men and women. Through this study and other studies in this region, we can conclude the importance of vitamin D screening and replacement in this population. Because our study is small and did not include a placebo group, we recommend controlled trials with eminent number of patients of this ethnicity to reach a solid conclusion. Our results also suggest that future vitamin D intervention studies might target persons with diabetes for reasons beyond the effects on blood sugar and lipids such as the effects on kidney function in the absence of apparent kidney disease.
Disclosure
The authors report no conflicts of interest in this work.
References
- ZittermannAVitamin D and disease prevention with special reference to cardiovascular diseaseProg Biophys Mol Biol2006921394816600341
- AlvarezJAAshrafARole of vitamin D in insulin secretion and insulin sensitivity for glucose homeostasisInt J Endocrinol2010201035138520011094
- FossYJVitamin D deficiency is the cause of common obesityMed Hypotheses200972331432119054627
- PalomerXGonzález-ClementeJMBlanco-VacaFMauricioDRole of vitamin D in the pathogenesis of type 2 diabetes mellitusDiabetes Obes Metab200810318519718269634
- MaestroBMoleroSBajoSDávilaNCalleCTranscriptional activation of the human insulin receptor gene by 1,25-dihydroxyvitamin DCell Biochem Funct200220322723212125099
- ZittermannASchleithoffSSKoerferRPutting cardiovascular disease and vitamin D insufficiency into perspectiveBr J Nutr200594448349216197570
- SaedisomeoliaATaheriEDjalaliMMoghadamAMQorbaniMAssociation between serum level of vitamin D and lipid profiles in type 2 diabetic patients in IranJ Diabetes Metab Disord2014131724398023
- JordeRGrimnesGVitamin D and metabolic health with special reference to the effect of vitamin D on serum lipidsProg Lipid Res201150430331221640757
- WangHXiaNYangYPengDInfluence of vitamin D supplementation on plasma lipid profiles: a meta-analysis of randomized controlled trialsLipids Health Dis2012114222433171
- VogeserMApostolos Kyriat Soulis: candidate reference. Methodology for the quantification of circulating 25-hydroxy vitamin D3 by liquid chromatography-tandem mass spectrometryClin Chem2004501415151715277348
- FossatiPPrencipLSerum triglycerides determined colorimetrically with an enzyme that produces hydrogen peroxidaseClin Chem19822810207720806812986
- HinoKNakamuraMA new method for the homogenous assay of serum HDL-cholesterolClin Chem1996425299
- WarnickGRKnoppRHFitzpatrickVBransonLEstimating low-density lipoprotein cholesterol by the Friedewald equation is adequate for classifying patients on the basis of nationally recommended cut-pointsClin Chem199036115192297909
- TrinderPDetermination of glucose in blood using glucosenoxidase with an alternative oxygen acceptorAnn Clin Biochemis196962427
- GencSOmerBGurdolFAycan-UstyolEInceNBalFEvaluation of turbidimetric inhibition immunoassay (TINIA) and HPLC methods for glycated haemoglobin determinationJ Clin Lab Anal201226648148523143632
- Dawson-HughesBHeaneyRPHolickMFLipsPMeunierPJViethREstimates of optimal vitamin D statusOsteoporos Int200516771371615776217
- MuniyappaRLeeSChenHQuonMJCurrent approaches for assessing insulin sensitivity and resistance in vivo: advantages, limitations, and appropriate usageAm J Physiol Endocrinol Metab200829411526
- Al-DaghriNMAlkharfyKMAl-OthmanAVitamin D supplementation as an adjuvant therapy for patients with T2DM: an 18-month prospective interventional studyCardiovasc Diabetol2012118522809461
- SabherwalSBravisVDevendraDEffect of oral vitamin D and calcium replacement on glycaemic control in South Asian patients with type 2 diabetesInt J Clin Pract20106481084108920642708
- TishkoffDXNibbelinkKAHolmbergKHDanduLSimpsonRUFunctional vitamin D receptor (VDR) in the t-tubules of cardiac myocytes: VDR knockout cardiomyocyte contractilityEndocrinology2008149255856417974622
- SoricMMRennerETSmithSREffect of daily vitamin D supplementation on HbA1c in patients with uncontrolled type 2 diabetes mellitus: a pilot studyJ Diabetes20124110410522018074
- von HurstPRStonehouseWCoadJVitamin D supplementation reduces insulin resistance in South Asian women living in New Zealand who are insulin resistant and vitamin D deficient – a randomised, placebo-controlled trialBr J Nutr2009103454955519781131
- TalaeiAMohamadiMAdgiZThe effect of vitamin D on insulin resistance in patients with type 2 diabetesDiabetol Metab Syndr201351823443033
- SugdenJADaviesJIWithamMDMorrisADStruthersADVitamin D improves endothelial function in patients with Type 2 diabetes mellitus and low vitamin D levelsDiabet Med200825332032518279409
- Shab-BidarSNeyestaniTRDjazayeryARegular consumption of vitamin D-fortified yogurt drink (Doogh) improved endothelial biomarkers in subjects with type 2 diabetes: a randomized double-blind clinical trialBMC Med2011912522114787
- TabeshMAzadbakhtLFaghihimaniETabeshMEsmaillzadehAEffects of calcium-vitamin D co-supplementation on metabolic profiles in vitamin D insufficient people with type 2 diabetes: a randomised controlled clinical trialDiabetologia201457102038204725005333
- ChiuKCChuAGoVLSaadMFHypovitaminosis D is associated with insulin resistance and beta cell dysfunctionAm J Clin Nutr200479582082515113720
- SimpsonRUThomasGAArnoldAJIdentification of 1,25-dihydroxyvitamin D3 receptors and activities in muscleJ Biol Chem198526015888288912991224
- MaestroBDávilaNCarranzaMCCalleCIdentification of a Vitamin D response element in the human insulin receptor gene promoterJ Steroid Biochem Mol Biol2003842–322323012711007
- Cohen-LahavMDouvdevaniAChaimovitzCShanySThe anti-inflammatory activity of 1,25-dihydroxyvitamin D-3 in macrophagesJ Steroid Biochem Mol Biol200710355856217267205
- OjukaEORole of calcium and AMP kinase in the regulation of mitochondrial biogenesis and GLUT4 levels in muscleProc Nutr Soc200463227527815294043
- DunlopTWVäisänenSFrankCMolnárFSinkkonenLCarlbergCThe human peroxisome proliferator-activated receptor δ gene is a primary target of 1α,25-dihydroxyvitamin D3 and its nuclear receptorJ Mole Biol20053492248260
- KumarSDaviesMZakariaYImprovement in glucose tolerance and beta-cell function in a patient with vitamin D deficiency during treatment with vitamin DPostgrad Med J1994708244404438029165
- JafariTFallahAABaraniAEffects of vitamin D on serum lipid profile in patients with type 2 diabetes: a meta-analysis of randomized controlled trialsClin Nutr20163561259126827020528
- Ramiro-LozanoJMCalvo-RomeroJMEffects on lipid profile of supplementation with vitamin D in type 2 diabetic patients with vitamin D deficiencyTher Adv Endocrinol Metab20156624524826623001
- Hossein-nezhadASpiraAHolickMFInfluence of vitamin D status and vitamin D3 supplementation on genome wide expression of white blood cells: a randomized double-blind clinical trialPLoS One201383e5872523527013
- BreslavskyAFrandJMatasZBoazMBarneaZShargorodskyMEffect of high doses of vitamin D on arterial properties, adiponectin, leptin and glucose homeostasis in type 2 diabetic patientsClin Nutr201332697097523561637
- PatelPPoretskyLLiaoELack of effect of subtherapeutic vitamin D treatment on glycemic and lipid parameters in Type 2 diabetes: a pilot prospective randomized trialJ Diab2010213640
- de BoerIHKatzRChoncholMSerum 25-hydroxyvitamin D and change in estimated glomerular filtration rateClin J Am Soc Nephrol2011692141214921836148
- LiYCKongJWeiMChenZFLiuSQCaoLP1,25-Dihydroxyvitamin D(3) is a negative endocrine regulator of the renin-angiotensin systemJ Clin Invest2002110222923812122115
- ZhangZZhangYNingGDebDKKongJLiYCCombination therapy with AT1 blocker and vitamin D analog markedly ameliorates diabetic nephropathy: blockade of compensatory renin increaseProc Natl Acad Sci USA200810541158961590118838678
- de ZeeuwDAgarwalRAmdahlMSelective vitamin D receptor activation with paricalcitol for reduction of albuminuria in patients with type 2 diabetes (VITAL study): a randomised controlled trialLancet201037697521543155121055801