
Abstract
Background
This study investigated the ability of pulse pressure variation (PPV) and pleth variability index (PVI) to predict fluid responsiveness of patients undergoing spinal surgery in the prone position.
Patients and methods
A total of 53 patients undergoing posterior lumbar spinal fusion in the prone position on a Jackson table were studied. PPV, PVI, and hemodynamic and respiratory variables were measured both before and after the administration of 6 mL/kg colloid in both the supine and prone positions. Fluid responsiveness was defined as a 15% or greater increase in stroke volume index, as assessed by esophageal Doppler monitor after fluid loading.
Results
In the supine position, 40 patients were responders. The areas under the receiver operating characteristic (ROC) curves for PPV and PVI were 0.783 [95% CI 0.648–0.884, P<0.001] and 0.814 (95% CI 0.684–0.908, P<0.001), respectively. The optimal cut-off values of PPV and PVI were 10% (sensitivity 75%, specificity 62%) and 8% (sensitivity 78%, specificity 77%), respectively. In the prone position, 27 patients were responders. The areas under the ROC curves for PPV and PVI were 0.781 (95% CI 0.646–0.883, P<0.001) and 0.756 (95% CI 0.618–0.863, P<0.001), respectively. The optimal cut-off values of PPV and PVI were 7% (sensitivity 82%, specificity 62%) and 8% (sensitivity 67%, specificity 69%), respectively.
Conclusion
Both PPV and PVI were able to predict fluid responsiveness; their predictive abilities were maintained in the prone position.
Introduction
Determining whether a patient will respond to fluid resuscitation is one of the most important, yet often difficult tasks during the intraoperative period.Citation1,Citation2 Static indices such as central venous pressure lack accuracy in predicting fluid responsiveness despite their invasive nature.Citation3,Citation4 In contrast, some studies have demonstrated that dynamic indices based on heart–lung interactions are useful for predicting fluid responsiveness in mechanically ventilated patients.Citation5 Of these, accumulating evidence suggests that pulse pressure variation (PPV) is the most accurate predictor of fluid responsiveness.Citation6 More recently, increasing interest has focused on the availability of noninvasive dynamic indices, such as the pleth variability index (PVI). The PVI has been studied in various patient populations and clinical settings, and has been shown to reliably predict fluid responsiveness and guide fluid resuscitation.Citation7–Citation11
Surgical procedures of the spine are usually performed with the patient in the prone position, using a certain frame or table for the proper positioning of the patient. However, depending on the type of positioning device, the use of the prone position increases intra-abdominal and intra-thoracic pressures, which may affect heart–lung interactions during mechanical ventilation.Citation12,Citation13 Among the commonly used equipment for prone positioning, the Jackson table can minimize increases in intra-abdominal pressure and has minimal effects on cardiac function.Citation12 Nonetheless, physiological alterations following prone positioning may affect the reliability of dynamic indices for predicting fluid responsiveness, such as PPV and PVI; thus, the validity of these dynamic indices should not be extrapolated to surgical procedures performed with the patient in the prone position. Very few studies have investigated the predictive ability of these parameters on fluid responsiveness in patients undergoing spinal surgery in the prone position.Citation14,Citation15
The aim of this study was to evaluate the ability of PPV (invasive) and PVI (non-invasive) dynamic indices to predict fluid responsiveness in patients undergoing posterior lumbar spinal fusion in the prone position using a Jackson table.
Patients and methods
The study protocol was approved by the Institutional Review Board of the Yonsei University Health System, Seoul, South Korea (#4-2016-0189) and registered at ClinicalTrials.gov (NCT02826889). After receiving written informed consent from all patients, we enrolled 58 patients (19–75 years of age), with an American Society of Anesthesiologists physical status class of I–III, who were scheduled to undergo elective posterior lumbar interbody fusion in the prone position between May 2016 and July 2017. Exclusion criteria were as follows: cardiac rhythm other than sinus, valvular heart disease, left ventricular ejection fraction less than 50% on transthoracic echocardiography, history of lung disease, chronic kidney disease (estimated glomerular filtration rate <60 mL/min/1.73 m2), body mass index greater than 35 kg/m2, and contraindications to the insertion of an esophageal Doppler probe.
Upon arrival in the operating room, three-lead electrocardiography, noninvasive blood pressure, pulse oximetry, and bispectral index (BIS) monitoring were initiated. A Pulse CO-Oximetry probe (Masimo Rainbow SET; Masimo Corp, Irvine, CA, USA) connected to a monitoring system (Radical 7, software version 7.6.2.2; Masimo Corp) was attached to the patient’s index finger of either the right or left hand, contralateral to the side of the blood pressure cuff. Anesthesia was induced with propofol 1.0–2.0 mg/kg and remifentanil 0.5–2 µg/kg, followed by rocuronium 0.8 mg/kg for muscle relaxation to facilitate tracheal intubation. A catheter was then inserted into the radial artery, and the Intellivue MP70 monitor (Philips Medical Systems, Suresnes, France) was connected to the arterial line for monitoring automatically calculated PPV in real time using a previously described algorithm.Citation16 Mechanical ventilation was performed using a tidal volume of 10 mL/kg ideal body weight at an inspiratory-to-expiratory ratio of 1:2 without positive end-expiratory pressure. The ventilatory frequency was adjusted to maintain an end-tidal carbon dioxide tension of 35–40 mmHg. Anesthesia was maintained with both sevoflurane at a 0.7–1.5 age-adjusted minimal alveolar concentration in a 50/50 air/oxygen mixture and remifentanil 0.1–0.3 µg/kg/min, aiming for a BIS of 40–60. The esophageal Doppler probe was inserted into the esophagus and adjusted to detect optimum waveform signals with the esophageal Doppler monitor (CardioQ-ODM; Deltex Medical, Chichester, UK); stroke volume averaging was calculated over 10 heartbeats.Citation17 The position of the esophageal Doppler probe was adjusted as necessary before the collection of data to maintain optimum waveform signals.
After induction of anesthesia, heart rate, mean arterial pressure, cardiac index and stroke volume index (SVI) derived from the esophageal Doppler monitor, PPV monitored through the Intellivue MP70 monitor, PVI derived from Masimo Rainbow SET Pulse CO-Oximetry, and plateau airway pressure were recorded with the patient in the supine position, without any external stimuli. The static compliance of the respiratory system was calculated as Cstat = tidal volume/plateau pressure. The first round of volume expansion was performed by loading 6 mL/kg ideal body weight of 6% hydroxyethyl starch (130/0.4) over 10 minutes. Five minutes after the completion of fluid loading, the same hemodynamic and respiratory variables mentioned above were recorded, and the patients were transferred to the Jackson table (Model #5803, OSI; Mizuho OSI, CA, USA) in the prone position. During surgery, a second round of fluid loading was performed in the same manner as determined by the attending anesthesiologist. Hemodynamic and respiratory variables were recorded immediately before and 5 minutes after fluid loading, and care was taken not to apply any external stimuli to the patient during this period, with the cooperation of the surgeon. All parameters were recorded in a hemodynamically steady state without the use of vasopressors or inotropes. All variables were recorded by an anesthesiologist who was familiar with the use of the esophageal Doppler probe but not involved in the study.
Statistical analysis
Fluid responsiveness was defined as a 15% or greater increase in SVI after fluid loading.Citation18 Sample size estimation showed that at least 52 patients were necessary to detect a difference of 0.25 between the area under the receiver operating characteristic (ROC) curves of PPV (0.75)Citation10,Citation19 and the area under the null hypothesis (0.5) with a two-sided type I error of 0.05 and a type II error of 0.20, assuming a fluid responsiveness incidence of 77% in patients undergoing spinal surgery who are placed in the prone position. Considering a drop-out rate of 10%, 58 patients were enrolled in the study.
Normality of the data distribution was assessed using the Shapiro–Wilk test. Continuous variables were expressed as the mean ± SD if data were normally distributed or the median (interquartile range) if data were not normally distributed. Categorical variables were expressed as an absolute number (%). Responder and non-responder groups were compared in the normally distributed data using an independent t-test, non-normally distributed data were compared using the Mann–Whiney U-test, and categorical variables were compared using either the χ2 or Fisher’s exact test. The effects of volume loading or a change in body position on hemodynamic parameters were assessed using a paired t-test or Wilcoxon signed rank test. Spearman’s rank method was used to assess the relationship between the relative changes in dynamic indices and the percent change in SVI after volume loading. ROC curve analysis was performed to assess the ability of PPV and PVI to predict fluid responsiveness. Comparison of the two ROC curves was performed using the nonparametric technique proposed by DeLong et al.Citation20 The best cut-off value was determined using the minimum distance method.Citation21 The gray zone approach described by Coste et alCitation22 was used to determine the inconclusive range of each parameter. The cut-off values delimiting the gray zones were defined by the values associated with a sensitivity of 90% and a specificity of 90%. All statistical analyses were performed using SPSS (version 23; SPSS Inc., Chicago, IL, USA) and MedCalc (version 14.8.1; MedCalc, Ostend, Belgium) software programs. A P-value less than 0.05 was considered statistically significant.
Results
Of the 62 patients assessed for eligibility, four were excluded because of atrial fibrillation (n=1), left ventricular ejection fraction less than 50% (n=2), or a history of lung disease (n=1). Thus, 58 subjects were enrolled. Five patients were excluded because an optimal esophageal Doppler signal in the prone position could not be obtained; therefore, 53 patients were included in the final analysis (). Patient characteristics and perioperative details did not significantly differ between responders and non-responders in the supine and prone positions, respectively ().
Figure 1 Flow diagram of this study.
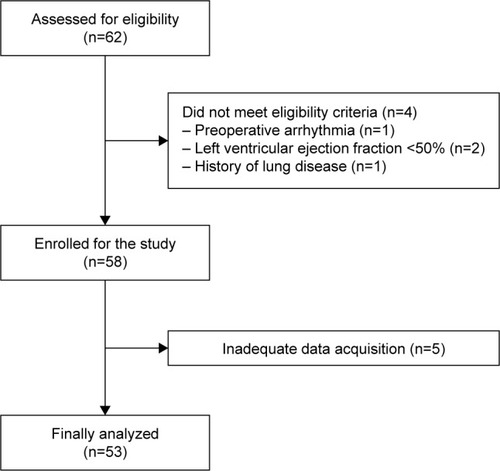
Table 1 Patient characteristics and perioperative details
shows the changes in hemodynamic variables and respiratory indices of all patients at each time point. The cardiac index and SVI were significantly increased, whereas PPV and PVI were significantly decreased after volume expansion in both positions. With volume expansion, static lung compliance was significantly decreased, whereas plateau airway pressure was significantly increased in both positions. When patients were turned to the prone position, cardiac index and SVI decreased, whereas PVI increased significantly. Static lung compliance was significantly reduced, whereas plateau airway pressure was significantly higher, when patients were in the prone position compared with the supine position. There was no significant change in PPV between the supine and prone positions.
Table 2 Hemodynamic variables and respiratory indices before and after fluid loading and changes in body position
In the supine position, 40 patients were responders and 13 patients were non-responders (). In both responders and non-responders, volume loading significantly increased cardiac index and SVI, and significantly decreased PPV and PVI. Baseline PPV and PVI values before volume loading were significantly higher in responders than in non-responders. However, baseline cardiac index and SVI did not significantly differ between the two groups.
Table 3 Hemodynamic variables before and after fluid loading in responders and non-responders placed in the supine position
In the prone position, 27 patients were responders and 26 patients were non-responders (). In both responders and non-responders, volume loading significantly increased cardiac index and SVI, and significantly decreased PPV and PVI. Baseline PPV and PVI values before volume loading were significantly higher in responders than in non-responders, whereas baseline SVI was significantly lower in responders. However, baseline cardiac index did not significantly differ between the two groups.
Table 4 Hemodynamic variables before and after fluid loading in responders and non-responders placed in the prone position
Percent change in PPV and PVI after volume loading correlated with the percent change in SVI in the supine position (rho=−0.300, 95% CI −0.527 to −0.032, P=0.029; rho=−0.351, 95% CI −0.567 to −0.089, P=0.010, respectively). The percent change in PPV and PVI after volume loading also correlated with the percent change in SVI in the prone position (rho=−0.633, 95% CI −0.771 to −0.437, P<0.001; rho=−0.609, 95% CI −0.755 to −0.405, P<0.001, respectively).
The ability of PPV and PVI to predict fluid responsiveness is shown in and . In the supine position, the areas under the ROC curves for PPV and PVI were 0.783 (95% CI 0.648–0.884, P<0.001) and 0.814 (95% CI 0.684–0.908, P<0.001), respectively. The optimal cut-off values of PPV and PVI were 10% (sensitivity 75%, specificity 62%) and 8% (sensitivity 78%, specificity 77%), respectively. The gray zone for PPV occurred between 8.2% and 13.9% and contained 18 (34%) patients. The gray zone for PVI occurred between 6.0% and 11.4% and contained 23 (43%) patients. In the prone position, the areas under the ROC curves for PPV and PVI were 0.781 (95% CI 0.646–0.883, P<0.001) and 0.756 (95% CI 0.618–0.863, P<0.001), respectively. The optimal cut-off values of PPV and PVI were 7% (sensitivity 82%, specificity 62%) and 8% (sensitivity 67%, specificity 69%), respectively. The gray zone for PPV occurred between 6.4% and 10.4% and contained 31 (58%) patients. The gray zone for PVI occurred between 6.5% and 10.7% and contained 31 (58%) patients. Diagnostic accuracy did not significantly differ between the use of PPV and the use of PVI in the supine (P=0.669) and prone (P=0.766) positions.
Figure 2 Receiver operating characteristic curves, showing the ability of PPV (solid line) and PVI (dashed line) before volume loading to discriminate responders from non-responders.
Abbreviations: PPV, pulse pressure variation; PVI, pleth variability index.
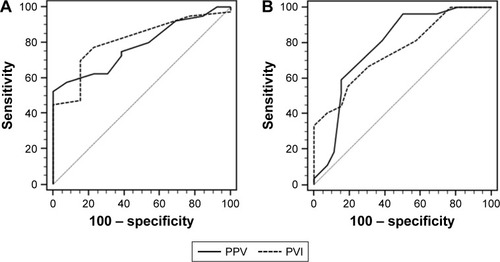
Table 5 Prediction of fluid responsiveness by receiver operating characteristic curves of pulse pressure variation and pleth variability index
Discussion
This study demonstrated that both PPV and PVI were useful for determining fluid responsiveness in patients undergoing spinal surgery in the supine or prone position using a Jackson table. We found only slight changes in optimal cut-off values for both indices when patients were moved from the supine to the prone position. However, the gray zones for these indices included a considerable number of patients.
The prone position is used commonly in patients undergoing spinal surgery to facilitate surgical access. However, placing a patient in the prone position induces physiological changes in the cardiovascular and respiratory systems.Citation13,Citation23 Pelvic and abdominal compression results in increased intra-abdominal pressure that puts direct pressure on the inferior vena cava, resulting in venous pooling and decreased venous return. Increased thoracic pressure causes decreased left ventricular compliance and filling, resulting in reductions in ventricular volume, stroke volume, and cardiac index, while raising central venous pressure.Citation12 In addition, increased intra-abdominal pressure causes a decrease in the compliance of the respiratory system and an increase in airway pressure, which can also decrease both venous return and cardiac output.Citation24 Considering that PPV has been suggested to be negatively affected by increased intra-abdominal pressure,Citation25 reduced lung compliance,Citation26 and increased right ventricular afterload,Citation27 the physiological changes associated with placing patients in the prone position could influence the predictability of PPV based on heart–lung interactions.
In the present study, however, we found that the ability of PPV to predict fluid responsiveness in such patients using a Jackson table was maintained in the prone position. These findings are consistent with those of two earlier studies, which reported that placing patients in the prone position using four pads (two chest and two pelvic supports) or a Wilson frame did not alter the ability of manually calculated PPV or automatically calculated PPV to predict fluid responsiveness, respectively, during spinal surgery ().Citation14,Citation15 Compared with the use of four pads or a Wilson frame, the use of a Jackson table is known to minimize increases in intra-abdominal pressure and have minimal effects on cardiac function. Therefore, considering that physiological changes that occur as a result of the placement of a patient in the prone position are mainly due to an increase in intra-abdominal pressure, the fact that the use of a Jackson table did not alter the ability of PPV to predict fluid responsiveness seems reasonable. In this study, when patients were placed in the prone position, the decrease of static lung compliance was only 1.2 mL/cmH2O. Importantly, unlike the use of four pads or a Wilson frame, a corresponding statistically significant increase in PPV was not found (). However, PPV was slightly less reliable in predicting fluid responsiveness in the present study compared with previous studies.Citation14,Citation15 As aging is reported to be associated with increased arterial stiffness,Citation28 and the patients in this study were older than those in previous studies, our results could be explained by altered arterial compliance, which is a major determinant of pulse pressure amplification and arterial pulse wave-based PPV.Citation29
Table 6 Characteristics of the studies that investigated the ability of dynamic indices to predict fluid responsiveness in patients undergoing spinal surgery in the prone position
The optimal cut-off value of PPV, however, was lower in patients in the prone position vs the supine position. Biais et al reported that in patients placed in the prone position using four pads, the cut-off value of PPV was 11% in the supine position and 15% in the prone position, unlike the findings in our study ().Citation14 Yang et al reported that, in patients placed in the prone position using a Wilson frame, the cut-off value of PPV was 15% in the supine position and 14% in the prone position, as in our study ().Citation15 There are several explanations for the discrepancies in cut-off value, the value itself and the change after the prone position, between this and two other studies. First, although the increased abdominal pressure in the prone position is a major factor, other factors such as increased afterload, decreased left ventricular compliance, decreased lung compliance and increased airway pressure may also affect the cut-off value of PPV for predicting fluid responsiveness. In a previous study using transesophageal echocardiography to detect changes in hemodynamic and cardiac functions after placing patients in different positioners, the decrease in cardiac output and stroke volume with the Wilson frame was likely due to the increase in myocardial wall tension associated with increased afterload caused by reduced chest wall compliance.Citation12 Therefore, the cut-off value of PPV may vary depending on clinical situation. The change in the cut-off values after prone position also may vary according to the positioners used. Second, the definition of fluid responsiveness and fluid loading were different. In previous studies, fluid responsiveness was defined as ≥15% increase in cardiac output or ≥10% increase in SVI after fluid loading.Citation14,Citation15 In this study, the responder was defined as a 15% or greater increase in SVI after fluid loading. Biais et alCitation14 used 500 mL colloid and we used 6 mL/kg ideal body weight of colloid for volume expansion. The timing of volume loading in this study was decided by the attending anesthesiologist as in other studies.Citation14,Citation15 These differences in definition and inconsistent timing of fluid loading may have resulted in different ROC curve analysis.
According to the previous studies, there is a significant correlation between intraoperative bleeding and abdominal pressure during lumbar spine surgery,Citation30 and reduction of abdominal pressure has been achieved by using the Jackson table.Citation31 The intraoperative mean blood loss in this study was lower than in Yang et al’s or in Biais et al’s study (). This may due to the use of the Jackson table as a prone positioner. This lower blood loss possibly kept relatively larger proportion of patients in the flat portion of the Flank–Starling curve during our study. Therefore, in this study which used ROC curve analysis (the binary approach based on a fixed definition of fluid responsiveness), the lower blood loss possibly affected the optimal cut-off value, decreased the predictive ability of PPV (and maybe also that of PVI), and increased the gray zone. This could be another possible explanation for the discrepancies in results from ROC curve analysis between this and the two previous studies.
PVI is a relatively new dynamic index that is based on a different mechanism from older indices such as PPV. A previous study that evaluated the ability of PVI to predict fluid responsiveness in patients undergoing noncardiac surgery reported an area under the ROC curve of 0.84 (95% CI 0.69–0.99) and a baseline value of greater than 10.5% for predicting a 10% increase in SVI.Citation11 Our PVI results of patients in the supine position are consistent with the results of this previous study.Citation11 However, although the predictive ability of PPV on fluid responsiveness in patients placed in the prone position using a Jackson table was statistically maintained, the area under the ROC curve for PVI in patients placed in the prone position was slightly smaller than in patients placed in the supine position, unlike for PPV. Peripheral vasoconstriction caused by vasoactive drugs, hypothermia, or responses to surgical stress can decrease the reliability of PVI.Citation32 In patients receiving a higher dose of vasoactive drug, it may be not possible to obtain a finger plethysmographic signal.Citation33 In this study, no vasoactive medications were administered during the measurement period, and PVI could be recorded in all patients. However, although peripheral temperature was not recorded in our study, peripheral temperature might drop when the PVI value is obtained in patients placed in the prone position compared to patients placed in the supine position due to prolonged exposure to operating room temperature. We also could think of the possibility of slight reduction of perfusion in the index finger caused by shoulder abduction in prone “surrender” position. Nevertheless, the ability of PVI to predict fluid responsiveness in patients placed in the prone position in the present study was acceptable.
Although ROC curve analysis is widely used to evaluate diagnostic tests, its limitation lies in that it uses a binary decision with a single cut-off value in differentiating the responders and the non-responders to fluid resuscitation.Citation34 Categorizing patients into two groups based on a single cut-off may result in false-positives, which can lead to inappropriate volume loading in patients for whom this may have deleterious effects. On the other hand, there is also the issue of false-negative diagnosis as patients who would actually benefit from volume resuscitation are withheld from volume loading. Therefore, in present study, the gray zone approach was applied to assess diagnostic accuracy of PPV and PVI for the prediction of fluid responsiveness. When a given value of PPV or PVI is in the gray zone, physicians should be aided by other clinical data for determining fluid responsiveness in order to evaluate the patient comprehensively. Conversely, if the measured value lies outside the gray zone, the necessity for fluid resuscitation can reliably excluded or confirmed.
Limitations
The present study has some limitations. We used an esophageal Doppler monitor to assess volume status. Although cardiac output and stroke volume were not assessed by the standard thermodilution technique using a catheter inserted into the pulmonary artery, the ability of the esophageal Doppler monitor to assess cardiac functions is well established.Citation35 Nevertheless, because the esophageal Doppler device assumes a fixed aortic area and a constant proportional descending aortic flow during systolic phase,Citation36 accurate measurement of cardiac output and stroke volume could be influenced by the alterations in aortic geometry or sympathetic tone. In addition, the use of an esophageal Doppler monitor is operator dependent.Citation37 To exclude inter-observer variations, esophageal Doppler probes were inserted and manipulated by a single experienced anesthesiologist in the present study.
Conclusion
Both PPV and PVI were able to predict fluid responsiveness in patients undergoing spinal surgery in the prone position using a Jackson table. However, these indices require cautious interpretation on the part of the anesthesiologist, because their gray zones include a considerable number of patients. In future studies, the ability of PPV and PVI to predict fluid responsiveness of patients placed in the prone position should be assessed using different positioning systems in various clinical situations.
Acknowledgments
This study was supported by a faculty research grant of Yonsei University College of Medicine (6-2015-0115).
Disclosure
The authors report no conflicts of interest in this work.
References
- GanTJSoppittAMaroofMGoal-directed intraoperative fluid administration reduces length of hospital stay after major surgeryAnesthesiology200297482082612357146
- KalantariKChangJNRoncoCRosnerMHAssessment of intravascular volume status and volume responsiveness in critically ill patientsKidney Int20138361017102823302716
- KumarAAnelRBunnellEPulmonary artery occlusion pressure and central venous pressure fail to predict ventricular filling volume, cardiac performance, or the response to volume infusion in normal subjectsCrit Care Med200432369169915090949
- OsmanDRidelCRayPCardiac filling pressures are not appropriate to predict hemodynamic response to volume challengeCrit Care Med2007351646817080001
- MarikPECavallazziRVasuTHiraniADynamic changes in arterial waveform derived variables and fluid responsiveness in mechanically ventilated patients: a systematic review of the literatureCrit Care Med20093792642264719602972
- YangXDuBDoes pulse pressure variation predict fluid responsiveness in critically ill patients? A systematic review and meta-analysisCrit Care201418665025427970
- CannessonMDesebbeORosamelPPleth variability index to monitor the respiratory variations in the pulse oximeter plethysmographic waveform amplitude and predict fluid responsiveness in the operating theatreBr J Anaesth2008101220020618522935
- HoodJAWilsonRJPleth variability index to predict fluid responsiveness in colorectal surgeryAnesth Analg201111351058106321965349
- LoupecTNanadoumgarHFrascaDPleth variability index predicts fluid responsiveness in critically ill patientsCrit Care Med201139229429921057311
- VosJJKalmarAFStruysMMWietaschJKHendriksHGScheerenTWComparison of arterial pressure and plethysmographic waveform-based dynamic preload variables in assessing fluid responsiveness and dynamic arterial tone in patients undergoing major hepatic resectionBr J Anaesth2013110694094623348202
- SiswojoASWongDMPhanTDKlugerRPleth variability index predicts fluid responsiveness in mechanically ventilated adults during general anesthesia for noncardiac surgeryJ Cardiothorac Vasc Anesth20142861505150925169895
- DharmavaramSJellishWSNockelsRPEffect of prone positioning systems on hemodynamic and cardiac function during lumbar spine surgery: an echocardiographic studySpine200631121388139316721305
- ChuiJCraenRAAn update on the prone position: Continuing Professional DevelopmentCan J Anaesth201663673776727072147
- BiaisMBernardOHaJCDegryseCSztarkFAbilities of pulse pressure variations and stroke volume variations to predict fluid responsiveness in prone position during scoliosis surgeryBr J Anaesth2010104440741320190260
- YangSYShimJKSongYSeoSJKwakYLValidation of pulse pressure variation and corrected flow time as predictors of fluid responsiveness in patients in the prone positionBr J Anaesth2013110571372023274783
- CannessonMSliekerJDesebbeOThe ability of a novel algorithm for automatic estimation of the respiratory variations in arterial pulse pressure to monitor fluid responsiveness in the operating roomAnesth Analg200810641195120018349192
- JørgensenCCBundgaard-NielsenMSkovgaardLTSecherNHKehletHStroke volume averaging for individualized goal-directed fluid therapy with oesophageal DopplerActa Anaesthesiol Scand2009531343819032566
- CannessonMLe ManachYHoferCKAssessing the diagnostic accuracy of pulse pressure variations for the prediction of fluid responsiveness: a “gray zone” approachAnesthesiology2011115223124121705869
- BiaisMEhrmannSMariAClinical relevance of pulse pressure variations for predicting fluid responsiveness in mechanically ventilated intensive care unit patients: the grey zone approachCrit Care201418658725658489
- DelongERDelongDMClarke-PearsonDLComparing the areas under two or more correlated receiver operating characteristic curves: a nonparametric approachBiometrics19884438378453203132
- KumarRIndrayanAReceiver operating characteristic (ROC) curve for medical researchersIndian Pediatr201148427728721532099
- CosteJPouchotJA grey zone for quantitative diagnostic and screening testsInt J Epidemiol200332230431312714554
- EdgcombeHCarterKYarrowSAnaesthesia in the prone positionBr J Anaesth2008100216518318211991
- SchonauerCBocchettiABarbagalloGAlbaneseVMoraciAPositioning on surgical tableEur Spine J200413Suppl 1S50S5515221573
- DíazFErranzBDonosoASalomonTCrucesPInfluence of tidal volume on pulse pressure variation and stroke volume variation during experimental intra-abdominal hypertensionBMC Anesthesiol20151512726395001
- MonnetXBleibtreuAFerréAPassive leg-raising and end-expiratory occlusion tests perform better than pulse pressure variation in patients with low respiratory system complianceCrit Care Med201240115215721926581
- Wyler von BallmoosMTakalaJRoeckMPulse-pressure variation and hemodynamic response in patients with elevated pulmonary artery pressure: a clinical studyCrit Care2010143R11120540730
- LaurentSCockcroftJVan BortelLExpert consensus document on arterial stiffness: methodological issues and clinical applicationsEur Heart J200627212588260517000623
- SegersPMahieuDKipsJAmplification of the pressure pulse in the upper limb in healthy, middle-aged men and womenHypertension200954241442019546377
- ParkCKThe effect of patient positioning on intraabdominal pressure and blood loss in spinal surgeryAnesth Analg200091355255710960374
- NuttallGAHorlockerTTSantrachPJOliverWCDekutoskiMBBryantSPredictors of blood transfusions in spinal instrumentation and fusion surgerySpine200025559660110749636
- BrochOBeinBGruenewaldMAccuracy of the pleth variability index to predict fluid responsiveness depends on the perfusion indexActa Anaesthesiol Scand201155668669321480831
- MonnetXGuérinLJozwiakMPleth variability index is a weak predictor of fluid responsiveness in patients receiving norepinephrineBr J Anaesth2013110220721323103777
- RayPLe ManachYRiouBHouleTTStatistical evaluation of a biomarkerAnesthesiology201011241023104020234303
- SchoberPLoerSASchwarteLAPerioperative hemodynamic monitoring with transesophageal Doppler technologyAnesth Analg2009109234035319608800
- ValtierBCholleyBPBelotJPde La CoussayeJEMateoJPayenDMNoninvasive monitoring of cardiac output in critically ill patients using transesophageal DopplerAm J Respir Crit Care Med1998158177839655710
- LefrantJYBruellePAyaAGTraining is required to improve the reliability of esophageal Doppler to measure cardiac output in critically ill patientsIntensive Care Med19982443473529609413