
Abstract
Purpose
The effect of glucocorticoid(s) on connective tissue disease (CTD)-related interstitial lung disease (ILD) is controversial. This multicenter study aimed to identify glucocorticoid-sensitive patients using a radiomics approach.
Methods
A total of 416 CTD-ILD patients who began glucocorticoid treatment at the discretion of the attending physician, with or without cyclophosphamide, were included in this study. High doses were defined as pulsed intravenous methylprednisolone, an initial dose of 1 mg/kg/day of prednisolone or 0.8 mg/kg/day of methylprednisolone. Low doses were defined as those less than high doses. Radiomics features were manually extracted from primary lung lesions delineated on computed tomography images, and selected by variance, univariate feature selection, and least absolute shrinkage and selection operator regression model. The prediction models were developed using data from 309 patients from two centers and externally validated in 107 patients from four other hospitals.
Results
Treatment response in the training and validation groups was 38.5% and 36.4%, respectively. Eleven radiomics features were selected from 1,029 features with predictive value. Random forest models built for radiomics features to predict treatment response yielded a sensitivity of 0.897. The calibration curve of a nomogram demonstrated good agreement between prediction and observation. Decision curve analysis indicated that glucocorticoid was beneficial if the predicted response rate was 50%–60% for an individual. High doses of glucocorticoids and cyclophosphamide yielded superior efficacy.
Conclusion
Radiomics-based predictive models reliably identified glucocorticoid-sensitive CTD-ILD patients. Short-term, high-dose glucocorticoid with cyclophosphamide yielded promising results as a potential therapy.
Plain language summary
This multicenter study developed radiomics-based predictive models to assess the response to glucocorticoid treatment of connective tissue disease (CTD)-related interstitial lung disease (ILD). The radiomics-based predictive system was built using data from patients from two centers and was externally validated in patients from four other hospitals, which indicated that this technology yielded reasonable universality. An optimal glucocorticoid dose (pulsed intravenous methylprednisolone, an initial dose of 1 mg/kg/day of prednisolone or 0.8 mg/kg/day of methylprednisolone) was identified, which may be used as guidance for future clinical practice in CTD-ILD. Glucocorticoid doses for each patient were not identical because this was not a clinical trial.
Introduction
Interstitial lung diseases (ILD) are a heterogeneous group of disorders characterized by inflammation and/or fibrosis of the lungs, varying from idiopathic interstitial pneumonias to secondary variants, including ILD-associated connective tissue diseases (CTD).Citation1 ILD with fibrosis is often incurable and is associated with significant morbidity and mortality.Citation2 Treatments for CTD-ILD have been controversial and lack widely acknowledged supportive evidence. Glucocorticoid, cyclophosphamide, azathioprine, and mycophenolate mofetil have been the most extensively studied agents.Citation3,Citation4 Among these, glucocorticoids are widely used in the management of CTD-ILD, but with little clinical trial–based evidence and no consensus regarding the route of administration, dosage, and course.Citation5,Citation6 Nevertheless, the treatment efficacy of glucocorticoids is far from satisfactory.Citation7 Because long-term and high-dose glucocorticoid treatment usually results in severe side effects,Citation8 identifying patients who are likely to respond to glucocorticoids would be a potential solution to improve prognosis.
Notably, advances in image analysis algorithms and radiomics have made it possible to reproducibly and automatically quantify imaging phenotypes by extracting a large number of image features.Citation9 Radiomics has attracted increased attention in recent years and offers prognostic and diagnostic value in multiple diseases, especially malignancies.Citation10,Citation11 Radiomics converts medical images into high-dimensional, mineable data via high-throughput extraction of quantitative features, followed by subsequent data analysis for decision support. Image analysis provides information that cannot be identified by the naked eye. This process of radiomics-based stratification can provide a far more detailed characterization of phenotype than current criteria, which may lead to a new era in defining CTD-ILD. The target of CTD-ILD stratification should be treatment guidance, in which radiomics has a promising role. However, radiomics has yet to be applied to ILD.
In this multicenter study, we investigated engineered lesion radiomics features extracted from high-resolution computed tomography (HRCT) images and tested these features against the efficacy of glucocorticoid with or without cyclophosphamide. Predictive models based on radiomics features and clinical data were constructed using a training cohort of patients from two institutions and subsequently validated in patients from four other hospitals. The study aimed to develop a practical methodology to predict treatment response to glucocorticoids for future clinical applications.
Materials and methods
Study population
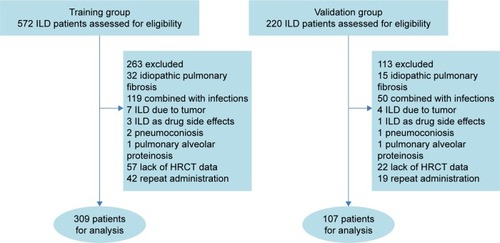
Six hospitals participated in this study. Patients from the Third Affiliated Hospital of Sun Yat-sen University and the Third Affiliated Hospital of Guangzhou Medical University (Guangzhou, Guangdong, China) comprised the training group. Patients from ChanCheng District Center Hospital, The LingNan Hospital of Sun Yat-sen University, Hengyang City Center Hospital, and The First Affiliated Hospital of JINAN University comprised the validation group. CTD-ILD was diagnosed based on clinical and HRCT dataCitation12 after discussion involving a multi-disciplinary diagnosis group consisting of respiratory physicians and thoracic radiologists. A total of 572 patients, who were initially diagnosed with ILD with stable extra-thoracic manifestations between June 2013 and September 2017, were evaluated as the training group; 309 patients who were administered glucocorticoid were included in this study. Of the 220 patients in the validation group, 107 were included in this study. A total of 376 patients (training group, n=263; validation group, n=113) were excluded for the following reasons: idiopathic pulmonary fibrosis; acute infections confirmed by clinical symptoms; routine bacterial and viral bronchoalveolar lavage fluid antibody titers and cultures for pathogenic microorganisms; ILD due to tumor; drug side effects due to ILD medications; pneumoconiosis, pulmonary alveolar proteinosis; lack of HRCT data; and repeated administration (). Before radiomics analysis, the diagnosis was independently re-evaluated according to consensus of three experienced diagnostic groups consisting of a thoracic radiologist and an experienced pulmonary specialist (YFG and YQZ; JQ and TTZ; CFL and DYF) on different occasions. The evaluations were performed in random order and the evaluators were unaware of the clinical diagnosis. This retrospective study was conducted in compliance with institutional policies to protect patient privacy and was approved by the institutional review board of the hospitals that participated in this study. Written informed consent was obtained from all patients.
Figure 1 Screening of CTD-ILD patients.
Treatment and follow-up
Glucocorticoid treatment was administered as pulsed intravenous methylprednisolone, 0.75–1 mg/kg/day of prednisolone or 0.6–0.8 mg/kg/day of methylprednisolone). Glucocorticoid doses were stratified into high and low groups. High dosages were defined as pulsed intravenous methylprednisolone, an initial dose of 1 mg/kg/day of prednisolone or 0.8 mg/kg/day of methylprednisolone. Low dosages were defined as an initial dose of <1 mg/kg/day of prednisolone or <0.8 mg/kg/day of methylprednisolone. All patients were administered oral prednisolone or methylprednisolone for at least 1 month (median 5 months). All patients started or increased dosage of glucocorticoid with or without cyclophosphamide at the discretion of the attending physician. Disease-modifying anti-rheumatic drugs used before diagnosis of ILD were not changed before the response to treatment was assessed.
Assessment of treatment response
Clinical response was assessed according to symptoms and HRCT data 2–6 weeks after initial administration of glucocorticoid. Treatment response was defined by comparison with the condition before treatment: respiratory symptoms had improved and the radiographic lesions decreased by >10% for at least 3 months.Citation13 To investigate the long-term treatment response, a proportion of patients underwent assessment after 3–6 months of follow-up. Pulmonary function tests (PFTs) were performed at baseline and at 3–6 months. The three experienced diagnostic groups independently evaluated all forced vital capacity results for adequacy and repeatability, according to criteria from the American Thoracic Society.Citation14
Data collection
HRCT was performed according to the standard clinical scanning protocols at the institutions and without intravenous contrast. The slice thickness ranged from 1 to 5 mm (median, 3 mm).
Patient and public involvement
The patients and public were not involved in the design and conduct of this study.
Radiomics quantification
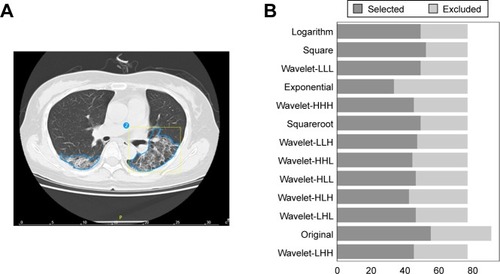
HRCT imaging phenotypes were described using a set of quantitative radiomics features extracted from the segmented lesion regions on the computed tomography (CT) scans. Briefly, CT images and lesion contours were imported into Radcloud (Huiying Medical Technology Co., Ltd, Beijing, China). Due to differences in pixel spacing and slice thickness, the image and lesion contours were subsequently normalized to isometric voxels (3 mm) using cubic interpolation. The primary lung lesions were manually delineated on the CT images by two independent thoracic radiologists (CFL and YFG) (). All contours were reviewed by the senior radiologist (JQ). All discrepancies were discussed by the three thoracic radiologists and two respiratory specialists. Subsequently, feature extraction was performed using an in-house developed Radiomics plug-in for 3DSlicer. A total of 1,029 radiomics features were included. The primary feature clusters were as follows: a gray-level size zone (GLSZM) quantifies gray-level zones in an image. A gray-level zone is defined as the number of connected voxels that share the same gray-level intensity. A gray-level run length matrix (GLRLM) quantifies gray-level runs, which are defined as the length in number of pixels and consecutive pixels that have the same gray-level value. The variability of gray-level intensity (GLN) values in the image was measured, with a lower value indicating more homogeneity in intensity values. Cluster shade is a measure of the skewness and uniformity of the gray level co-occurrence matrix (GLCM). A higher cluster shade reflects greater asymmetry in the mean. Cluster prominence is a measure of the skewness and asymmetry of the GLCM. A higher value reflects more asymmetry, and a lower value indicates a peak near the mean value and less variation around the mean. Large Area Emphasis (LAE) is a measure of the distribution of large area size zones, with a greater value indicative of larger size zones and more coarse textures. Long run high gray-level run emphasis (LRHGLRE) measures the joint distribution of long-run lengths with higher gray-level values. Overall, the primary features contained 19 first-order, 15 shape, 27 GLCM and 16 GLRLM features, and 16 GLSZM values. The secondary features were exponential, square, square root, logarithm, and wavelet transformation of the primary features.
Figure 2 Feature selection.
Data analysis
To build the radiomics model, the following steps were performed in the training group and the models were tested in the validation group. Features with variance <0.8 were excluded from further analysis. Then, the associations between the imaging phenotype and the treatment response in the integrated dataset were analyzed using ANOVA, a method of univariate feature selection. Features were removed when P-values exceeded 0.05. In the third step, the least absolute shrinkage and selection operator (LASSO) method, which is suitable for the regression of high-dimensional data,Citation15 was used to select the most useful predictive features from the primary data set. The minimum mean square error was computed using a cross-validation method with five folds. According to the error, the best penalty parameter alpha of LASSO was obtained. Finally, features with nonzero coefficients were screened out for model training.
Development of an individualized prediction model
A random forest (RF) methodCitation16 and k-nearest neighbors (k-NN) were applied to develop radiomics-based diagnostic models for treatment using the training cohort. Furthermore, clinical factors in features were added to build new models. Four models were evaluated according to the area under the receiver operating characteristic (ROC) curve (AUC). A radiomics score (Rad-score) was calculated for each patient via a linear combination of selected features and weighted according to their respective coefficients.Citation15 To provide the clinician with a quantitative tool to predict individual probability of treatment response, a nomogram was built on the basis of multivariable logistic analysis in the training group. For the nomogram, a radiomics score was calculated via a linear combination of selected radiomics features whose weights were dependent on logistic regression. The logistic regression was based on clinical factors and radiomics signatures were transformed to a nomogram.
Clinical use
To ascertain the clinical value of the nomogram, a decision curve was plotted to quantify the net benefits at different threshold probabilities in the validation dataset.Citation15
Results
Clinical characteristics
Patient characteristics in the training and validation cohorts were similar except for primary diseases. Patients in the training group presented with more undifferentiated CTD (29.1% vs 3.7%) and less rheumatoid arthritis (6.8% vs 46.7%); 22.3% and 18.7% patients received high doses of glucocorticoid, with 30.4% and 36.4% patients administered cyclophosphamide in the training and validation groups, respectively. Treatment response rates in the training and validation groups were 38.5% and 36.4%, respectively (). Thirty-four (11.0%) patients in the training group and 20 (18.7%) in the validation group experienced only symptom improvement or objective imaging response. Some patients in the training group (n=129 [41.7%]) and 23 (21.5%) in the validation group exhibited a treatment response at 3–6 months’ follow-up; 121 (93.8%) in the training group and 22 (95.7%) in the validation group exhibited the same results compared with their treatment response evaluated at 2–6 weeks’ follow-up. Fifty-three (17.1%) patients in the training group and 33 (30.8%) in the validation group underwent PFT before and 3–6 months after glucocorticoid treatment. Improvement in PFT was consistent with the treatment response criterion, which was 45 (84.9%) and 27 (81.8%).
Table 1 Patient characteristics in the training and testing cohorts
In the training group, patients with treatment response had higher cyclophosphamide use and higher dosage of glucocorticoids. In the validation group, patients who exhibited a treatment response were younger and used a higher dosage of glucocorticoids ().
Table 2 Characteristics of patients who responded or did not respond to treatment in the training and testing cohorts
Feature selection and radiomics signature building
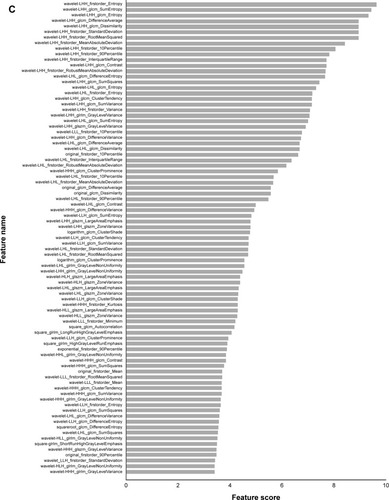
According to a variance threshold of 0.8, 1,029 texture features were reduced to 615 potential predictors based on 165 patients in the training cohort (). Univariate analysis of the associations between imaging phenotype and the treatment response identified 85 promising features (). The LASSO logistic regression model was then used to minimize the number of features. The best performance of LASSO regression was built using a penalty parameter α=1.7432, as the mean square error was minimized. With nonzero coefficients, prognostic features were reduced to 11 (, ). The scale of the primary radiomics features confirmed that the derived conclusions were comprehensive and reliable, and the reduction protocol enabled the prediction models to avoid overfitting.
Figure 3 Feature selection using the LASSO binary logistic model.
Abbreviation: LASSO, least absolute shrinkage and selection operator.
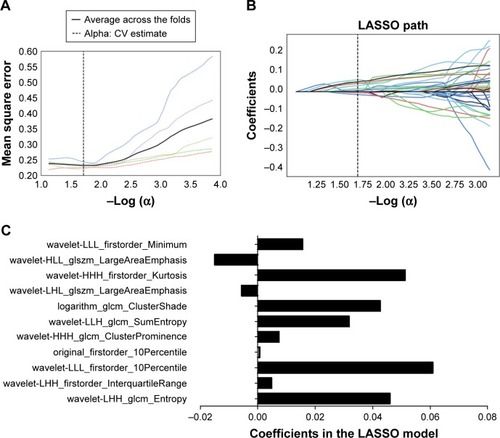
Table 3 LASSO coefficient profiles of the eleven features
Development of an individualized prediction model
Models of RF and k-NN were built using radiomics features and response data from the training cohort, and their performance was evaluated in the validation cohort. ROC curves indicated that the AUCs were 0.66 in RF models and 0.61 in k-NN model (). The clinical data were then integrated into the training RF and k-NN models, which yielded AUCs of 0.71 and 0.61 (). With the addition of clinical data, the prediction performance of the RF model was improved (sensitivity =0.897). The result computed from the logistic regression of radiomics features and clinical data is shown in the nomogram (). The calibration curve for the probability of treatment response in the training and validation cohorts demonstrated good agreement between prediction and observation ().
Figure 4 ROC curves for machine learning of radiomics to predict treatment response.
Abbreviations: AUC, area under the curve; k-NN, k-nearest neighbors; RF, random forest; ROC, receiver-operating characteristic.
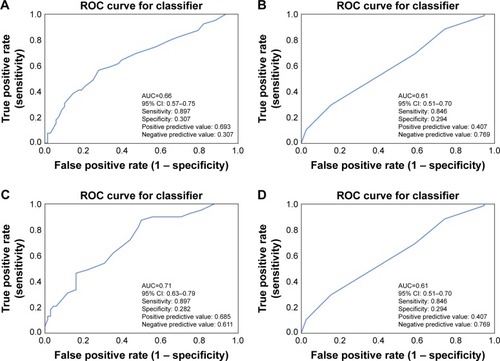
Figure 5 Developed radiomics nomogram.
Abbreviation: ICU, intensive care unit.
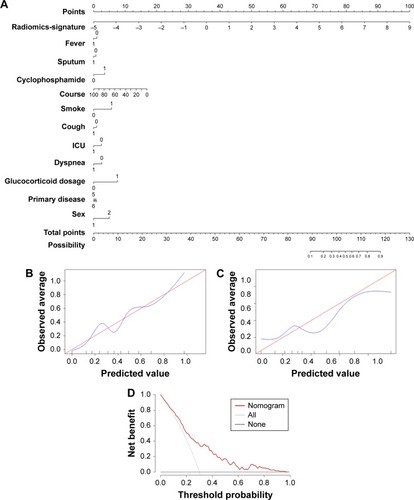
Clinical use
Decision curve analysis for the radiomics and clinical data nomogram () demonstrated that if the threshold probability of a patient was between 20% and 60%, using the radiomics nomogram to predict treatment response added more benefit than either the treat-all-patients scheme or the treat-none scheme. Because the response rate was 38.5% and 36.4% in the training and validation groups, respectively, it could be assumed that glucocorticoid would be beneficial if the predicted response rate was 50%–60% for an individual according to the radiomics and clinical data nomogram.
Discussion
CTD-ILD is highly heterogeneous,Citation1 and treatment strategies have been controversial given the lack of widely acknowledged remedies. Although glucocorticoids have been widely used to treat CTD-ILD, there is a lack of supportive, clinical trial-based evidence.Citation5,Citation6 This situation may partially be caused by low treatment response rates, a high incidence of side effects, and difficulty in disease stratification.Citation17 Part of CTD-ILD is considered to be sensitive to glucocorticoid, such as acute exacerbation of chronic lung injury.Citation7 The early use of glucocorticoids may be of some help for prognosis. However, long-term glucocorticoid treatment may lead to infection, osteoporosis, gastrointestinal bleeding, and other severe side effects. Nevertheless, the timing of glucocorticoid therapy in patients with ILD remains a clinical puzzle.Citation18 A solution to this issue may involve identifying patients who are sensitive to glucocorticoid treatment. In the present study, the treatment response to glucocorticoid was 36.4%–38.5%, which was disappointing given its potential side effects. However, among patients who were predicted to be sensitive to glucocorticoid using the radiomics approach, the treatment response increased to 68.5%. Thus, the present study identified a group of patients with a doubled response rate to glucocorticoid.
CTD-ILD can be stratified according to multiple criteria including primary disease, histopathological pattern of lesions, and a few classic findings on HRCT.Citation19 However, none of these classifications aim to predict treatment response. In ILD patients, previous studies investigating glucocorticoid treatment suggested that nonspecific interstitial pneumonia was sensitive to treatment and that usual interstitial pneumonia was refractory.Citation4,Citation20 However, pathological biopsy is difficult to obtain from these patients. According to data in our nomogram, diagnosis of CTD contributed little to the treatment response, and radiomics played the dominant role in treatment efficacy. Our findings suggest that CTD-ILD with stable extra-thoracic manifestations should be treated as a whole for glucocorticoid-based remedies. Previous studies investigating glucocorticoid treatment of ILD were mainly based on small sample sizes, or the treatment strategies were based on individual decisions.Citation5,Citation21,Citation22 Thus, it is difficult to directly compare treatment responses among studies. Treatment strategies involving glucocorticoid have not been standardized according to consensus.Citation17 In the present study, which had a relatively adequate sample size, we found that high doses of glucocorticoid (pulsed intravenous methyl-prednisolone [initial dose of 1 mg/kg/day of prednisolone or 0.8 mg/kg/day of methylprednisolone]) with cyclophosphamide may be a promising combination in the treatment of CTD-ILD.
HRCT is a noninvasive technology for the diagnosis of ILD. Many studies have reported that HRCT is very important in determining the extent and severity of ILD.Citation23–Citation25 The distribution and manifestation of HRCT lesions may be related to the pathological type of ILD.Citation23 Patterns of ILD have been characterized by a few HRCT manifestations, including ground-glass opacities, interlobular septal thickening, and grid-like, honeycomb-like lesions.Citation13,Citation26 However, a patient may present all types of lesions. Joseph Jacob et al and other studies found that HRCT score was also associated with prognosis in CTD-ILD patients.Citation24 However, these scores are qualitative instead of quantitative, which limit their accuracy. RadiomicsCitation10,Citation11 converts medical images into high-dimensional, mineable data via high-throughput extraction of quantitative features, followed by subsequent data analysis for decision support. Results of the present study suggest that radiomics could be used to stratify CTD-ILD patients into glucocorticoid-sensitive and non-sensitive patients.
Limitations
The present study lacked survival and PFT data, which were designated to be the ultimate goal in the treatment of ILD. Only 53 (17.1%) patients in the training group and 33 (30.8%) in the validation group underwent PFT before and after glucocorticoid administration. We found that improvement in PFT was consistent with our treatment response criterion, which was 45 (84.9%) and 27 (81.8%). Although PFT was not included in our study, the accuracy of our treatment response evaluation should reflect PFT evolution. Moreover, the majority of patients did not undergo long-term treatment response assessment due to the retrospective nature of the present investigation. Moreover, the present study mainly involved Chinese subjects. Although the present investigation was a multicenter study, the results cannot be generalized to other populations. Thus, more multicenter studies and global collaborations are needed to determine a precise predictive tool for treatment selection.
In summary, the present study built a predictive model using radiomics and clinical data to stratify CTD-ILD patients into glucocorticoid-sensitive and non-sensitive subgroups. In the sensitive group, the treatment response was double that of the unselected population. Future clinical trials investigating radiomics-guided glucocorticoid treatment are warranted.
Data sharing statement
Both datasets are available from the corresponding author. There are no additional unpublished data.
Author contributions
Tian-Tuo Zhang and Xing Li designed this study, interpreted the data, and are the guarantor of the paper, taking responsibility for the integrity of the work as a whole, from inception to publication of the article. Xing Li and Yan-Fang Xing wrote the manuscript. Ding-Yun Feng, Yu-Qi Zhou, Chuang-Feng Li, Jie Qin, Yue-Fei Guo, and Tian-Tuo Zhang evaluated the patients. Chuang-Feng Li, Jie Qin, and Yue-Fei Guo defined the lesion. Qing Lv, Yan-Fang Xing, Nan Jiang, Hai-Tao Hu, Jie Chen, Liang-Hong Yin, and Xing-Hua Guo collected the patients. Xing Li, Xing Yan-Fang, and Ding-Yun Feng conducted statistical analysis. Jie Dong and Chencui Huang conducted the radiomics analysis. All authors contributed toward data analysis, drafting and revising the paper and agree to be accountable for all aspects of the work.
Acknowledgments
This study was supported by National Natural Science Foundation of China (81700645 and 31600710), Natural Science Foundation of Guangdong (No 2017A030313537 and 2016A030313302), Guangzhou science and technology plan (201709010030), the Scientific Research Project of Guangzhou Municipal Universities (1201630019) and Guangzhou industry university research cooperative innovation major project (2014y2-00510), and Guangdong science and technology project in the field of social development (2013B021400002).
Disclosure
The authors report no conflicts of interest in this work.
References
- FerriCManfrediASebastianiMInterstitial pneumonia with autoimmune features and undifferentiated connective tissue disease: Our interdisciplinary rheumatology-pneumology experience, and review of the literatureAutoimmun Rev2016151617026384526
- StormeMSemionovAAssayagDEstimating the incidence of interstitial lung diseases in the Cree of Eeyou Istchee, northern QuébecPLoS One2017129e018454828886193
- MaherTMImmunosuppression for connective tissue disease-related pulmonary diseaseSemin Respir Crit Care Med201435226527324668541
- MigitaKAraiTJiuchiYPredictors of mortality in patients with interstitial lung disease treated with corticosteroids: results from a cohort studyMedicine20149326e17525474431
- SharmaNPutmanMSVijRStrekMEDuaAMyositis-associated Interstitial Lung Disease: Predictors of Failure of Conventional Treatment and Response to Tacrolimus in a US CohortJ Rheumatol201744111612161828864644
- GoDJParkJKKangEHSurvival benefit associated with early cyclosporine treatment for dermatomyositis-associated interstitial lung diseaseRheumatol Int201636112513126223808
- Robles-PerezAMolina-MolinaMTreatment Considerations of Lung Involvement in Rheumatologic DiseaseRespiration201590426527426461464
- RiceJBWhiteAGScarpatiLMWanGNelsonWWLong-term Systemic Corticosteroid Exposure: A Systematic Literature ReviewClin Ther201739112216222929055500
- GilliesRJKinahanPEHricakHRadiomics: Images Are More than Pictures, They Are DataRadiology2016278256357726579733
- AertsHJVelazquezERLeijenaarRTDecoding tumour phenotype by noninvasive imaging using a quantitative radiomics approachNat Commun20145400624892406
- ScrivenerMde JongEECvan TimmerenJEPietersTGhayeBGeetsXRadiomics applied to lung cancer: a reviewTransl Cancer Res201654398409
- TravisWDCostabelUHansellDMAn official American Thoracic Society/European Respiratory Society statement: Update of the international multidisciplinary classification of the idiopathic interstitial pneumoniasAm J Respir Crit Care Med2013188673374824032382
- HuYWangLSWeiYRClinical Characteristics of Connective Tissue Disease-Associated Interstitial Lung Disease in 1,044 Chinese PatientsChest2016149120120826447566
- MillerMRHankinsonJBrusascoVStandardisation of spirometryEur Respir J200526231933816055882
- HuangYQLiangCHHeLDevelopment and Validation of a Radiomics Nomogram for Preoperative Prediction of Lymph Node Metastasis in Colorectal CancerJ Clin Oncol201634182157216427138577
- Rios VelazquezEParmarCLiuYSomatic Mutations Drive Distinct Imaging Phenotypes in Lung CancerCancer Res201777143922393028566328
- LeeJSFischerACurrent and emerging treatment options for interstitial lung disease in patients with rheumatic diseaseExpert Rev Clin Immunol201612550952026752397
- BehrJNeuserPPrasseAExploring efficacy and safety of oral Pirfenidone for progressive, non-IPF lung fibrosis (RELIEF) – a randomized, double-blind, placebo-controlled, parallel group, multi-center, phase II trialBMC Pulm Med201717112228877715
- TsuchiyaYFischerASolomonJJLynchDAConnective Tissue Disease-related Thoracic DiseaseClin Chest Med201536228329726024605
- LiXChenCXuJNonspecific interstitial pneumonia and usual interstitial pneumonia: comparison of the clinicopathologic features and prognosisJ Thorac Dis20146101476148125364525
- ReinaDRoig VilasecaDTorrente-SegarraVSjögren’s syndrome-associated interstitial lung disease: A multicenter studyReumatol Clin201612420120526573882
- AdlerSHuscherDSiegertESystemic sclerosis associated interstitial lung disease – individualized immunosuppressive therapy and course of lung function: results of the EUSTAR groupArthritis Res Ther20182011729382380
- JunSParkBSeoJBLeeSKimNDevelopment of a Computer-Aided Differential Diagnosis System to Distinguish Between Usual Interstitial Pneumonia and Non-specific Interstitial Pneumonia Using Texture- and Shape-Based Hierarchical Classifiers on HRCT ImagesJ Digit Imaging201831223524428884381
- JacobJBartholmaiBJRajagopalanSEvaluation of computer-based computer tomography stratification against outcome models in connective tissue disease-related interstitial lung disease: a patient outcome studyBMC Med201614119027876024
- ToyodaYHanibuchiMKishiJClinical features and outcome of acute exacerbation of interstitial pneumonia associated with connective tissue diseaseJ Med Invest2016633–429429927644575
- VijRNothIStrekMEAutoimmune-featured interstitial lung disease: a distinct entityChest201114051292129921565966